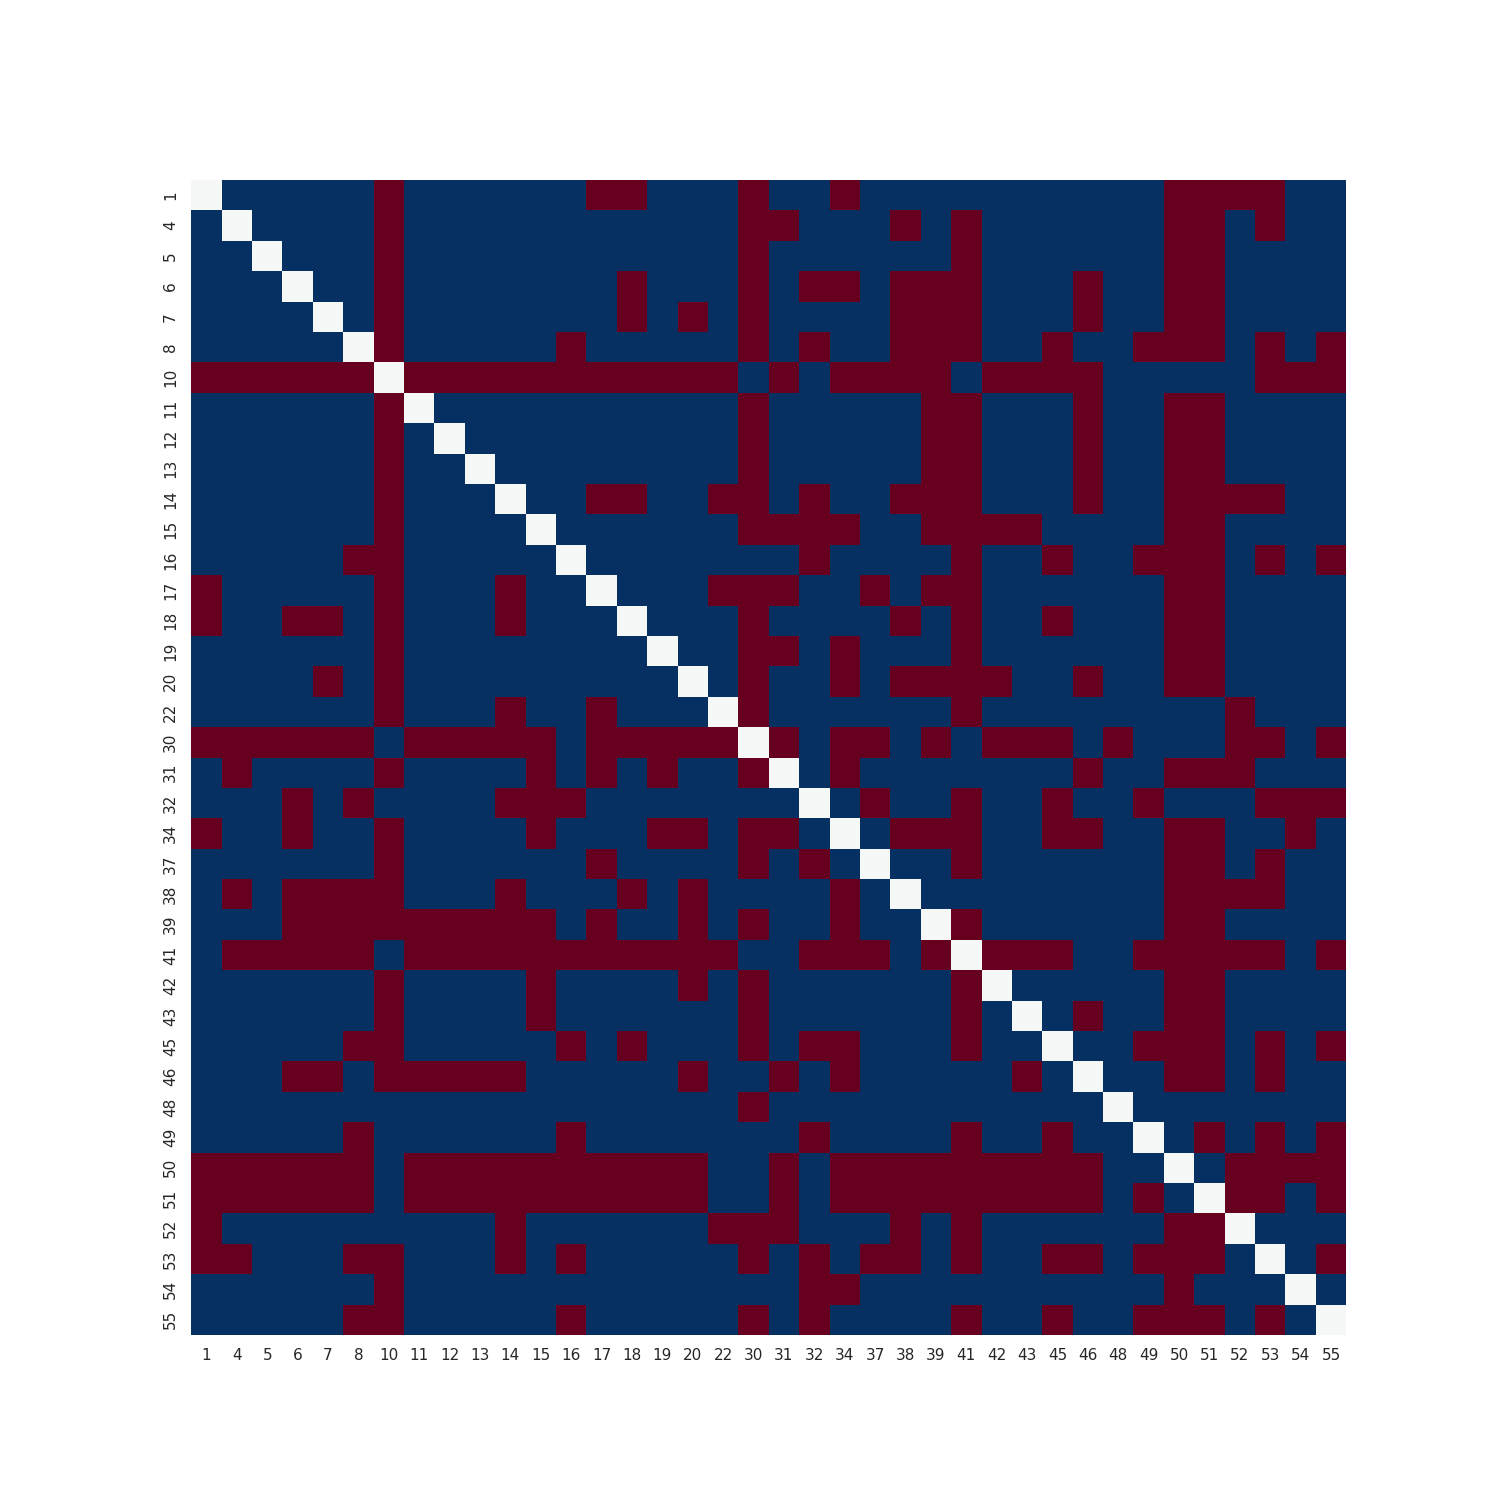
$ git clone https://github.com/kdknigga/zwavejs_neighbor_graph.git
$ cd zwavejs_neighbor_graph
$ python3 -m virtualenv venv
$ source venv/bin/activate
$ pip install -r requirements.txt
$ python ./zwavejs_neighbor_graph.py --help
usage: zwavejs_neighbor_graph.py [-h] -f INPUT_FILE [-o OUTPUT_FILE] [-c COLOR_MAP]

optional arguments:
  -h, --help            show this help message and exit
  -f INPUT_FILE, --input-file INPUT_FILE
                        zwavejs2mqtt nodes dump json file for input
  -o OUTPUT_FILE, --output-file OUTPUT_FILE
                        the name of the png file to output (default: neighbor_graph.png)
  -c COLOR_MAP, --color-map COLOR_MAP
                        The matplotlib colormap to use (default: RdBu)

$ python ./zwavejs_neighbor_graph.py --input-file nodes_dump.json

$ ls -l neighbor_graph.png
-rw-rw-r-- 1 kris kris 41730 Oct 28 10:42 neighbor_graph.png
