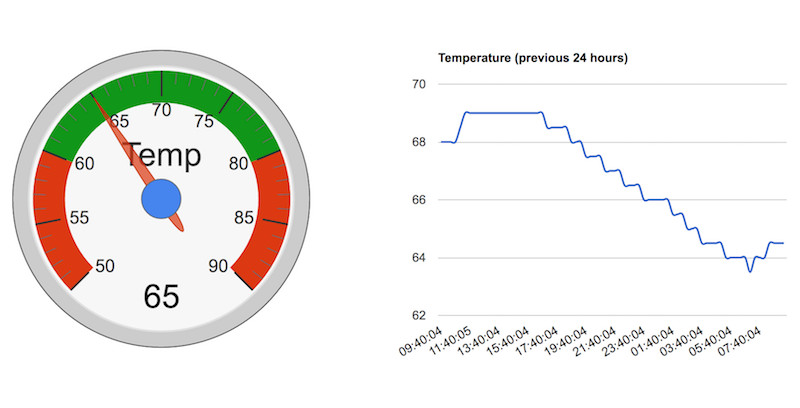
This project documents a IoT temperature monitoring solution that is built on a combination of technologies.
- A Raspberry Pi to record temperatures and to trigger email alerts if temperatures reach certain levels.
- A PHP script that collects temperature readings
- JavaScript that formats the colleted readings and makes them available via a webpage.
The output looks like
This project is based on the Adafruit tutorial at https://learn.adafruit.com/adafruits-raspberry-pi-lesson-11-ds18b20-temperature-sensing/hardware.
The hardware is predominately based on the Raspberry Pi and the DS18B20 temperature sensor. The full breakdown of components that I used is:
- Raspberry Pi 2
- Pi Cobbler Breakout and Cable
- DS18B20 Digital Temperature Sensor
- 4k7 Ohm resistor
- Breadboard
- Jumper Wires
Follow the instructions in the tutorial linked to above to hook up all the components. The good folks at Adafruit did an excellent job describing the layout, so I am not going to reproduce it here.
The client-side software conists of two Python scripts. The first,
sens_temp.py, collects the temperature readings from the sensor, and the
second one, trigger.py, adds it to the log file and pushes it out to a web
server. The script is called via a cronjob that I have set to run every minute.
The server-side software is nothing more than a PHP script. It used Google Charts to generate the visuals. Full details about Charts can be found at https://developers.google.com/chart/.
For the script to work properly, it needs to be able to write to two files:
temp_now.txt, which will contain the latest temperature reading, and
temp_history.csv, which will contain readings of up to the previous 24 hours.
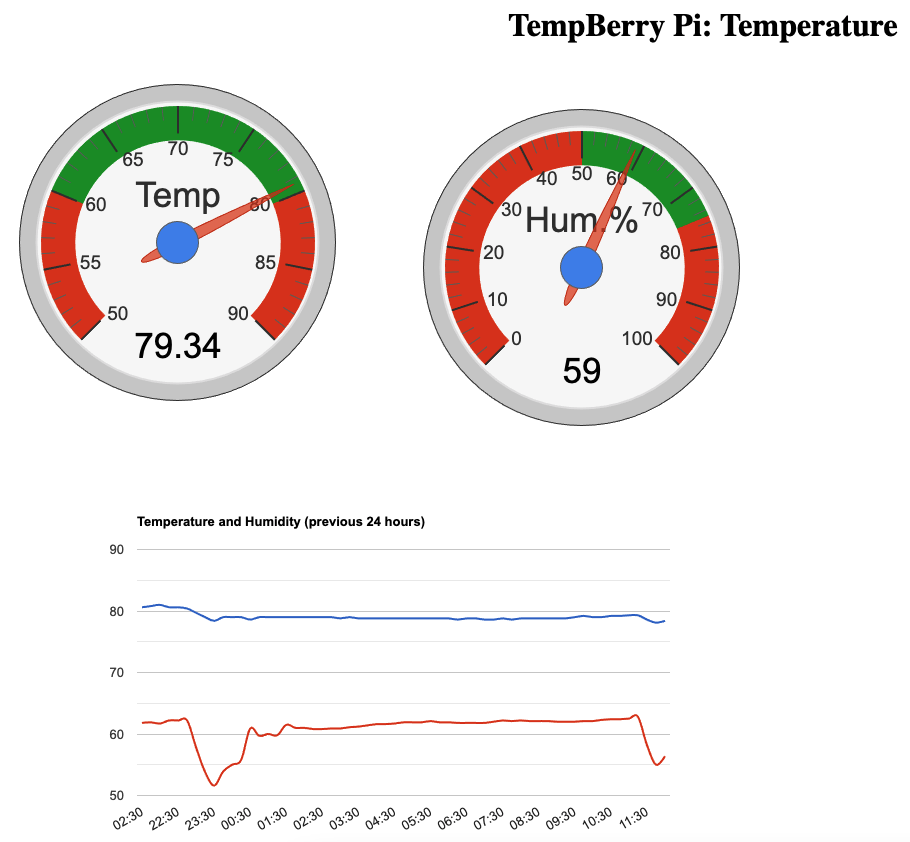
The output looks like
This project is based on the Adafruit tutorial at https://pimylifeup.com/raspberry-pi-humidity-sensor-dht22/.
The hardware is predominately based on the Raspberry Pi and the DS18B20 temperature sensor. The full breakdown of components that I used is:
- Raspberry Pi 2
- Pi Cobbler Breakout and Cable
- DHT22 Digital Temperature and Humidity Sensor
- 4k7 Ohm resistor
- Breadboard
- Jumper Wires
Follow the instructions in the tutorial linked to above to hook up all the components. The good folks at Adafruit did an excellent job describing the layout, so I am not going to reproduce it here.
The client-side software consists of a Python script. The script is called
sens_temp_humidity.py and it collects the readings from the sensor and pushes them out to a web server. The script is called via a cronjob that I have set to run every five minutes.
The server-side software is nothing more than a PHP script. It used Google Charts to generate the visuals. Full details about Charts can be found at https://developers.google.com/chart/.
For the script to work properly, it needs to be able to write to two files: /var/temperature/temp_now.txt, which will contain the latest readings, and /var/temperature/temp_history.csv, which will contain readings of up to the previous 24 hours.

