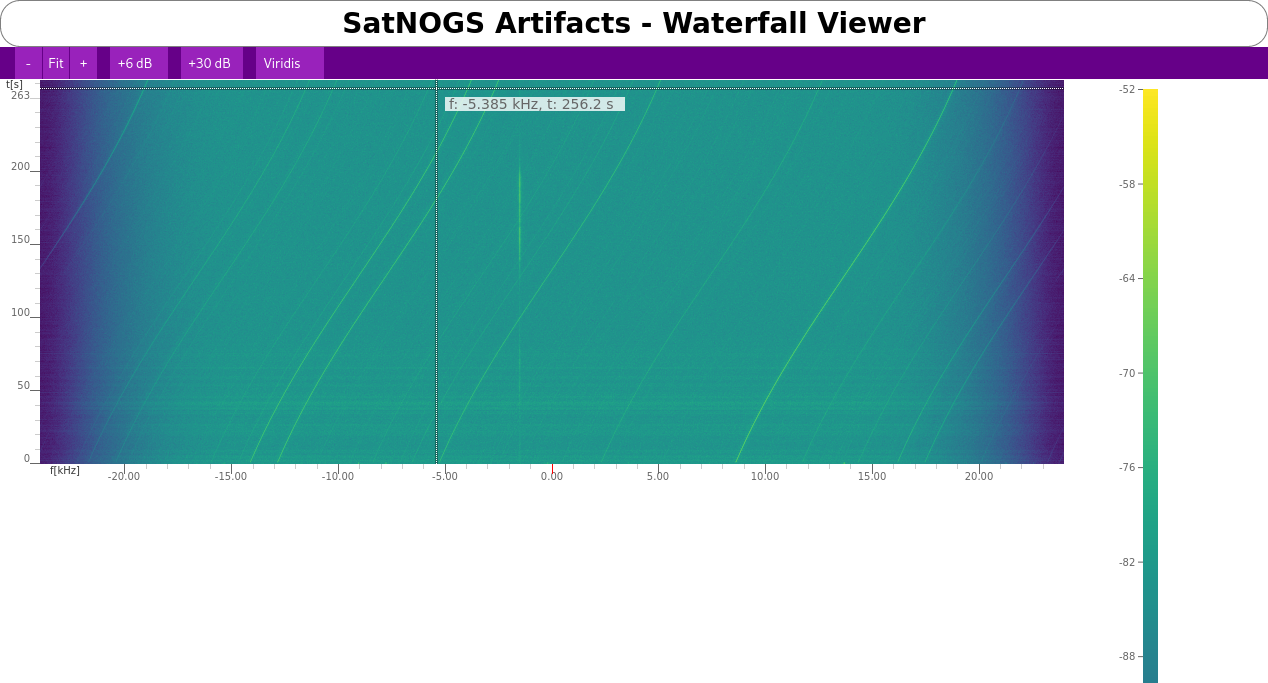
This demo is based on the spectroplot.js example relying on the EasyCloning class for creating the DOM needed by the library. It implements loading of SatNOGS Artifacts (HDF5 files), displaying the contained waterfall file and provides an interface for extracing timestamped frequency measurements from it.
The latest codes is published using GitHub Actions on github-pages at https://kerel-fs.github.io/spectranalysis/example.html.
This section describes how to setup a combined development environment for spectranalysis and spectroplot.js.
-
Checkout spectroplot.js and register the package locally with
yarn link:git clone https://github.com/kerel-fs/spectroplot-js cd spectroplot.js yarn install yarn link -
Then checkout spectranalysis, link to the previously registered package and run a local webserver:
git clone https://github.com/kerel-fs/spectranalysis yarn install yarn link "spectroplot" npx webpack serve -
You can access the page at http://localhost:8080/example.html now.
-
Run the following commands:
git clone https://github.com/kerel-fs/spectranalysis yarn install npx webpack build -
The complete output (html and css assets as well the bundled js) can be found in the
buildfolder now.
-
Open spectranalysis
-
Enter the correct SatNOGS DB API URL:
https://db.satnogs.org/api -
Register at SatNOGS DB, login and copy your SatNOGS DB API Token into spectranalysis
-
Choose the observation you want to analyze, e.g.
4950356for Observation #4950356. -
Press
Load. It might take a few seconds for loading the waterfall data into the browser.
Now you can inspect interactively the waterfall from this observation. Hovering over the waterfall will show the
current relative time and frequency at the given location. Example:

AGPL-3.0-or-later