Command/agent to monitor the status of Minecraft servers
go get github.com/itzg/go-mc-status
Subcommands:
	flags            describe all known top-level flags
	help             describe subcommands and their syntax
	version          Show version and exit

Subcommands for monitoring:
	export-for-prometheus  Registers an HTTP metrics endpoints for Prometheus export
	gather-for-telegraf  Periodically gathers to status of one or more Minecraft servers and sends metrics to telegraf over TCP using Influx line protocol

Subcommands for status:
	status           Retrieves and displays the status of the given Minecraft server
	status-bedrock   Retrieves and displays the status of the given Minecraft Bedrock Dedicated server
To check the status of a Java edition server:
docker run -it --rm itzg/mc-monitor status --host mc.hypixel.net
To check the status of a Bedrock Dedicated server:
docker run -it --rm itzg/mc-monitor status-bedrock --host play.fallentech.io
where exit code will be 0 for success or 1 for failure.
Some Forge servers may cause a string length out of bounds error during status messages due to how the FML2 protocol bundles the entire modlist for client compatibility check. If there are issues with status failing when it otherwise should work, you can try out the experimental --use-mc-utils flag below (enables the mcutils protocol library):
docker run -it --rm itzg/mc-monitor status --use-mc-utils --host play.fallentech.io
The following example is provided in examples/mc-monitor-telegraf
Given the telegraf config file:
[[inputs.socket_listener]]
  service_address = "tcp://:8094"

[[outputs.file]]
  files = ["stdout"]
...and a Docker composition of telegraf and mc-monitor services:
version: '3'

services:
  telegraf:
    image: telegraf:1.13
    volumes:
    - ./telegraf.conf:/etc/telegraf/telegraf.conf:ro
  monitor:
    image: itzg/mc-monitor
    command: gather-for-telegraf
    environment:
      GATHER_INTERVAL: 10s
      GATHER_TELEGRAF_ADDRESS: telegraf:8094
      GATHER_SERVERS: mc.hypixel.net
The output of the telegraf service will show metric entries such as:
minecraft_status,host=mc.hypixel.net,port=25565,status=success response_time=0.172809649,online=51201i,max=90000i 1576971568953660767
minecraft_status,host=mc.hypixel.net,port=25565,status=success response_time=0.239236074,online=51198i,max=90000i 1576971579020125479
minecraft_status,host=mc.hypixel.net,port=25565,status=success response_time=0.225942383,online=51198i,max=90000i 1576971589006821324
When using the export-for-prometheus subcommand, mc-monitor will serve a Prometheus exporter on port 8080, by default, that collects Minecraft server metrics during each scrape of /metrics.
The sub-command accepts the following arguments, which can also be viewed using --help:
  -bedrock-servers host:port
    	one or more host:port addresses of Bedrock servers to monitor, when port is omitted 19132 is used (env EXPORT_BEDROCK_SERVERS)
  -port int
    	HTTP port where Prometheus metrics are exported (env EXPORT_PORT) (default 8080)
  -servers host:port
    	one or more host:port addresses of Java servers to monitor, when port is omitted 25565 is used (env EXPORT_SERVERS)
The following metrics are exported
minecraft_status_healthyminecraft_status_response_time_secondsminecraft_status_players_online_countminecraft_status_players_max_count
with the labels
server_hostserver_portserver_edition:javaorbedrockserver_version
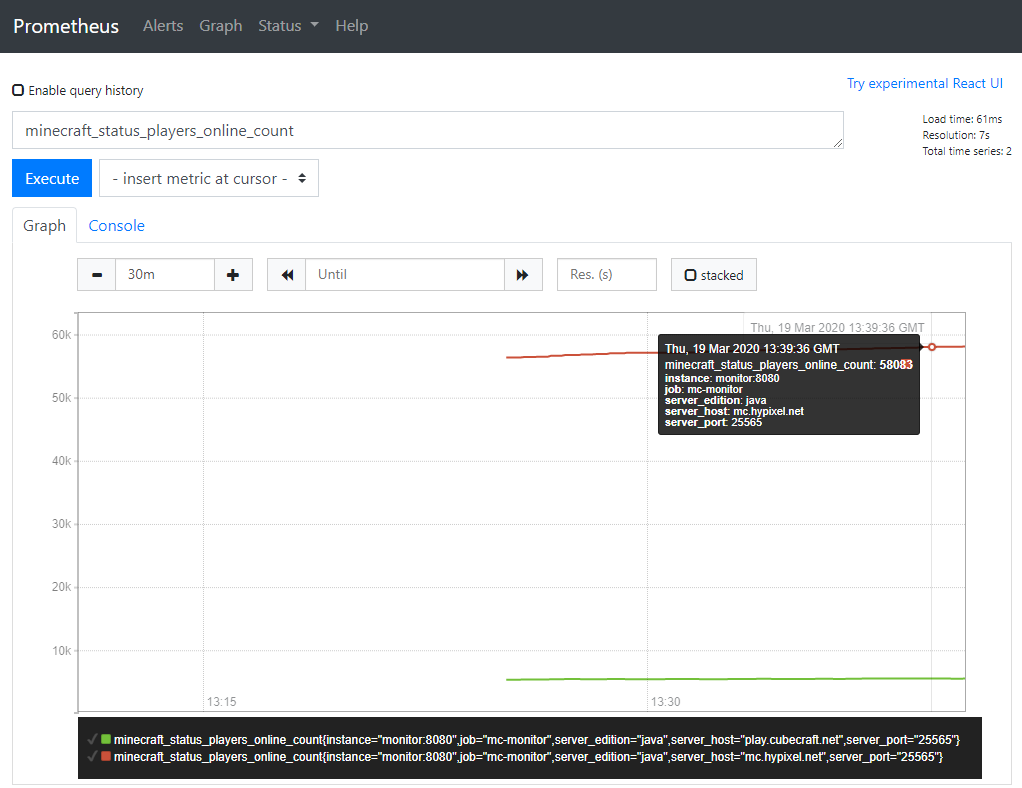
An example Docker composition is provided in examples/mc-monitor-prom, which was used to grab the following screenshot:


