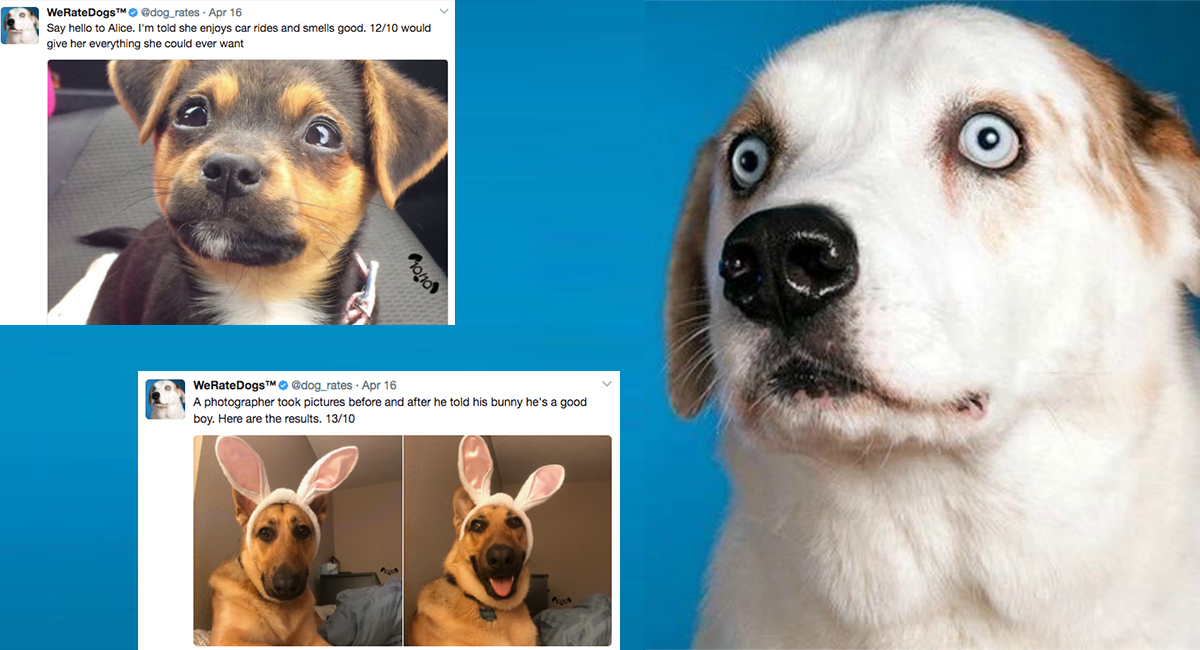
This project was part of the data wrangling section from Udacity Data Analyst Nanodegree program. And it primarily focused on wrangling data from the WeRateDogs Twitter account using Python, documented in a Jupyter Notebook (wrangle_act.ipynb). This Twitter account rates dogs with humorous commentary. The rating denominator is usually 10, however, the numerators are usually greater than 10. This aspect was not cleaned as it is part of the humor and popularity of WeRateDogs.
For this project, we only wanted original ratings (no retweets or replies) that have images. Not all of the original tweets in the dataset are dog ratings and some are retweets.
Fully assessing and cleaning the entire dataset would require exceptional effort so only a subset of its issues (eight quality issues and two tidiness issues at minimum) needed to be assessed and cleaned.
The tasks for this project were:
- Data wrangling, which consisted of:
- Gathering data
- Assessing data
- Cleaning data
- Storing, analyzing, and visualizing the wrangled data
- Reporting on my data analyses and visualizations. (act_report.pdf)
- Documentation for data wrangling steps: gather, assess, and clean. (wrangle_report.pdf)
WeRateDogs provided their Twitter archive (which included tweets through August 1, 2017) of basic tweet data (tweet ID, timestamp, text, etc.) for use with this project. The "enhanced" csv file provided by Udacity (twitter_archive_enhanced.csv) also contains columns which were extracted programatically: the rating numerator, rating denominator, dog's name, and dog stages (doggo, floofer, pupper, and puppo). These columns needed to be assessed and cleaned as the extraction process wasn't perfect.
The provided Twitter archive lacked some useful information: retweet count and favorite count. I used the tweet IDs to query the Twitter API for each tweet's JSON data using Python's Tweepy library and stored each tweet's entire set of JSON data in a file called tweet_json.txt. I then read the txt file line by line into a pandas DataFrame only including the desired variables; retweet count and favorite count.
Udacity also provided a link to image_predictions.tsv which used to download it programatically using the Requests library.
This project was completed by Muhammad Elkfrawy.
Aug 2020.

