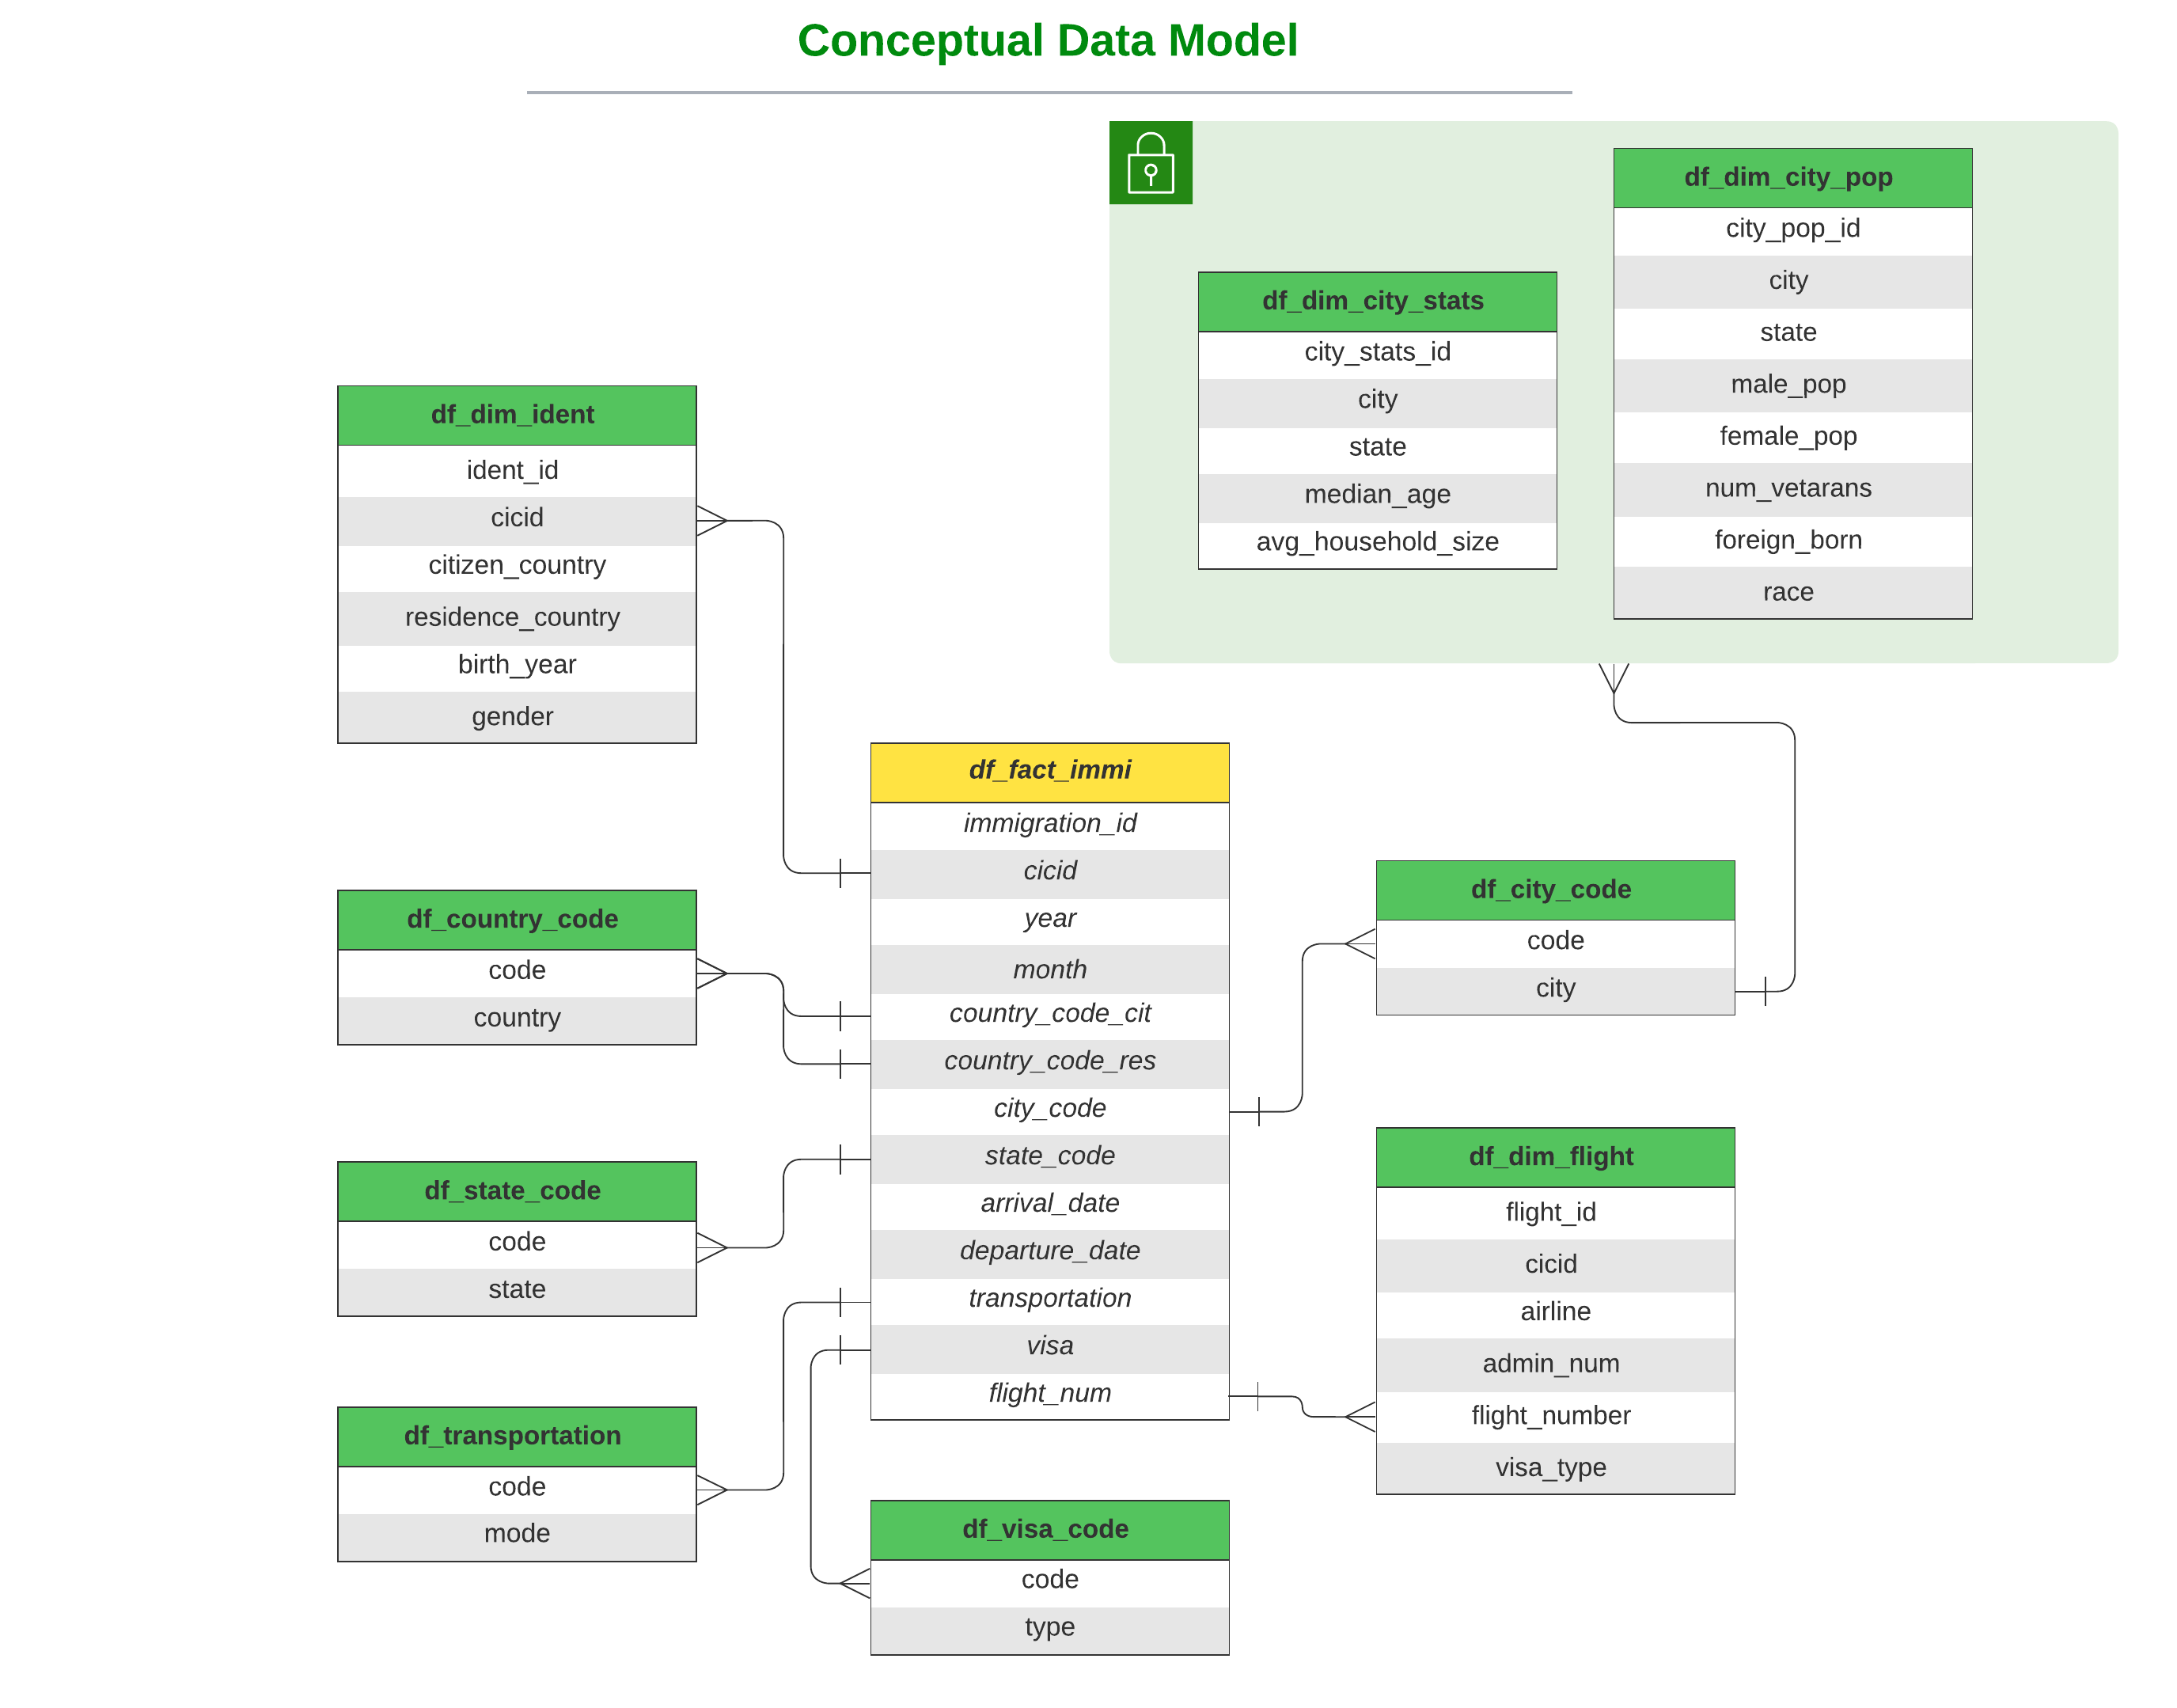
An ETL pipeline for I94 immigration, global land temperatures and US demographics datasets is created to form an analytics database on immigration events. A use case for model is to find patterns of immigration to the United States.
The project follows the follow steps:
- Step 1: Scope the Project and Gather Data
- Step 2: Explore and Assess the Data
- Step 3: Define the Data Model
- Step 4: Run ETL to Model the Data
- Step 5: Complete Project Write Up
- I94 immigration data and US demographic datasets were implemented to setup a data pipeline with fact and dimension tables wherein they are used for analytics.
- I94 Immigration Data: This data comes from the US National Tourism and Trade Office. A data dictionary is included in the workspace. This is where the data comes from. There's a sample file so you can take a look at the data in csv format before reading it all in. You do not have to use the entire dataset, just use what you need to accomplish the goal you set at the beginning of the project.
- World Temperature Data: This dataset came from Kaggle. You can read more about it here.
- U.S. City Demographic Data: This data comes from OpenSoft. You can read more about it here.
- Airport Code Table: This is a simple table of airport codes and corresponding cities. It comes from here.
___
| Data Set | Format |
|---|---|
| I94 Immigration Data | SAS |
| U.S. City Demographic Data | CSV |
- Pandas: exploratory data analysis on small data set
- PySpark: data processing on large data set
- Python: data processing
- AWS S3: data storage
- Pandas and PySpark are used to explore with data analysis to get insights on these data sets.
- Datasets are split and paired into dimensional tables and renamed for better understood columns.
- Utilize PySpark on one of the SAS data sets to test ETL data pipeline logic.
- Transform
arrdate,depdatefrom SAS time format into PySpark DateType. - Parse
Labels_Descriptionfile to get auxiliary dimension tablescountry_code,city _code,state _code,visa_code,transportation. - Tranform
city,stateto upper case to matchcity_codeandstate_codetable
This project implements the schema shown below as a data model to use it for the purpose of analytics and BI dashboards.
Data Pipeline Steps:
- Assume our datasets reside in an S3 bucket
- [Source_S3_Bucket]/18-83510-I94-Data-2016/*.sas7bdat
- [Source_S3_Bucket]/I94_SAS_Labels_Descriptions.SAS
- [Source_S3_Bucket]/us-cities-demographics.csv
- Perform some data perparations and clean-ups on our datasets.
- Transform I94_Immigration dataset into a fact table - partitioned by
state- and 2 dimension tables. - Parsing label description file to get auxiliary descriptive tables
- Transform US City Demographics dataset into 2 dimension tables
- Populate analytics tables and store in destination S3 bucket
- Data schema of every dimensional table matches data model.
- No empty table after running ETL data pipeline.
Refer to data_dictionary.md
Refer to model_data_dictionary.md
- AWS S3 for data storage
- Pandas for sample data set exploratory data analysis
- PySpark for large data set data processing to transform staging table to dimensional table
- Pipeline will be scheduled monthly as immigration data is the primary datasource is on a monthly schedule
Write a description of how you would approach the problem differently under the following scenarios:
- Spark can handle the increase. if the standanlone mode cannot, AWS EMR is preferabele to make use of multiple nodes adding to the computing power through distributed systems.
- Apache Airflow will be used to schedule and run data pipelines.
- We shall move our analytics database into Amazon Redshift as it can handle up to 500 concurrent connections per cluster.
