Author: Jennifer Hoang
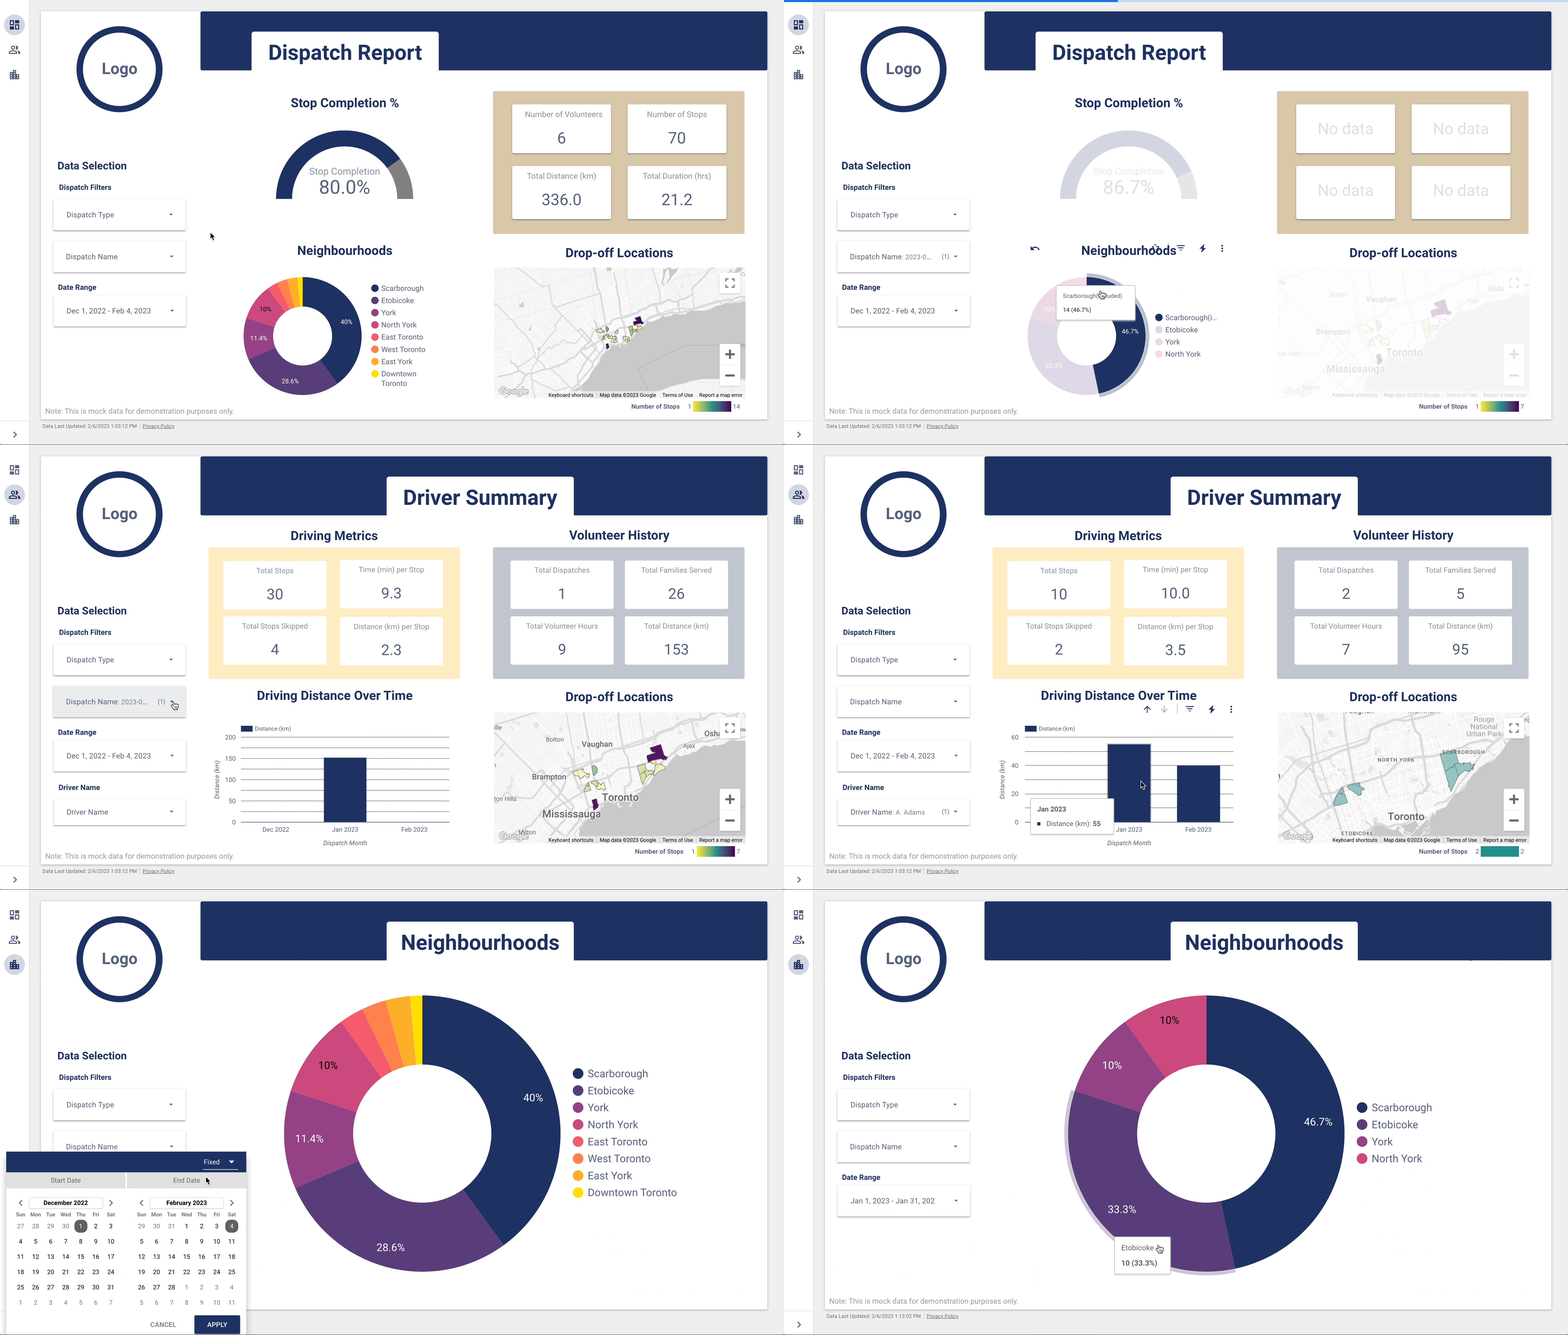
This data visualization project was created to monitor the success of volunteer driver dispatches and volunteer engagement for a non-profit organization through a dashboard built in Looker Studio. This repository describes the dashboard and contains the data cleaning and import scripts used to create and update the dashboard.
The non-profit organization organizes the delivery of food boxes to support families facing food insecurity in the community, which are delivered by volunteer drivers approximately every 2-4 weeks.
The purpose of this dashboard was to allow data and reports to be more readily accessible to executive team members. The previous version of this dashboard was difficult to run for non-technical users and required sensitive data to be downloaded locally. With the updated Looker dashboard, the reports can easily be referenced by technical and non-technical team members with access, while sensitive personal data can be more safely stored and managed in the cloud on BigQuery.
The dashboard consists of 3 main tabs:
-
Dispatch Report
- This tab provides the user with an overall summary of the selected Dispatch, including key success metrics such as the Stop Completion Percentage, as well as information about the neighbourhoods where food boxes were distributed and volunteers involved. The user can filter dispatches by Type, Name, or Date, and choose to summarize data from a single dispatch or multiple dispatches of interest.
-
Driver Summary
- This tab allows users to explore volunteer driver history and engagement. Users can summarize data from a single user or multiple users. Users can also filter for volunteers who were recently active using the Date Range filter. This tab is intended to support volunteer engagement and segmentation strategies that are currently being explored by the Data and Volunteer teams.
-
Neighbourhoods
- This tab highlights the neighbourhoods where the organization has distributed food boxes for reporting purposes.
HUT-dashboard was created by Jennifer Hoang. It is licensed under the terms of the MIT License.
