This repository contains the code that combines object detection(YOLO), time-series predictions (LSTM) and anomaly detection to capture the cars and pedestrian movement patterns across the City of Calgary in real-time. It also uses the historical movement data to make a prediction about the volume of the traffic in the next 24 hours.
Here is an screen shot of the application UI:

Traffic congestion primarily occurs due to unknown factors such as bad weather conditions, unexpected vehicular failure or a road accident. So, a continuous evaluation of the road traffic needs to be done to determine the congestion free paths. Unlike traditional approaches for determining traffic flow (e.g., hose counts and manual counts) and conventional sensors used in road traffic monitoring (e.g., auto scope and loop detectors), cameras provide the best technology to acquire the data in real- time due to their higher sensing range. Cities usually shares their traffic data with the public so that citizens can be informed of what is happening in their city. Such information also helps officials make smart traffic management decisions, such as when to implement (1) traffic-calming measures, (2) walking and cycling improvements, (3) traffic and parking regulations, and (4) bus stop locations.
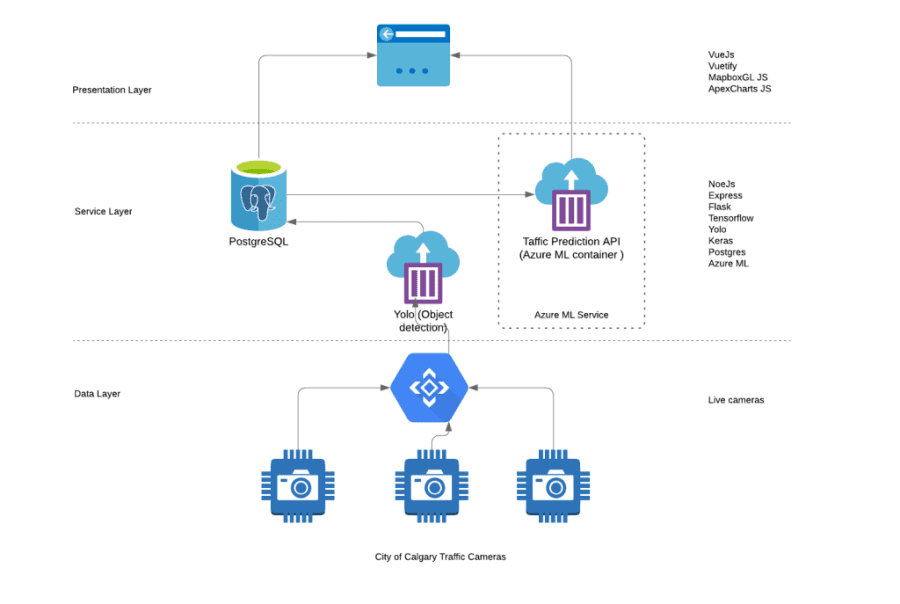
Traffic Watch is built using free and open source software, open standards, and open data - YOLO, TensorFlow 2.0, NodeJS and Express, VueJS, Vuetify, and Mapbox GL JS are used to create the system components. It collects camera images from the City of Calgary’s open data website every 5 minutes, analyzes them using a machine learning models built by YOLO and TensorFlow 2.0, and displays results on a map. Figure below shows Traffic Watch's overall architecture.
The Application can also use the historical detection data to create a cloud of the movement patterns and identify the anomalies in the movement data. It can help detect dangerous driving patterns or unusual pedestrian crossing locations in the streets.
Here is an example of vehicle movement pattern for a specific location:

Here is an example showing the pedestrian movement pattern while crossing the same intersection:

Here is an example showing the predicted traffic flow volume for the same location.
