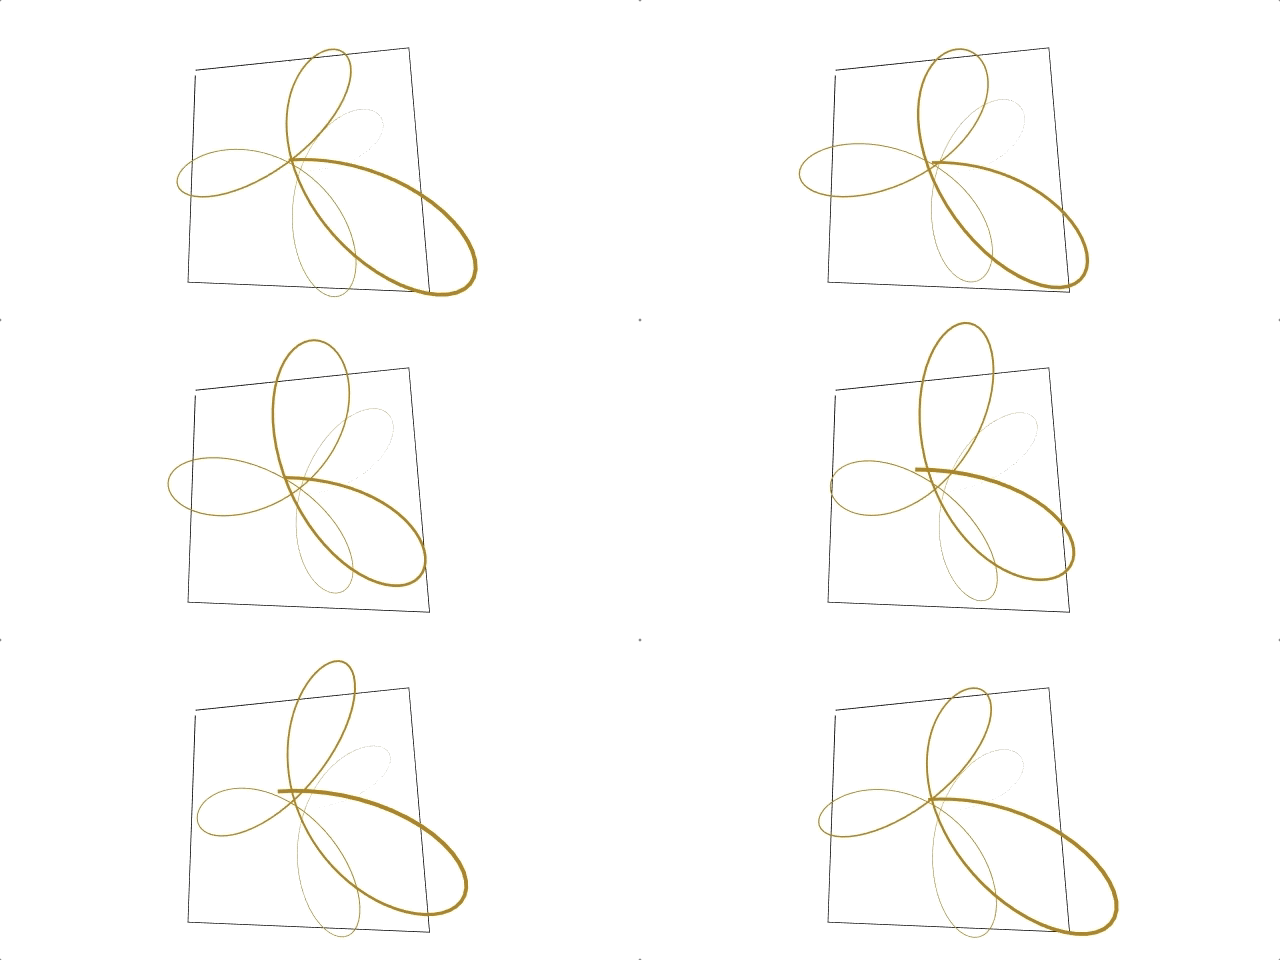
A regl function to conveniently draw flat 2D and 3D lines.
Click here to see ☝️ in action!
This small library is inspired by Regl's line example and Matt Deslauriers' wonderful blog post on drawing lines in WebGL.
npm -i regl-line
import createRegl from 'regl';
import createCamera from 'canvas-orbit-camera';
import createLine from 'regl-line';

// Setup the canvas
const canvas = document.getElementById('canvas');
const { width, height } = canvas.getBoundingClientRect();
canvas.width = width * resize.scale;
canvas.height = height * resize.scale;

// Setup Regl
const regl = createRegl(canvas);
const camera = createCamera(canvas);

// Create a line
const line = createLine(regl, {
  width: 2,
  color: [0.8, 0.2, 0.0, 1.0],
  is2d: true,
  // Flat list of normalized-device coordinates
  points: [-0.9, +0.9, +0.9, +0.9, +0.9, -0.9, -0.9, -0.9, -0.9, +0.85],
});

// Draw
regl.frame(() => {
  regl.clear({ color: [0, 0, 0, 1], depth: 1 });
  camera.tick();
  line.draw({ view: camera.view() });
});
For a complete example, see example/index.js.
To draw multiple lines, you can pass a list of lists of flat point coordinates to setPoints() or the constructor.
line.setPoints([
  [-0.8, +0.9, +0.8, +0.9], // top line
  [+0.9, +0.8, +0.9, -0.8], // right line
  [+0.8, -0.9, -0.8, -0.9], // bottom line
  [-0.9, -0.8, -0.9, +0.8], // left line
]);To give each line an individual color, you have to do 2 things. First, you have to specify all the colors you plan to use.
line.setStyle({
  color: [
    [0, 1, 1, 1], // cyan
    [1, 1, 0, 1], // yellow
  ],
});
Next, when you set the points (with setPoints()), specify an array of indices to associate lines with your previously specified colors.
line.setPoints(points, {
  colorIndices: [
    0, //    top line will be cyan
    1, //  right line will be yellow
    0, // bottom line will be cyan
    1, //   left line will be yellow
  ],
});You could even go one step further and specify the color for each point on the line using a list of list of indices.
line.setPoints(points, {
  colorIndices: [
    [0, 0, 1, 1], //    top line will have a cyan to yellow gradient
    [1, 1, 0, 0], //  right line will have a yellow to cyan gradient
    [0, 1, 0, 1], // bottom line will have a cyan, yellow, cyan, yellow gradient
    [0, 1, 1, 0], //   left line will have a cyan, yellow, cyan gradient
  ],
});To adjust, you can adjust the line width using
line.setPoints(points, {
  opacities: [
    0.25, //    top line will have an opacity of 0.25
    0.5, //  right line will have an opacity of 0.5
    0.75, // bottom line will have an opacity of 0.75
    1.0, //   left line will have an opacity of 1.0
  ],
});
Similar to color gradient, you can also specify the opacity for each point on the line using a list of list of numbers.
To adjust, you can adjust the line width using
line.setPoints(points, {
  widths: [
    1, //    top line will have a width of 1
    2, //  right line will have a width of 2
    3, // bottom line will have a width of 3
    4, //   left line will have a width of 4
  ],
});
Similar to color gradient, you can also specify the width for each point on the line using a list of list of numbers.
# createLine(regl, options = {})
Create a line instance.
Args:
regl[regl]: Regl instance to be used for drawing the line.options[object]: An object with the following props to customize the line creator.projection[mat4]: projection matrix (Defaut: identity matrix)model[mat4]: model matrix (Defaut: identity matrix)view[mat4]: view matrix (Defaut: identity matrix)points[array]: flat list of normalized-device coordinates alternating x,y ifis2distrueor x,y,z. (Defaut:[]). To draw multiple lines at once, pass in a list of lists of coordinates.widths[array]: flat array of point-wise widths, i.e., the line width at every point. (Defaut:[])color[array]: a quadruple of floats (RGBA) ranging in [0,1] defining the color of the line. (Defaut:[0.8, 0.5, 0, 1])width[number]: uniform line width scalar. This number sets the base line width. (Defaut:1)miter[boolean]: iftrueline segments are miter joined. (Defaut:true)is2d[boolean]: iftruepoints are expected to have only x,y coordinates otherwise x,y,z coordinates are expected. (Defaut:false)zPos2d[number]: ifis2distruethis value defines the uniform z coordinate. (Defaut:0)
Returns: line instance.
# line.clear()
Clears all of the data to remove the drawn line.
# line.destroy()
Destroys all related objects to free memory.
# line.draw({ projection, model, view })
Draws the line according to the projection, model, and view matrices.
Args:
1 options [object]:
projection[mat4]: projection matrix (Defaut: identity matrix)model[mat4]: model matrix (Defaut: identity matrix)view[mat4]: view matrix (Defaut: identity matrix)
# line.getBuffer()
Get a reference to the point, width, and color index buffer objects. This can be useful for efficient animations.
Returns: { points, widths, colorIndices }
# line.getData()
Get a reference to the buffers' typed data arrays.
Returns: { points, widths, colorIndices }
# line.getPoints()
Get the original list of points defining the line.
Return: flat array of points
# line.getStyle()
Get all the style settings.
Returns: { color, miter, width }
# line.setPoints(points, widths, is2d)
Set points defining the line, the point-wise widths, and change the dimensionality.
Args:
points[array]: flat list of normalized-device coordinates alternating x,y ifis2distrueor x,y,z. To draw multiple lines at once, pass in a list of lists of coordinates.widths[array]: flat array of point-wise widths, i.e., the line width at every point.is2d[boolean]: iftruepoints are expected to have only x,y coordinates otherwise x,y,z coordinates are expected.
# line.setStyle({ color, miter, width })
Args:
option[object]:color[array]: a quadruple of floats (RGBA) ranging in [0,1] defining the color of the line.width[number]: uniform line width scalar. This number sets the base line width.miter[boolean]: iftrueline segments are miter joined.


