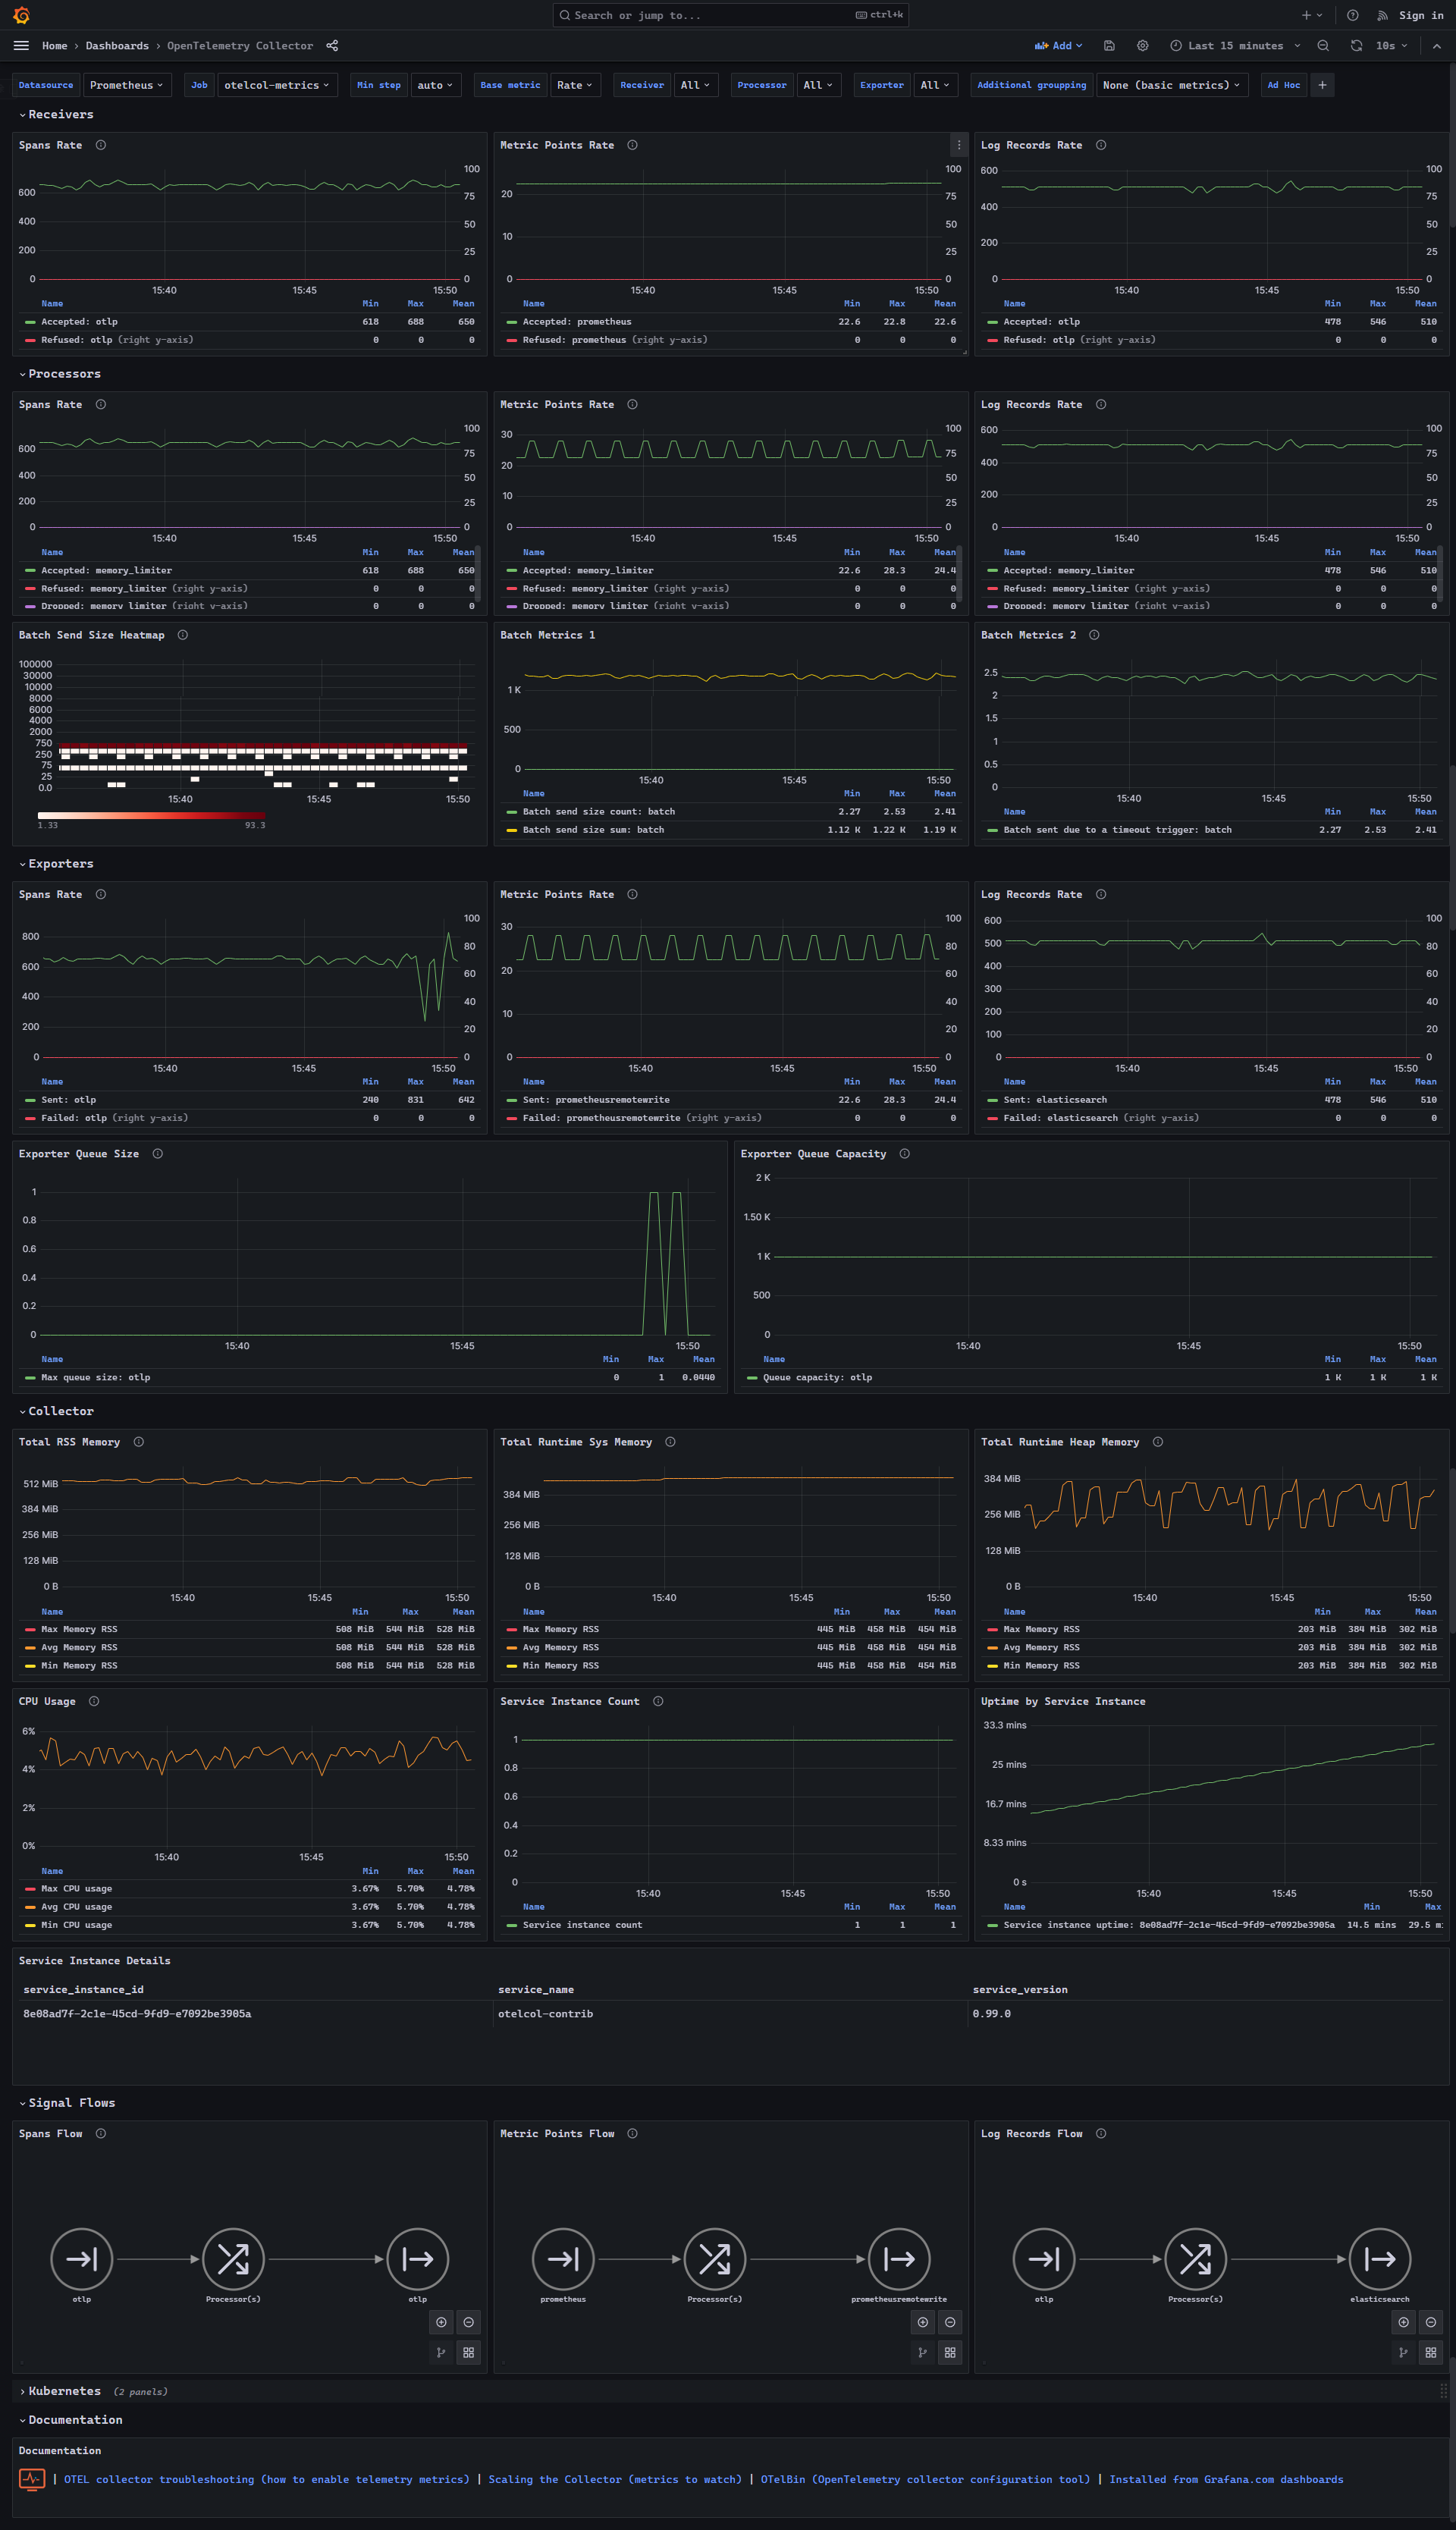
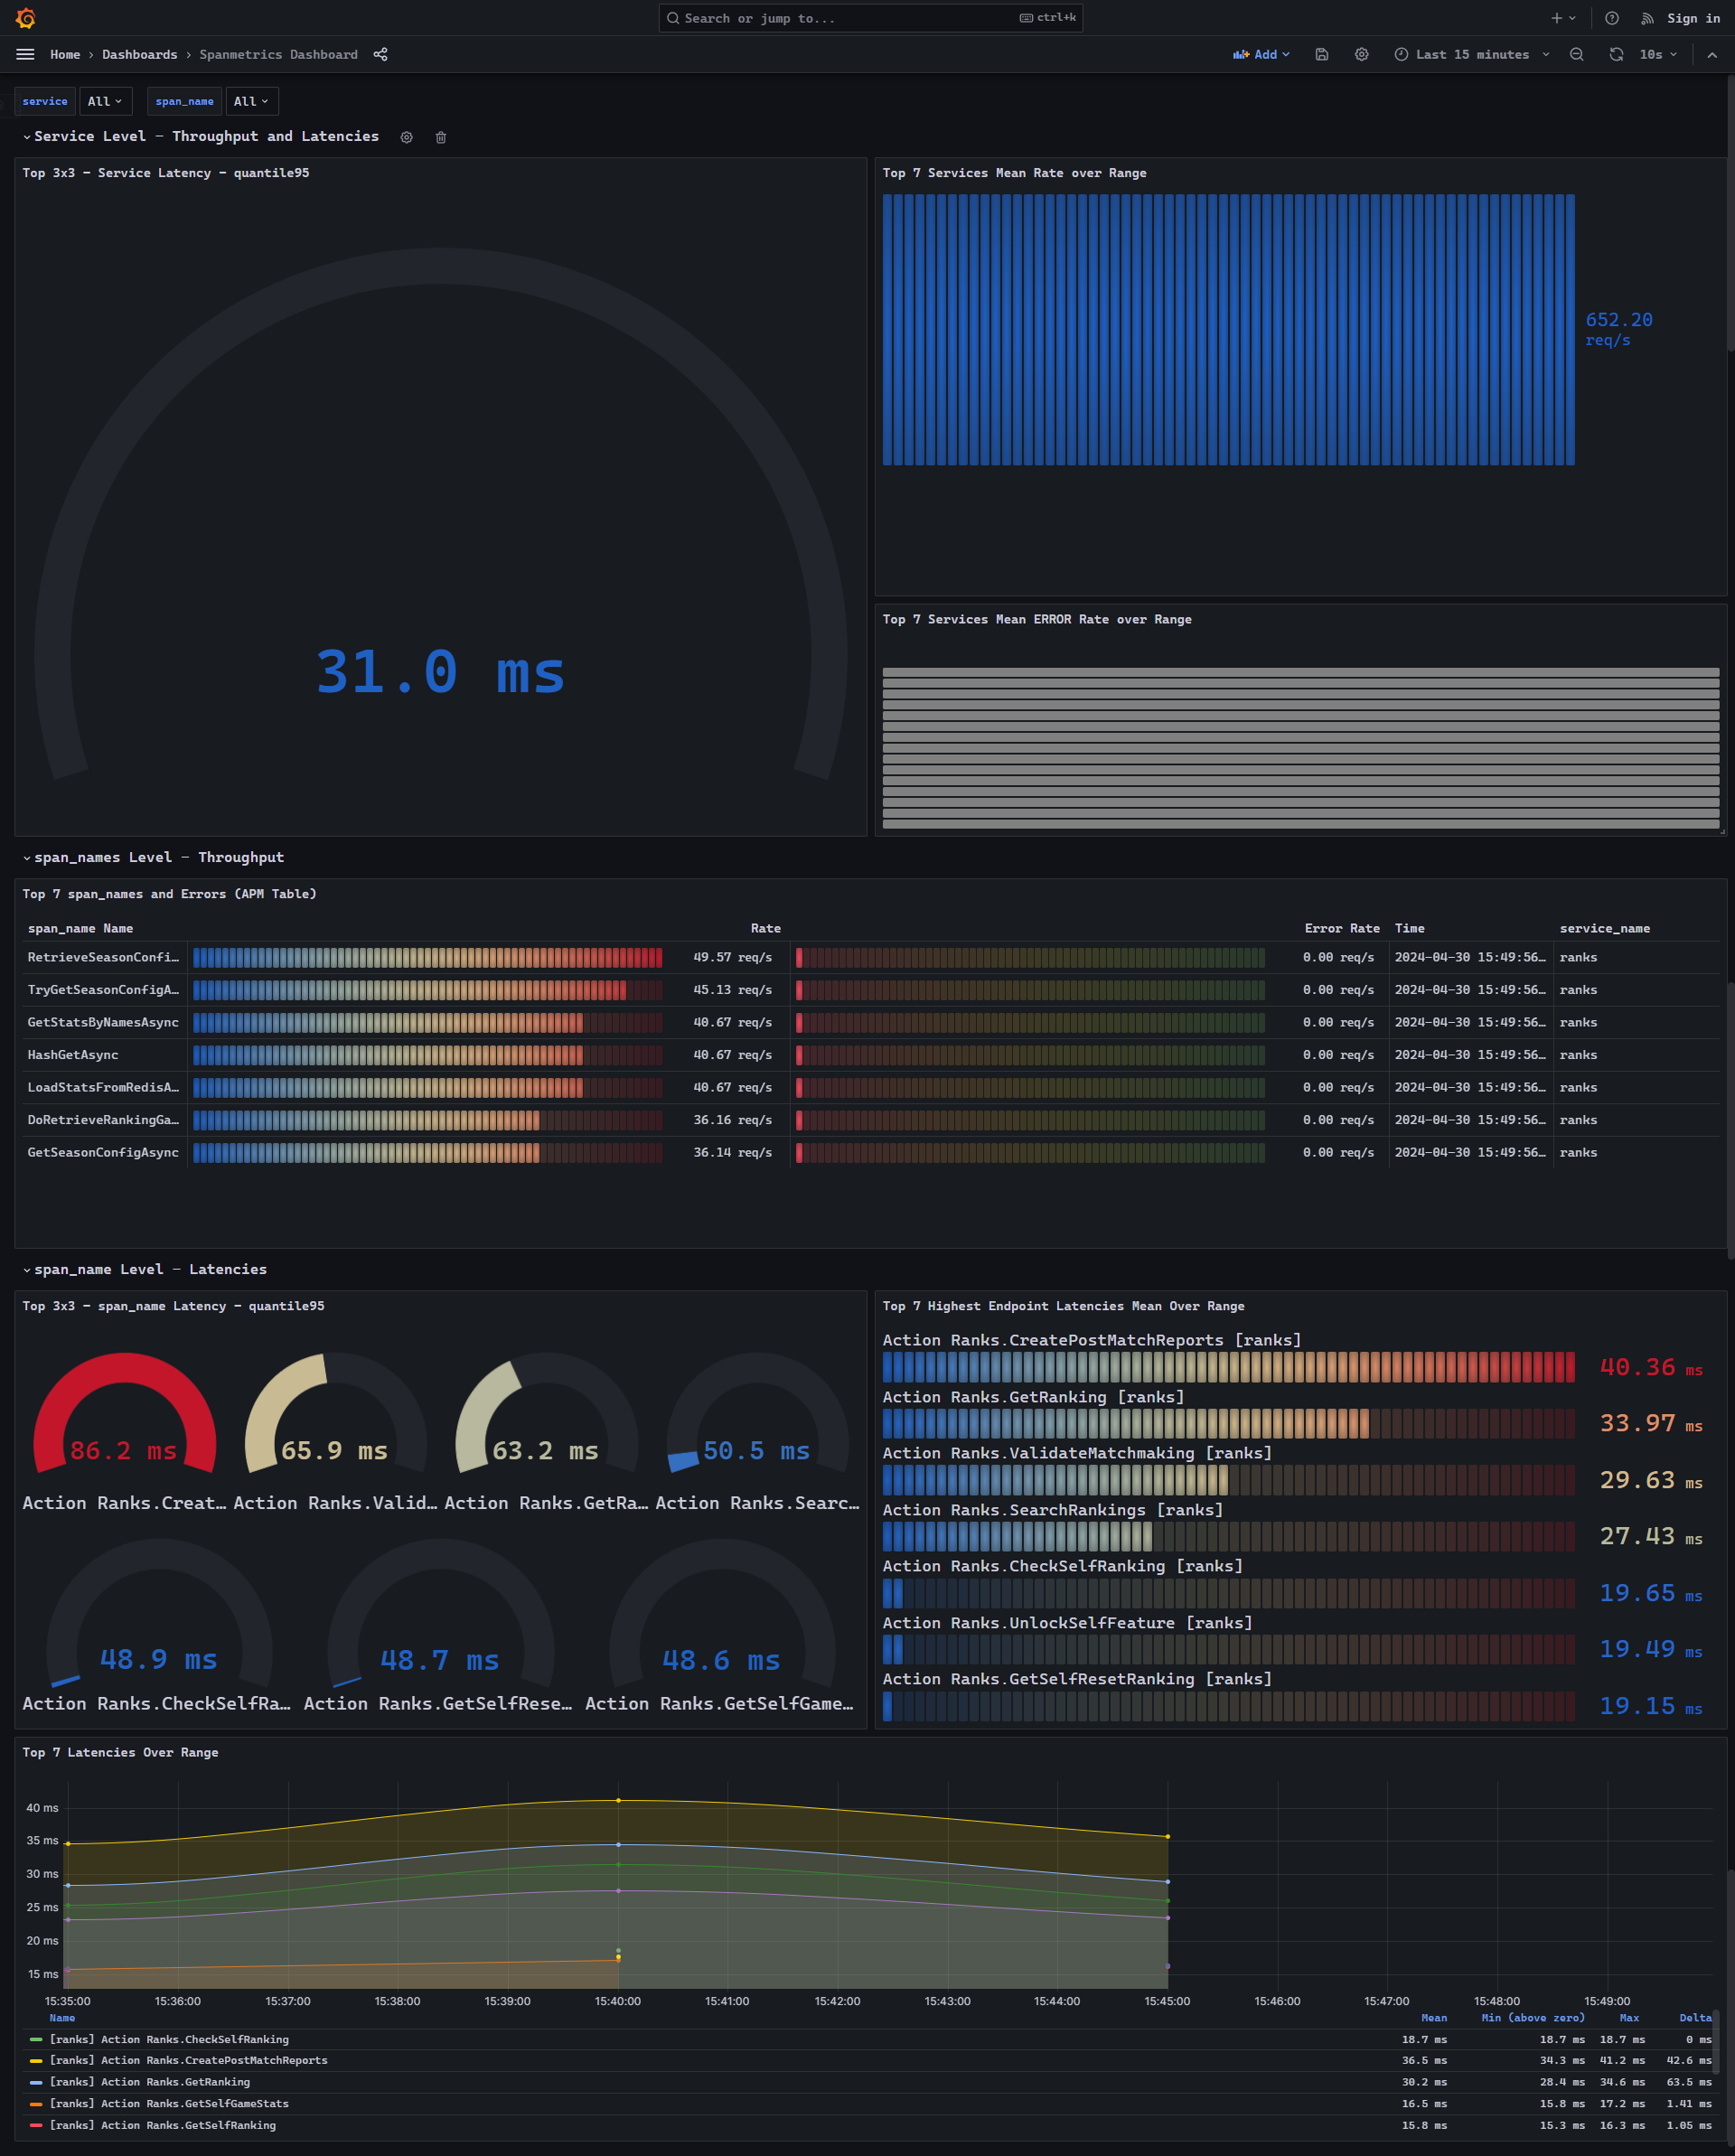
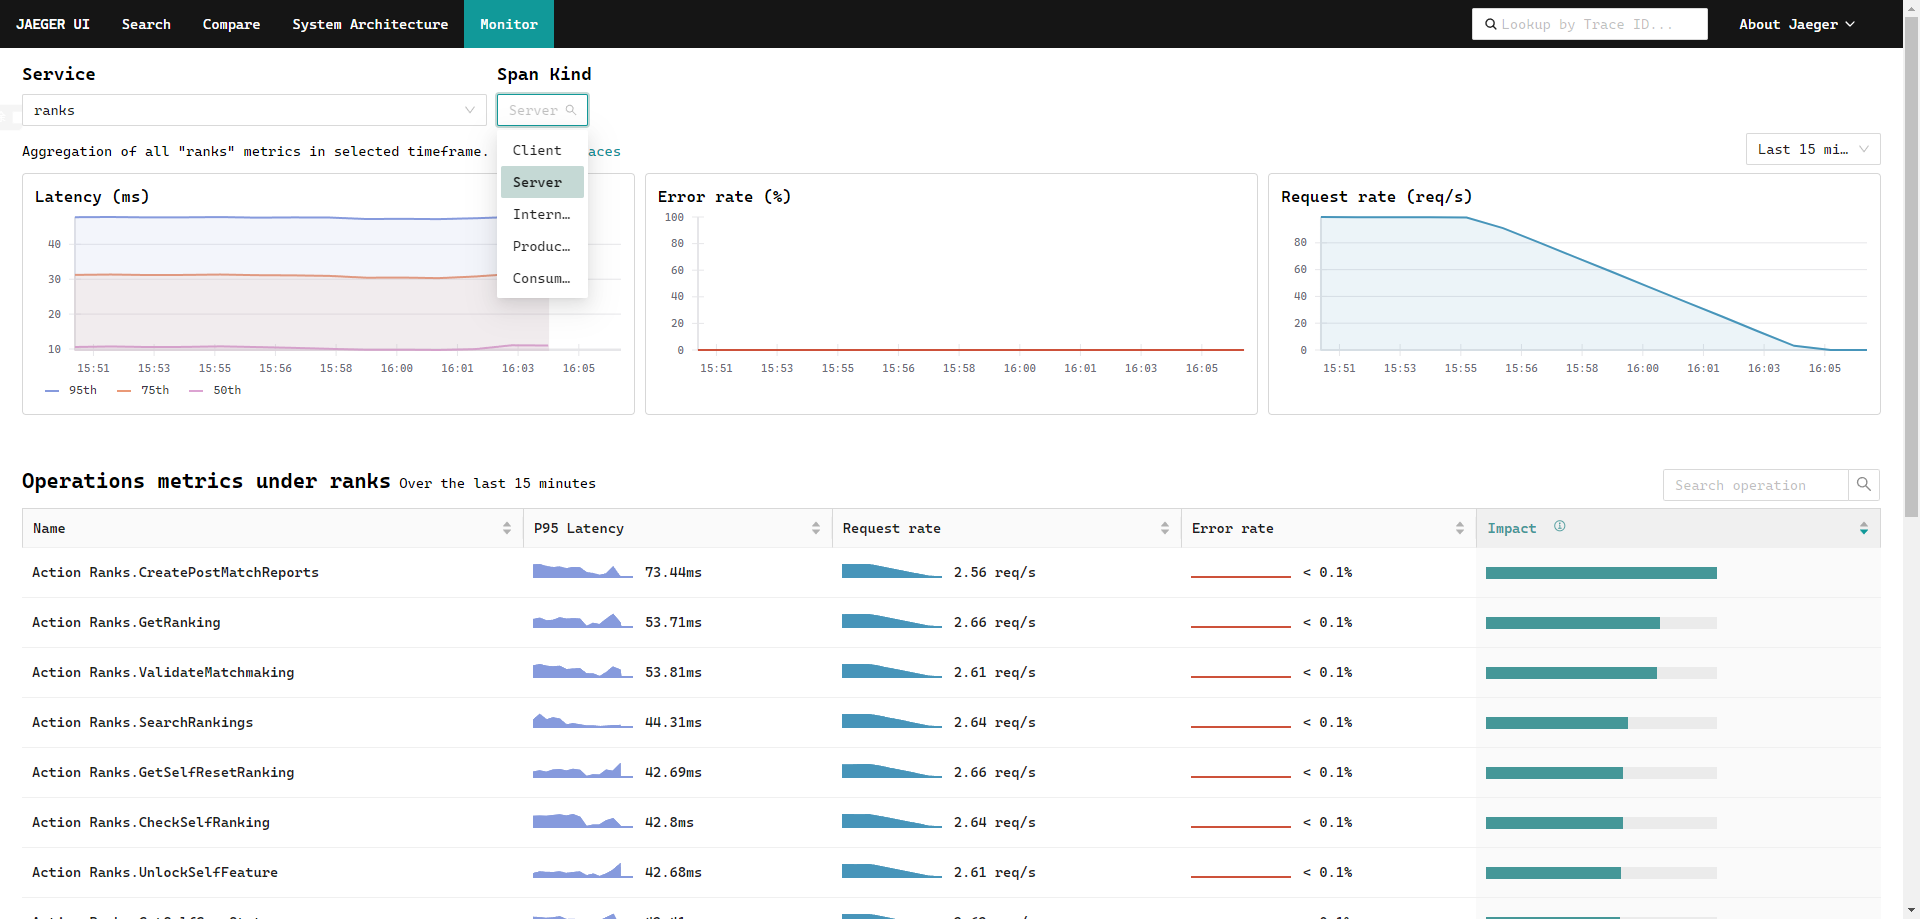
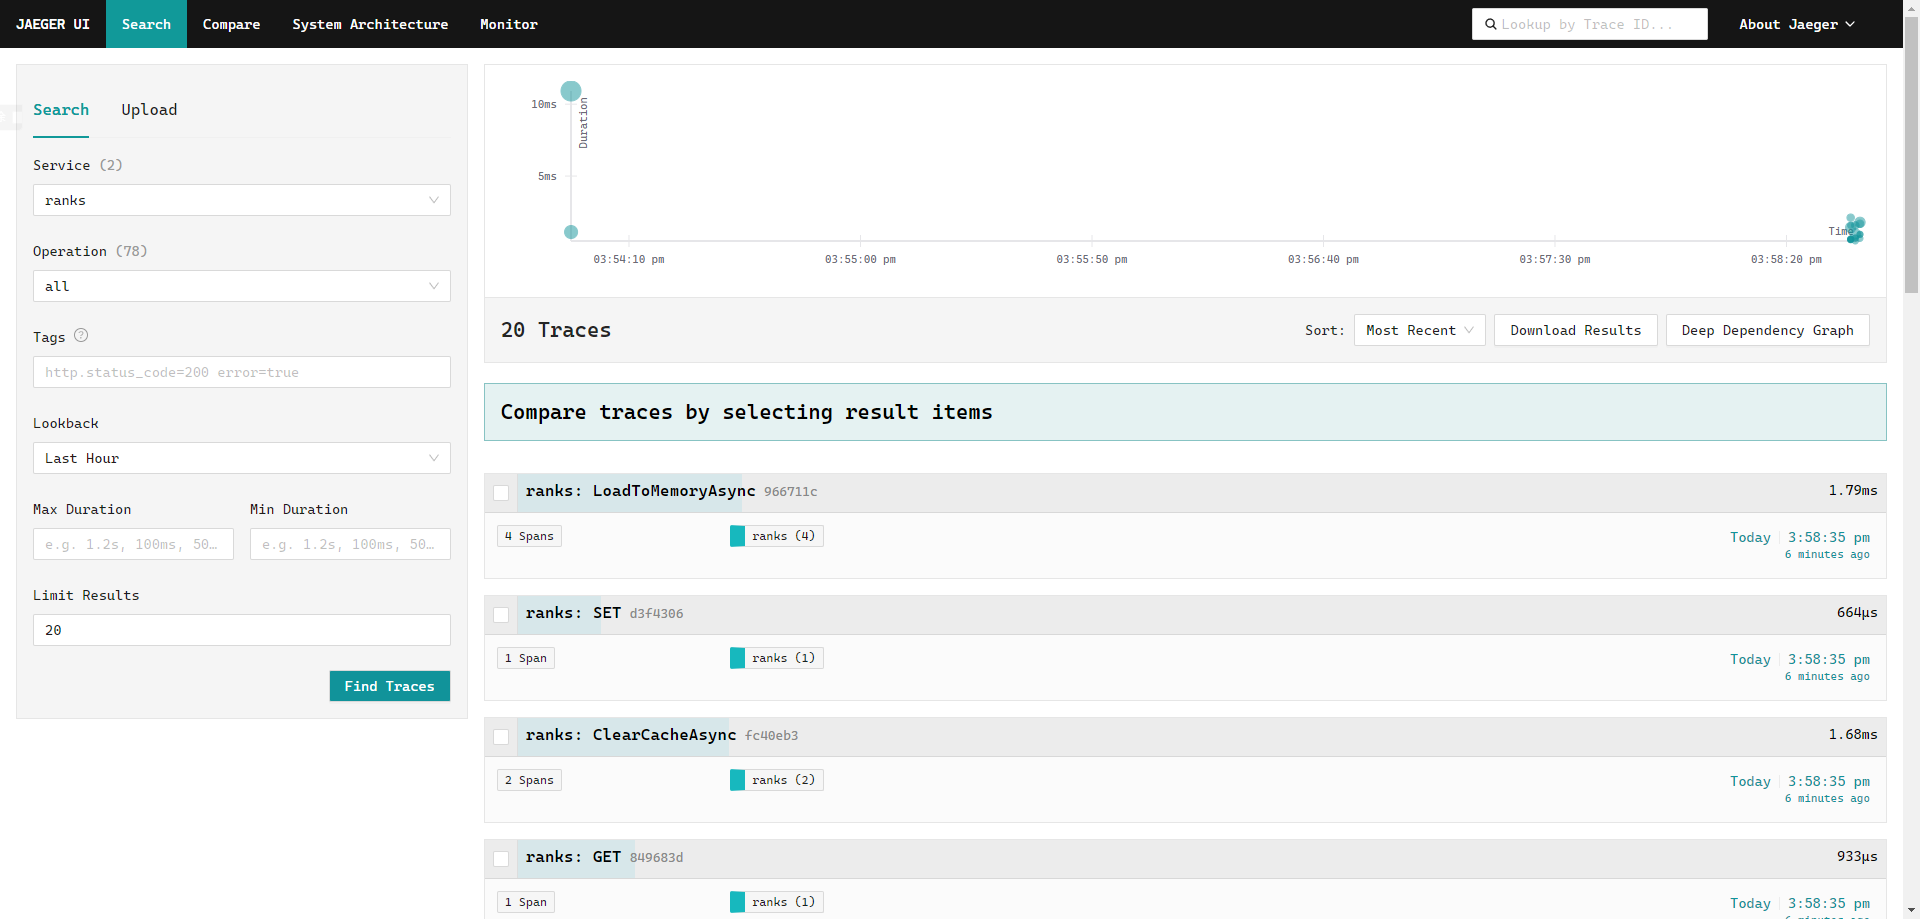
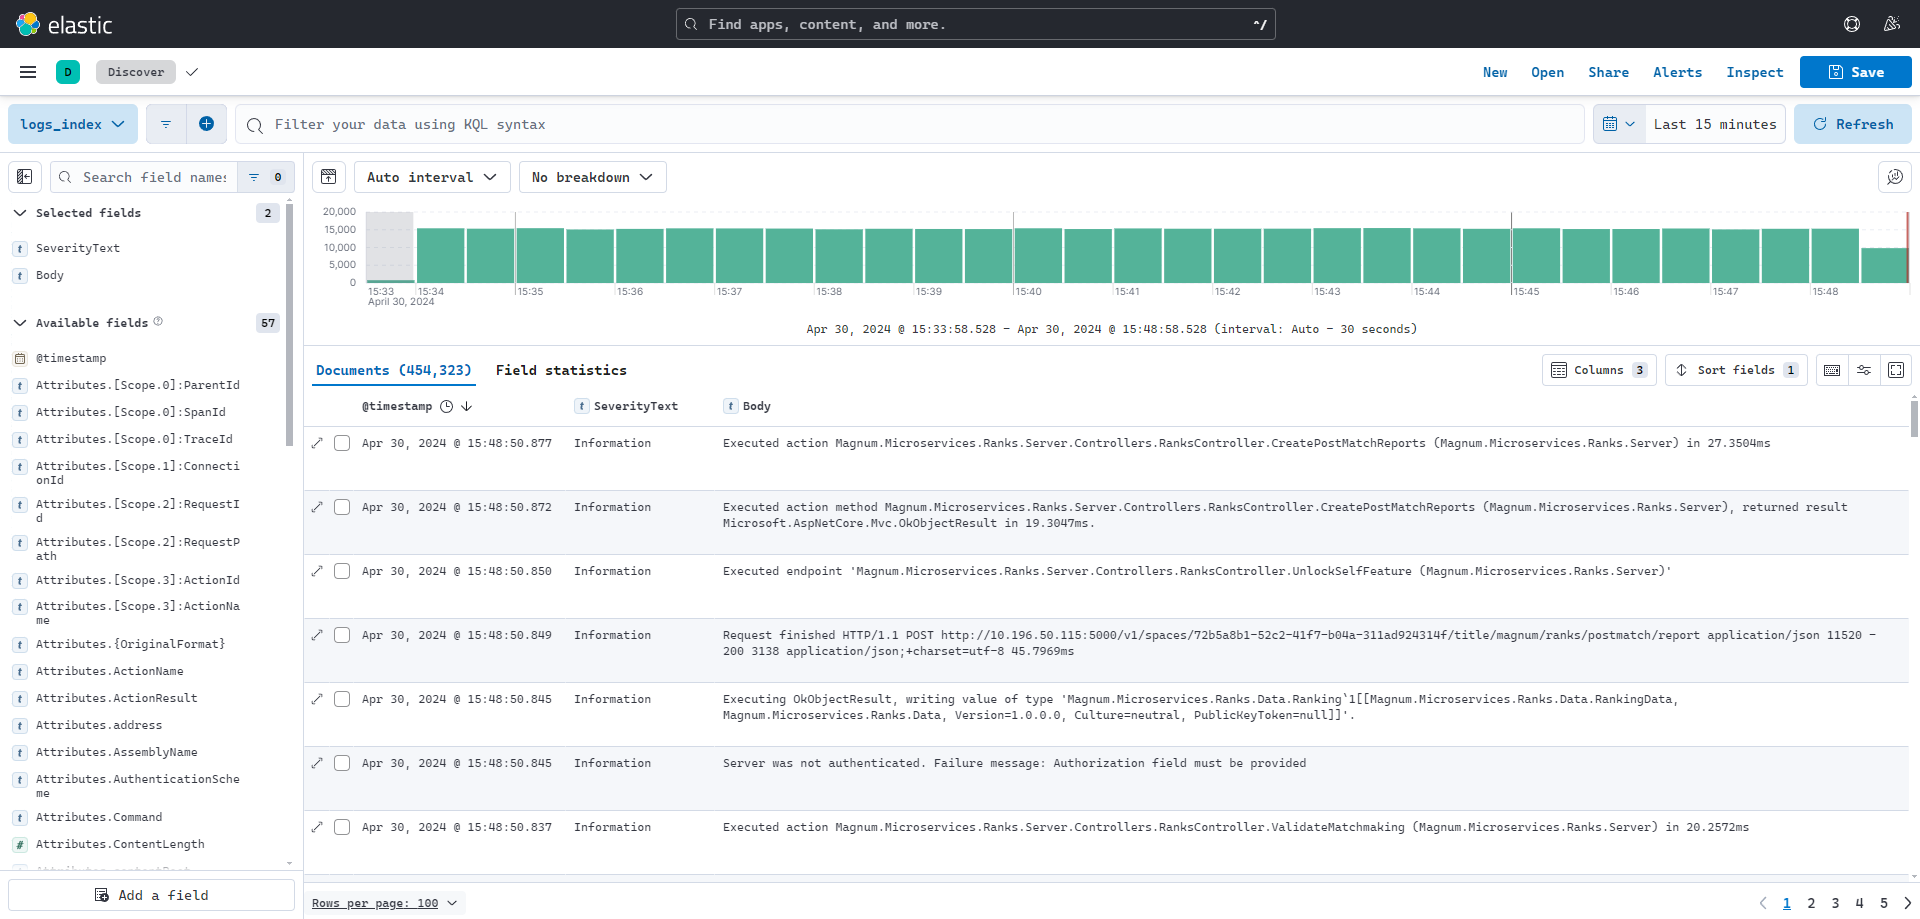
Build a monitoring cluster for debugging purposes based on OpenTelemetry. The cluster provides Grafana, Jeager, and Kibana.
-
Change the value of
CLUSTER_IPin file.envto the external IP of the computer where the docker will run.This is useful if docker is running inside WSL and you want to access it from Windows, change the
CLUSTER_IPto the IP of WSL. -
Start docker
# Set up the Prometheus metrics scrape target
# Prometheus will access the URL http://10.196.50.115:5000/metrics to retrieve metrics data
export PROMETHEUS_SCRAPE_TARGETS='["10.196.50.115:5000"]'

# Start cluster
docker compose up -d

# See logs
docker compose logs -f
-
(Optional) Stop docker and cleanup
# Shutdown cluster
docker compose down
The following ports can be modified in the file
.env.
| Port | Description | Example |
|---|---|---|
| 9090 | Prometheus UI | http://localhost:9090 |
| 16686 | Jaeger Query UI | http://localhost:16686 |
| 3000 | Grafana UI | http://localhost:3000 |
| 9200 | Elasticsearch | http://localhost:9200 |
| 5601 | Kibana | http://localhost:5601 |
| 4317 | OTLP gRPC receiver | http://localhost:4317 |
| 4318 | OTLP http receiver | http://localhost:4318 |
| 55679 | zpages for opentelemetry collector | http://localhost:55679/debug/servicez, http://localhost:55679/debug/tracez |
