A simple python script two draw on your contribution graph. Checkout the real example here and here.
This is an example to prove that people shouldn't overrated a person by his/her contribution graph.
git and python3 and an input file (see Input file format).
git clone https://github.com/kienvo/graph-drawermain.py -i example.txt -d 2004-06-07T00:00:00+00:00Or you may want to run in another working tree:
main.py -i example.txt -d 2004-06-07T00:00:00+00:00 --git-dir=../path/to/.gitMore explainations:
$ python3 main.py -h
usage: graph-drawer [-h] [-i INPUT_FILE] [-d START_DATE]

options:
  -h, --help            show this help message and exit
  -i INPUT_FILE, --input-file INPUT_FILE
                        path to the input file.
  -d START_DATE, --start-date START_DATE
                        date to start drawing in iso 8601 format e.g., 2014-01-07T02:00:00+70:00
You may want to choose START_DATE on Monday if the year is before 2010(*) or on Sunday if the year is after. Github shift a day if the year is before 2010 for unknown reason.
(*) I don't remember exactly =]].
git push origin your-default-branchYou may want to use the --force if the branch head was modified.
Make sure the commits in your branch is set as default in repo setting, otherwise nothing will display on your graph.
Voilà:
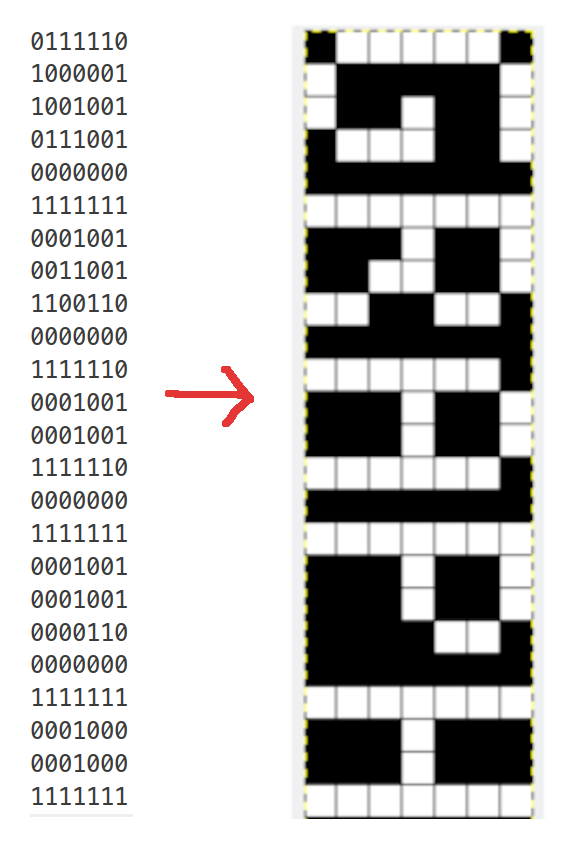
Look at example.txt and rotate it +90 degree:


