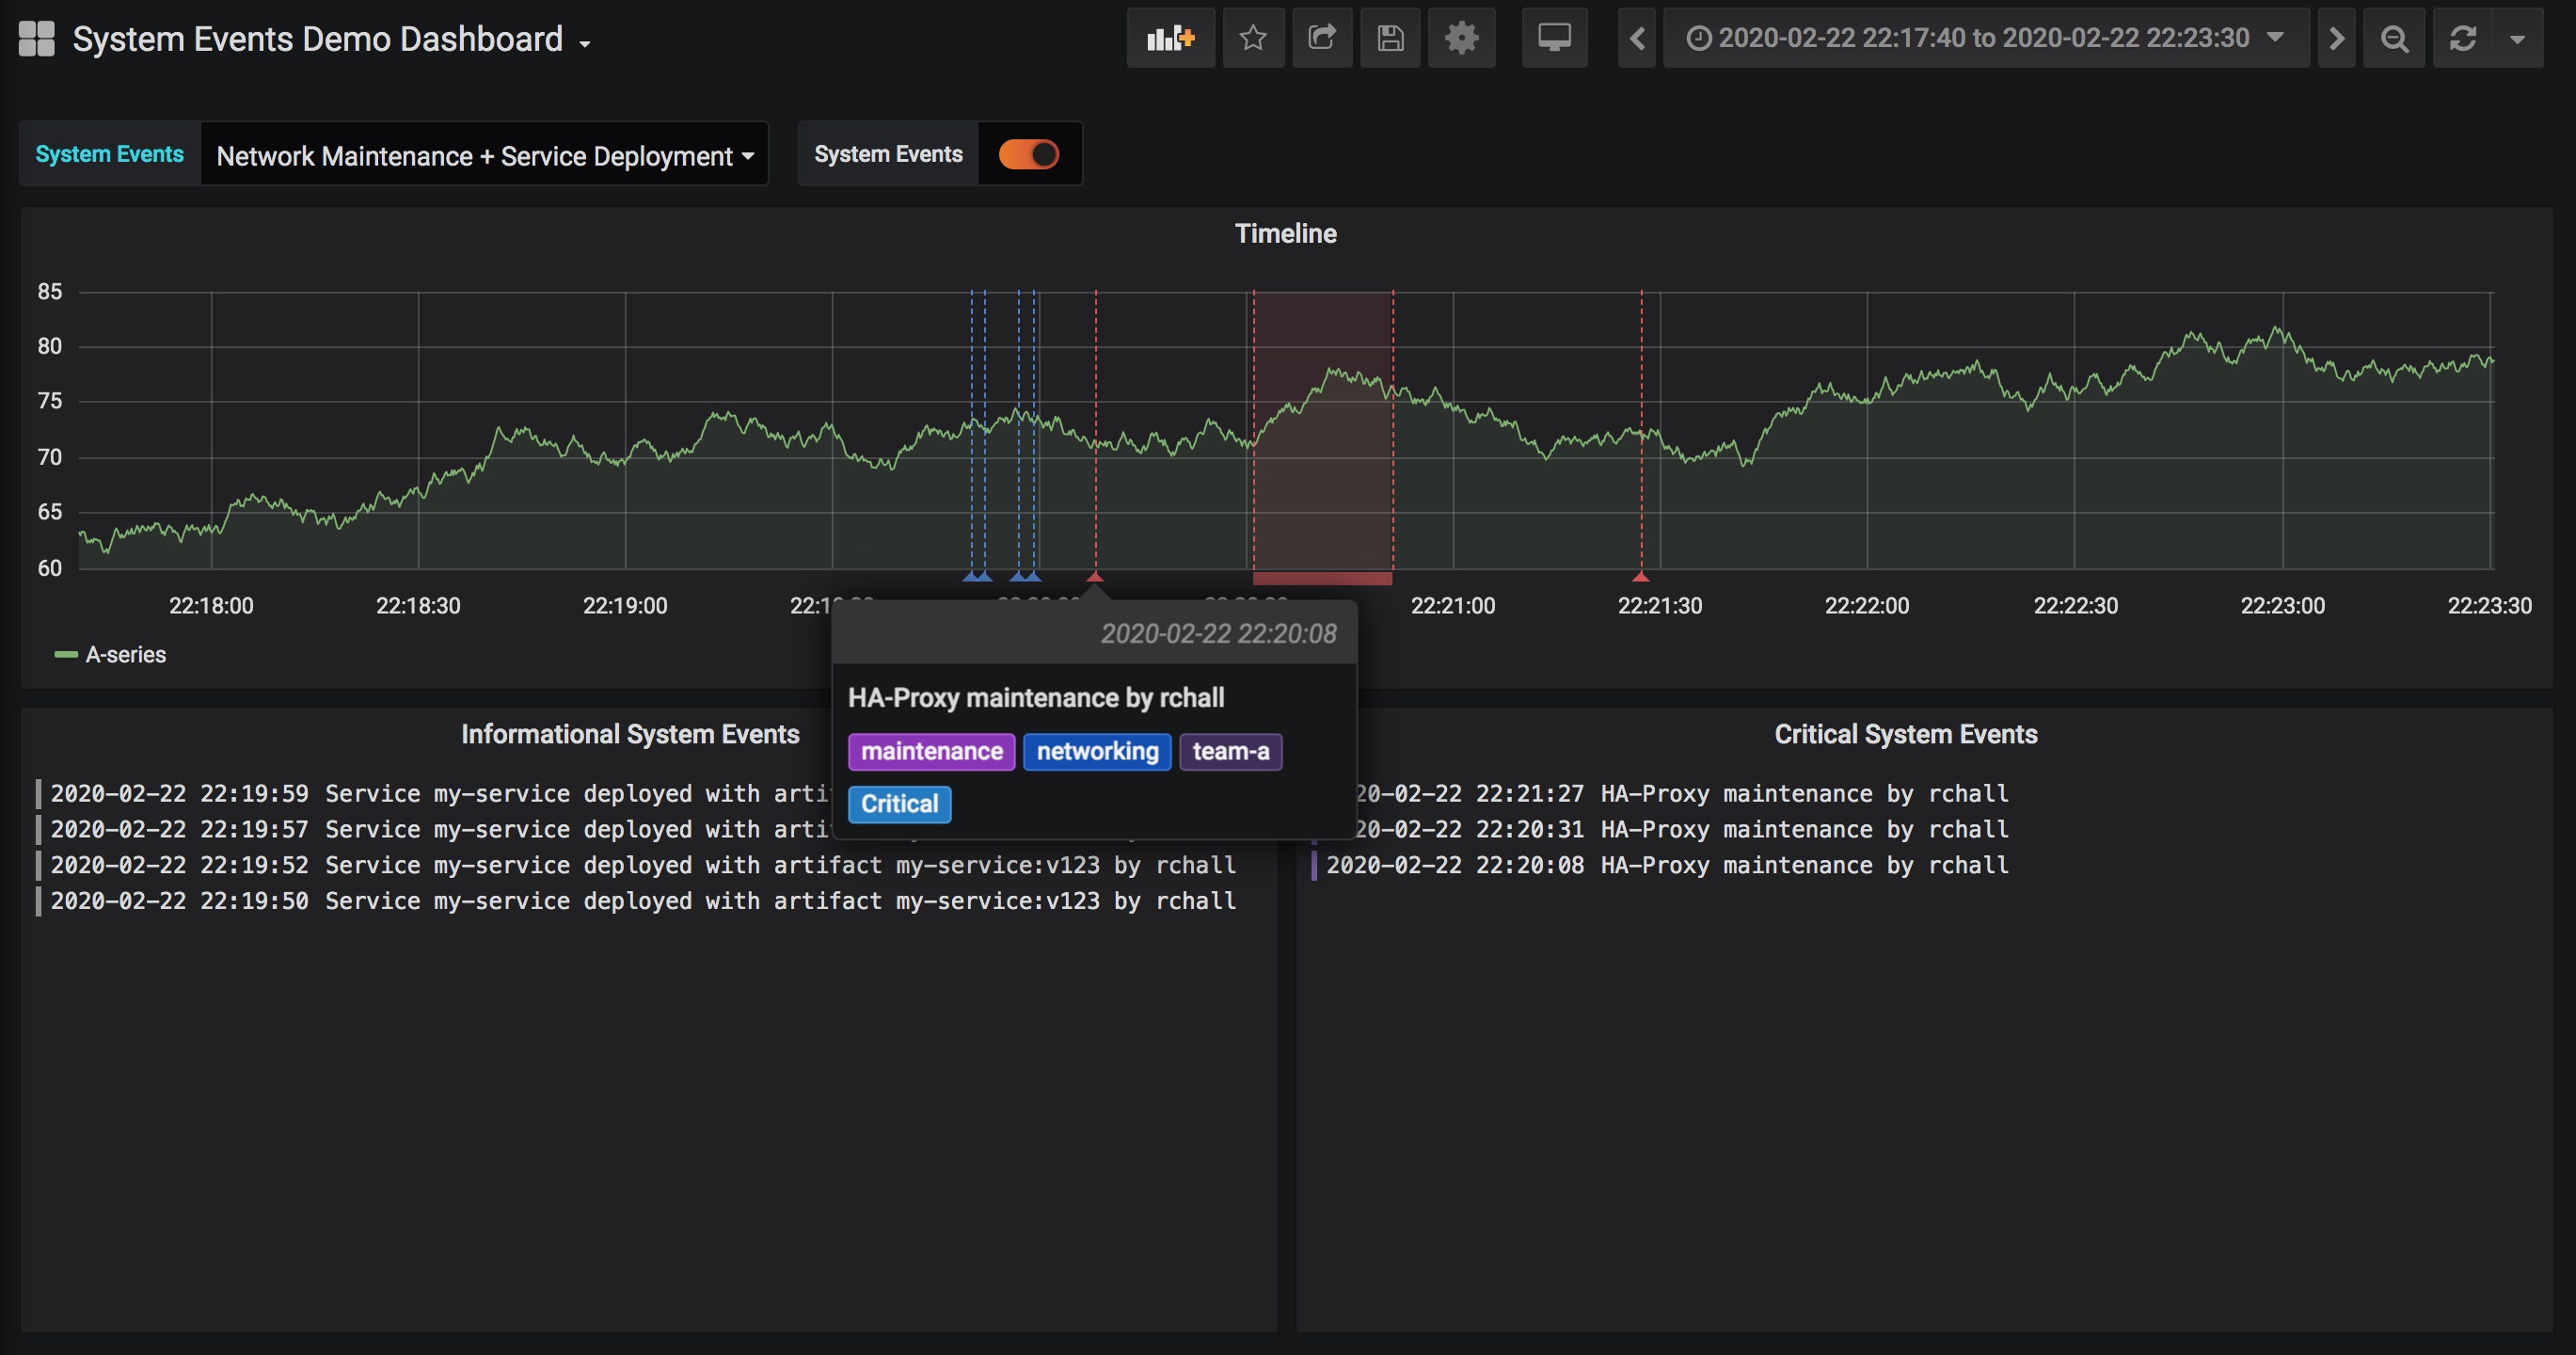
The System Events service is an http service that can proxy formatted annotation events to an Elastic Search Deployment.
Elasticsearch is a search engine based on the Lucene library that is very popular for event log data. You can use it from Grafana to create annotations based on the events you proxy to it using the System Events Service. Read about how to use Grafana annotations with Elasticsearch
Annotation events are very useful when maintaining a system owned by multiple developers, specially multiple teams. It improves the troubleshooting process by providing accurate information on the different things that ocurred before an outage that could be the potential root causes of it.
- Simple System Events
Use POST /event to create a new system event at the time of the request
- Range System Events
Use POST /event/start to indicate a system event just started. Use the returned eventId with the POST /event/end to indicate the system event finished. This feature is very useful for prolonged events like maintances and deployements of large farms.
Because the System Events service uses internally the NEST Client it's version matches the version of the NEST Client, to make it easier to pick the correct version that would work with your Elastic Search Deployment version. Read about NEST Client versioning
Local development using Docker Compose
Build the event system service and all the supporting services for local development
docker-compose build
Deploy Elastic Search locally
docker-compose up -d elasticsearch
Create the system event index on your previously deployed ES
docker-compose up -d es-index-creator
Finally deploy the System Events service
docker-compose up -d system-events
docker run --env-file path/to/envvars --volume path/to/config.yml:/config/config.yml --name system-events raulchall/system-events
Find which port the System Events service is running
docker port system-events
Find examples on the scripts folder
sh scripts/send-event.sh {system-events-port}
Replace the system-events-port with the port obtained on the previous step
Visit http://localhost:{system-events-port}/swagger
Deploy Grafana locally
docker-compose up -d grafana
docker port system-events-grafana
Visit http://localhost:{grafana-port}/swagger
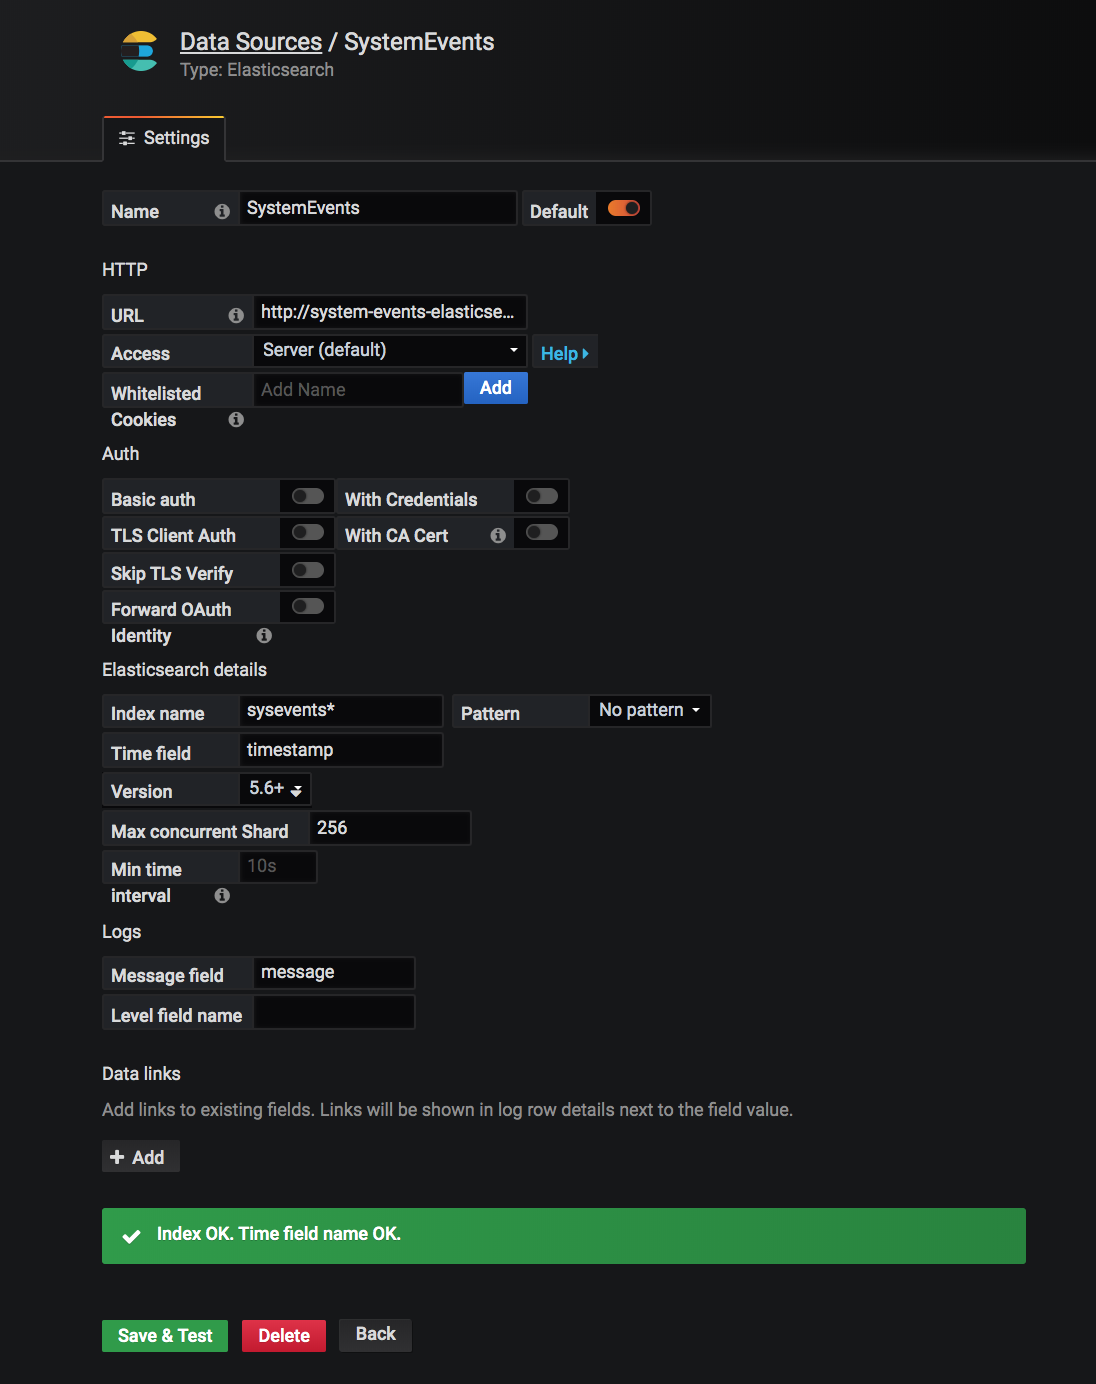
Add a new Grafana Datasource. Set
Name = SystemEvents
Url = http://system-events-elasticsearch:9200/
Follow the image for the rest of the fields
On Grafana import the example dashboard Done!
The System Events service exposes Prometheus metrics. You can deploy the Prometheus stack locally to checkout the metrics.
Run Prometheus server
docker-compose up -d prometheus
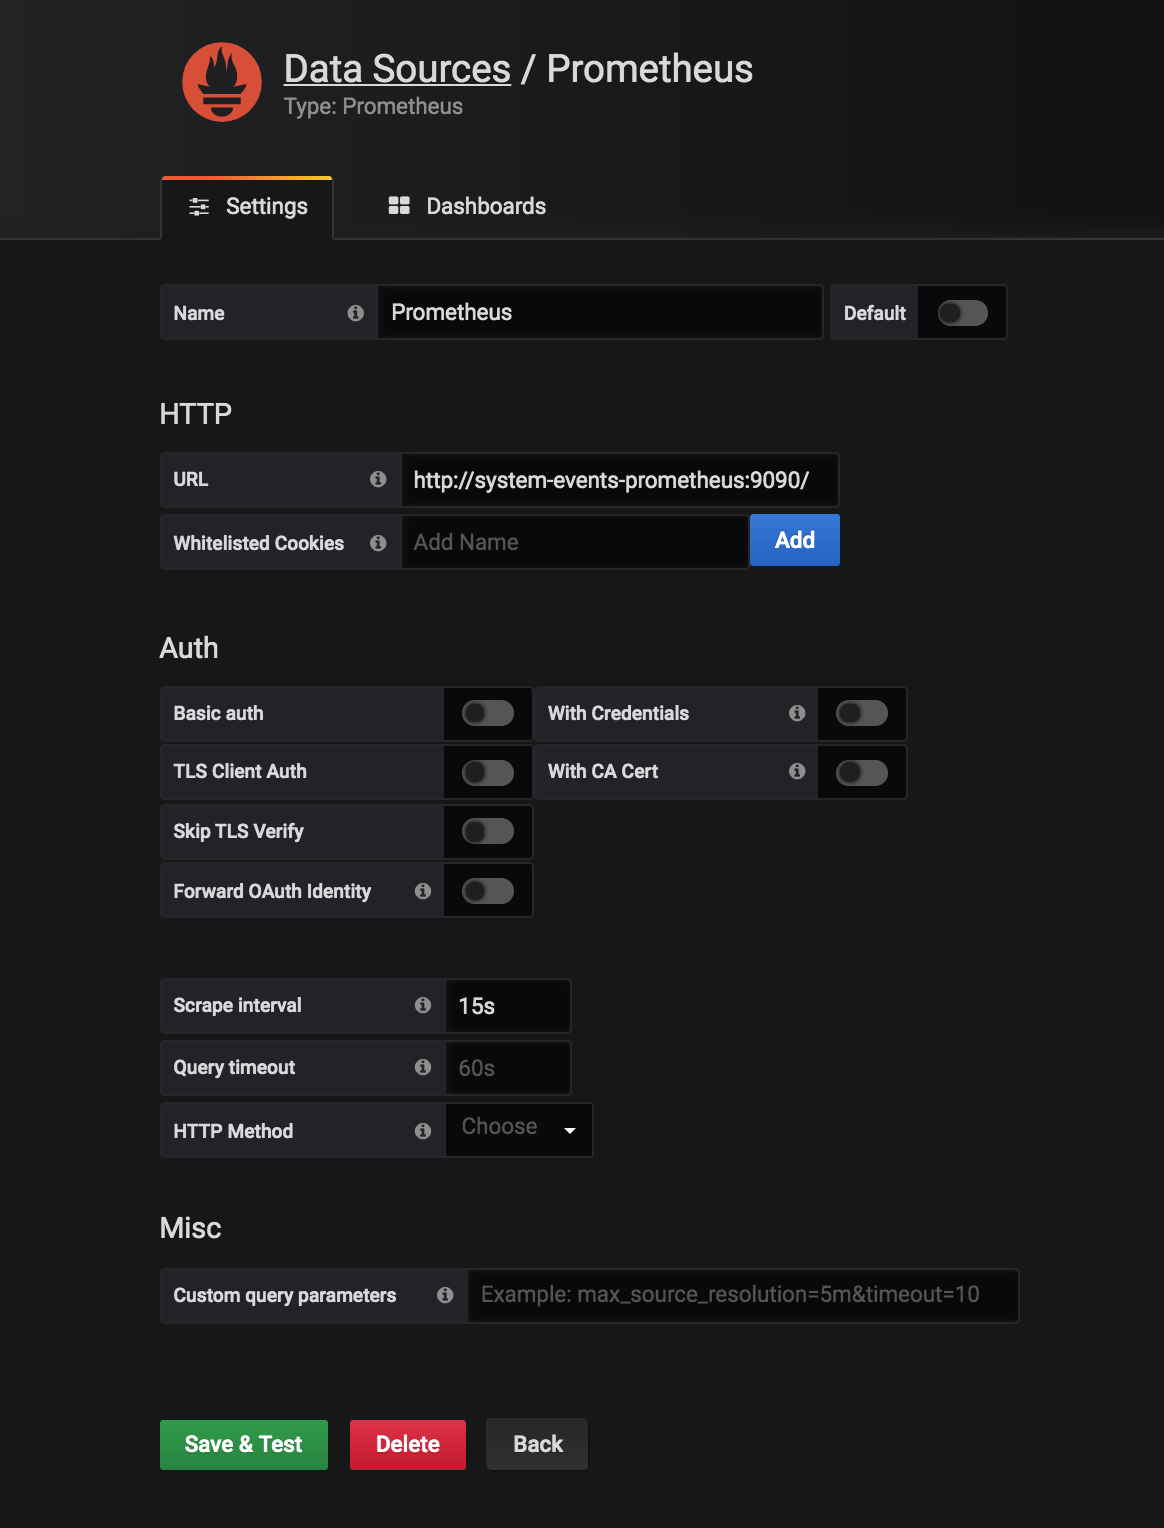
Go back to Grafana and setup the Prometheus Datasource. Set
Name = Prometheus
Url = http://system-events-prometheus:9090/
Follow the image for the rest of the fields
Import the System Events Internal Metrics Dashboard to Grafana Done
The System Events service requires a basic configuration and adds extra configuration if advance features are required
Provide values for following environment variables.
Serilog:MinimumLevel=Error

# IMPORTANT: If running in Production remove these 2 variables
ASPNETCORE_ENVIRONMENT=Development
ASPNETCORE_SUPPRESSSTATUSMESSAGES=true

# Variables for the ES Client

# Specify the Uris for the nodes on your ES cluster separated by comma
ELASTICSEARCH_URL_CSV=http://system-events-elasticsearch:9200/
ELASTICSEARCH_INDEX=sysevents
ELASTICSEARCH_TIMEOUT_MS=5000

# This format needs to match the format for your date fields in your ES Index
ELASTICSEARCH_DATETIME_FORMAT=yyyy-MM-dd'T'HH:mm:ssZ
Add an extra environment variable containing the path to the Advance configuration file
AdvanceConfigurationPath=../config/config.yml
Example of Advance Configuration file
config.yml
categories:
  - name: Adhoc
    description: Use it for unplanned events
  - name: Database Migration
    description: Database migration events
  - name: Service Deployment
    description: Service deployment events
  - name: Network Maintenance
    description: Network Maintenance events
    level: critical
By adding specific Event Categories the service will reject System Events with not allowed Categories, this way the number of categories can be kept under control. Optionally specify a level for the category, if a level is specified then the system will reject events for the category on different levels, otherwise all levels will be allowed for the category.
You can always relax this restriction by adding * as an allowed category
config.yml
categories:
  - name: '*'
    description: All categories are allowed
  - name: Database Migration
    description: Database migration events
    level: critical
In this case the restriction for only critical Database Migration events will still apply but the system will allow any other incoming category.
This feature allows for creating notification channels for specific Event Categories, allowing broadcast notifications of important or relevant system events.
It requires the category to be defined under the categories section.
Example of Advance Configuration file
config.yml
categories:
  - name: Adhoc
    description: Use it for unplanned events
  - name: Database Migration
    description: Database migration events
  - name: Service Deployment
    description: Service deployment events
  - name: Network Maintenance
    description: Network Maintenance events

subscriptions:
  - type: sns
    category: Network Maintenance
    topic_arn: arn:aws:sns:us-east-1:000000000000:system-event-network-maintenance
  - type: sns
    category: Database Migration
    topic_arn: arn:aws:sns:us-east-1:000000000000:system-event-database-migration
  - type: slack
    category: Service Deployment
    webhook_url: https://hooks.slack.com/services/Your/WebHook/Url
You can create a subscription for all your categories by using the * category
Ex.
subscriptions:
  - type: slack
    category: '*'
    webhook_url: https://hooks.slack.com/services/Your/WebHook/Url
Supported Notification Channels:
You can optionally deploy the Slack App Backend to make it easier for developers to report events. By default all categories on the Advance Configuration are not eligible to be created from the slack app, use the slack_app flag to enable it.
On your config.yml
categories:
  - name: '*'
    description: Allow all events
  - name: Adhoc
    description: Adhoc events
    slack_app: true  # Allow users to create Adhoc category from Slack App
Checklist
- Make sure your
ASPNETCORE_ENVIRONMENTis set to other thanDevelopment. Or not present in your environment - Set your Log Level to Error
Serilog:MinimumLevel=Error. Too much logging impacts performance - Either build from source or use the image from Docker Hub
- Have fun!
Same, same. Add issues or feature requests. Send me a PR.


