The goal of this demo is to show some of the key capabilities of Red Hat AMQ Streams.
One of the key feature of Red Hat® AMQ Streams is bringing the power of Apache Kafka in OpenShift Container Platform, leveraging the Strimzi project.[1]
Add AMQ Streams operator to your OpenShift environment.
Create a Broker with metrics enabled:
-
consumer lag
-
consumer offsets
oc new-project my-kafka
oc apply -f k8s/01-kafka-metrics.yaml
oc apply -f k8s/02-kafkatopic.yaml|
Note
|
This demo relies on the cluster-admin role. |
The following command:
-
adds a ConfigMap named
cluster-monitoring-configin theopenshift-monitoringnamespace -
creates a ClusterRoleBinding which grants permissions to
grafana-serviceaccount
oc apply -f k8s/03-cluster-monitor.yamlThe ConfigMap triggers the deployment of Prometheus and Thanos: after a while it’s possible to check that the prometheus-operator, prometheus-user-workload and thanos-ruler-user-workload pods are running in the openshift-user-workload-monitoring project.
oc -n openshift-user-workload-monitoring get podEnable: - monitoring for kafka resources - prometheus rules
oc apply -f k8s/04-pod-monitor.yaml -n my-kafka
oc apply -f k8s/05-prometheus-rules.yaml -n my-kafka
Grafana uses the Thanos Querier which works as Prometheus proxy to scrape the metrics.
The following script: * creates a service account for Grafana with an access token * creates a datasource configuration for Grafana to scrape the metrics. It points to Thanos Querier which acts as a Prometheus proxy and uses the previous created access token to gain access.
k8s/07-create-datasource.shDeploy Grafana and expose it:
oc apply -f k8s/08-grafana.yaml
oc create route edge --service=grafana --namespace=my-kafka
Login with the default credentials (admin/admin) and then change the password.
Load the dashboard definitions from grafana-dashboards folder:
-
strimzi-kafka.json -
strimzi-kafka-exporter.json
mvn -f kafka-consumer/pom.xml package -Dquarkus.kubernetes.deploy=true -DskipTests
mvn -f kafka-producer/pom.xml package -Dquarkus.kubernetes.deploy=true -DskipTests
Further information about the applications:
-
Show consumer logs
oc logs --tail=20 -f --selector="app.kubernetes.io/name=kafka-consumer" -
Show producer logs
oc logs --tail=20 -f --selector="app.kubernetes.io/name=kafka-producer" -
Show the partitions distribution
oc exec -it my-cluster-kafka-0 -- bin/kafka-topics.sh \ --bootstrap-server my-cluster-kafka-bootstrap:9092 \ --describe --topic event -
Test the Kafka’s resilience and consistency by forcefully shutting down one of brokers' pod.
TipUse the following command: oc delete --force pod <pod-name>ImportantWatching at the consumer log you should notice that it temporarily stops processing some messages (missing messages). This is expected! In fact, Kafka promotes consistency over availability, so until a new partition leader is elected you cannot write or consume messages on that partition. Eventually, the new leader will become available and the missing messages will be caught up. -
Show again the topic distribution on the cluster members
-
Show the dashboard
-
Add the Cruise Control
oc patch kafka my-cluster --patch '{"spec":{"cruiseControl": {}}}' --type=merge -
To simulate an unbalanced workload, the following steps will configure the producer to write messages on the partitions which leader is hosted in the same Kafka server:
-
Locate the partition leaders
oc exec -it my-cluster-kafka-0 -- bin/kafka-topics.sh \ --bootstrap-server my-cluster-kafka-bootstrap:9092 \ --describe --topic event -
Update the producer configmap to select all the partitions which have the leaders located in the same server:
oc edit configmap kafka-producer-config
-
Update the following variables matching the desired partitions, e.g.:
  PRODUCER_PARTED: "true"
  PRODUCER_PARTITIONS: 0,3,6,9
-
Bump the Kafka producer application:
oc scale deployment/kafka-producer --replicas=0
oc scale deployment/kafka-producer --replicas=1
-
-
Check that partitions grows at different paces, running the following command:
oc exec -it my-cluster-kafka-0 -- bin/kafka-run-class.sh kafka.tools.GetOffsetShell --broker-list localhost:9092 --topic event -
Deploy the rebalance configuration which will trigger the optimization analysis:
oc apply -f k8s/10-kafka-rebalance-full.yaml
-
Review the optimization proposal:
oc describe kafkarebalance full-rebalance
-
Approve the proposal
oc annotate kafkarebalances.kafka.strimzi.io full-rebalance strimzi.io/rebalance=approve
TipIt’s possible to trigger a new analysis on the existing rebalancing configuration:
oc annotate kafkarebalances.kafka.strimzi.io full-rebalance strimzi.io/rebalance=refresh
-
Rebalancing takes some time, run again the following command and wait for
Status: Trueoc describe kafkarebalance full-rebalance
-
Run again the describe topic command, you should spot the overloaded partitions moved on different leaders:
oc exec -it my-cluster-kafka-0 -- bin/kafka-topics.sh \
            --bootstrap-server my-cluster-kafka-bootstrap:9092 \
            --describe --topic event
When the Kafka cluster scales, existing topics do not leverage the newly available brokers, so they remain idle until new topics are created. The Cruise Control can be used to evenly distribute existing topics on the new available resources, as the following steps will show:
-
Increase the Kafka replicas:
oc patch kafka my-cluster --patch '{"spec":{"kafka": {"replicas": 4}}}' --type=merge -
Change the producer configurations to create an evenly distributed workload:
oc edit configmap/kafka-producer-config
Modify the environment variables:
  PRODUCER_PARTED: "false"
  PRODUCER_TICK_FREQUENCY: "10"
-
Restart the producer and consumer application
-
Open the Grafana dashboard, after a few minutes, the CPU graph should look like the following:
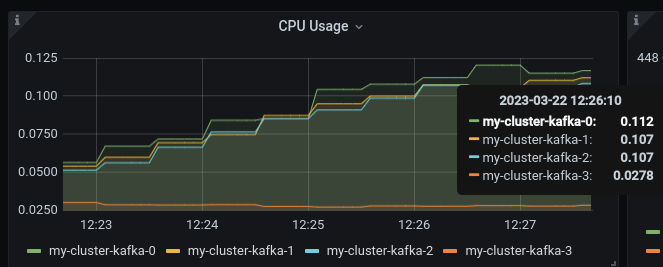
The new broker uses less resources.
-
Watching at the topic information confirms that all partitions are on the first 3 brokers (0,1,2)
oc exec -it my-cluster-kafka-0 -- bin/kafka-topics.sh \ --bootstrap-server my-cluster-kafka-bootstrap:9092 \ --describe --topic event -
Deploy the rebalance configuration
mode: add-brokers, which is tailored to leverage the new available brokers:oc apply -f k8s/11-kafka-rebalance-add-brokers.yaml
-
Review and approve the optimization proposal:
oc describe kafkarebalance full-rebalance
oc annotate kafkarebalances.kafka.strimzi.io full-rebalance strimzi.io/rebalance=approve
-
Rebalancing takes a couple of minutes, you can monitor the Grafana dashboard to see the changes and the topic information to understand how the partitions and their replicas are reorganized across the brokers.
-
Finally, you can ask the Cruise Control to shrink your partitions on less brokers and then scale the cluster down.

In this section, the consumer is enhanced to store the messages in a Postgres DB. The goal is to show the client scalability and resiliance
-
Stop the consumer and producer and restore the normal producer behavior
oc scale deployment kafka-consumer --replicas=0
oc scale deployment kafka-producer --replicas=0
oc edit configmap kafka-producer-config
update the evironment variable to its original value
PRODUCER_PARTED: "false" -
Deploy the database (basic ephemaral deployment)
oc create configmap event-db-init-data --from-file=./kafka-producer/src/main/resources/import.sql
oc apply -f k8s/20-postgres.yaml
-
Edit the consumer configuration to enable persistence:
oc edit configmap/kafka-consumer-config
Change this environment variable:
TRACKING_DB: "true" -
Reset the producer and the consumer
oc scale deployment kafka-consumer --replicas=1
oc scale deployment kafka-producer --replicas=1
-
Deploy a simple Python application to poll the DB and detect duplicate or missing messages
oc new-build --strategy docker --binary --name=db-watcher
oc start-build db-watcher --from-dir python-db-watcher/ --follow
oc new-app -l app.kubernetes.io/part-of=event-application -e POSTGRES_SVC=event-db db-watcher
-
Open the db-watcher logs
oc logs --tail 10 -f --selector="deployment=db-watcher"NoteAt this point, there should be no missing or duplicate messages, so the log should be empty. -
Scale up the consumer
oc scale deployment kafka-consumer --replicas=2
NoteWhen the new consumer pod become active, the other consumer gives up half of his partitions to the new one. For a while you should spot some missing messages in db-watcherlog. However, it’s a transient condition. -
Test the consumer’s resiliance and consistency by brutely shutting down one of the two pods.
TipUse the following command: oc delete --force pod <pod-name>
Up to now, the producer has been using an in-memory counter to generate an ordered sequence of messages.
By changing the producer configuration, it’s possible to leverage a PostgresSQL sequence to maintain a shared counter. As a result, it’s possible to scale up the producer and probe the producer failover.
-
Open the producer configuration and set
SEQUENCE_DB`to `trueoc edit configmap kafka-producer-config
-
Restart the producer scaling it down and up to 2 instance:
oc scale deployment kafka-producer --replicas=0
oc scale deployment kafka-producer --replicas=2
-
After a few seconds you can start dropping the producer pods:
oc delete --force pod kafka-producer-<id>
-
Analyzing the db-watcher log, you are unlikely to find a missing message, because you should stop the producer at the exact moment when it gets the sequence number from the DB and before it sends it to Kafka. For educational purposes, the producer exposes an endpoint which throw a runtime exception at exactly that point:
-
Open a shell into one of the producer pod:
oc rsh kafka-producer-5d8856fb9f-cmt7r
-
Inject and HTTP PUT request on the local endpoint:
$ curl -X PUT localhost:8080
-
-
Now, looking at the db-watcher log you should see a missing message.
Those connection type exposes Kafka in the external listener configuration:
-
nodeportuses a NodePort type Service -
loadbalanceruses a Loadbalancer type Service -
ingressuses Kubernetes Ingress and the Ingress NGINX Controller for Kubernetes -
routeuses OpenShift Routes and the HAProxy router (the simplest method albeit not the most efficient)
Here we’ll use route and scram-sha-512 for authentication:
-
Add external listener by adding this section to the existing Kafka resource:
    - name: external
      tls: true
      type: route
      port: 9094
      authentication:
        type: scram-sha-512
Otherwise patch it with the following command:
oc patch kafka my-cluster --patch '{"spec":{"kafka": { "listeners": [{"authentication":{"type":"scram-sha-512"},"name":"external","port":9094,"tls":true,"type":"route"} ] } }}' --type=merge -
Define a new user:
oc apply -f k8s/30-user.yaml
-
The client must trust the Kafka CA certificate to establish the encrypted connection. The following command extract the CA certificate and create a truststore for the Java clients:
oc get kafka my-cluster -o=jsonpath='{.status.listeners[?(@.name=="external")].certificates[0]}{"\n"}' > kafka-cluster-ca.crt
keytool -import -trustcacerts -alias root -file kafka-cluster-ca.crt -keystore truststore.jks -storepass password -noprompt
-
Configure the kafka consumer to run from your local environment and connect to the Kafka cluster on OpenShift. The following script configures the truststore, the security protocol, the authentication mechanism and the credentials which are extracted from the secret:
echo -e "\n\n## Kafka remote config
kafka.ssl.truststore.location = ../truststore.jks
kafka.ssl.truststore.password = password
kafka.security.protocol=SASL_SSL
kafka.sasl.mechanism=SCRAM-SHA-512" >> kafka-consumer/src/main/resources/application.properties
echo "kafka.sasl.jaas.config=$(oc get secret my-user -o jsonpath='{.data.sasl\.jaas\.config}' | base64 -d)" >> kafka-consumer/src/main/resources/application.properties
oc get kafka my-cluster -o jsonpath='{"\nkafka.bootstrap.servers="}{.status.listeners[?(@.name=="external")].bootstrapServers}{"\n"}' >> kafka-consumer/src/main/resources/application.properties
NoteThe properties are added to the application.propertiesmanaged by Quarkus. By convention, all properties prefixed withkafkaare passed to the Kafka client API configuration. -
Start locally the kafka consumer:
mvn -f kafka-consumer/pom.xml package quarkus:dev
Alternatively, you can use the console consumer shipped by the Kafka project.
Use the previous step command to create the client.config file (drop kafka. prefix).
Then issue the following command:
bin/kafka-console-consumer.sh \
--bootstrap-servers (oc get kafka my-cluster -o jsonpath='{.status.listeners[?(@.name=="external")].bootstrapServers}')
--topic event \
--consumer.config client.configYou can grant different permissions to your users.
There are 4 options:
-
Simple authorization
-
OAuth 2.0 authorization using Red Hat SSO
-
Open Policy Agent (OPA) authorization
-
Custom authorization
|
Tip
|
To ensure a clean environment, stop any running client: oc scale deployment kafka-producer --replicas=0
oc scale deployment kafka-consumer --replicas=0 |
In this tutorial, you will configure the simple authorization:
-
Enable the authorization in the Kafka resource:
oc edit kafka my-cluster
Under
kafkaaddauthorizationand the the authentication for each listener:### kafka section authorization: type: simple ### for each listener add: authentication: type: scram-sha-512
WarningWhen you enable the authorization all your listener have to authenticate their clients. In fact, authorization acts cluster wide, so you cannot accept anymore anonymous interactions. -
Edit the
kafkauserresourceoc edit kafkausers my-user
Add the following ACLs:
  # at spec level:
  authorization:
    type: simple
    acls:
    - resource:
        name: event
        patternType: literal
        type: topic
      operations:
      - Read
      - Describe
      - Write
      - IdempotentWrite
    - resource:
        name: '*'
        patternType: literal
        type: group
      operations:
      - Read
      - Write
The previous definition grants the main operations (read, write, etc) to the
eventtopic and to all consumer groups. -
Wait a few minutes while the operator completes the rolling update of the Kafka brokers and the entity operator, then you can start the local consumer to check that it is still working properly, inspect the logs to spot potential error messages.
mvn -f kafka-consumer/pom.xml package quarkus:dev
-
To prove that ACL can block your user from reading, remove the
Readoperation and and execute again the the local consumer (check previous step). -
Stop the consumer and add back the
Readoperation in the ACL.
When the authorization is enabled, the Kafka client inside OCP require the proper configuration to provide the correct credential when they initiate the broker conversation.
-
Open the configmap with the producer environment variable and add the following:
  KAFKA_SASL_JAAS_CONFIG: |-
    org.apache.kafka.common.security.scram.ScramLoginModule
    required username="my-user" password="<PASSWORD>";
  KAFKA_SASL_MECHANISM: SCRAM-SHA-512
  KAFKA_SECURITY_PROTOCOL: SASL_PLAINTEXT
Replace
<PASSWORD>with the outcomes of:oc get secret my-user -o jsonpath='{.data.password}' | base64 -d -
Issue the following commands to start the Kafka producer application, inspect the logs, and spot potential error messages:
oc scale deployment/kafka-producer --replicas=1
oc logs --tail=20 -f --selector="app.kubernetes.io/name=kafka-producer"
In order to start the demo from scratch, with minimal effort: delete only the kafka broker and the topics:
oc delete kafkatopics --selector="strimzi.io/cluster=my-cluster"
oc delete kafka my-cluster
Drop the PVC:
oc delete pvc --selector="strimzi.io/cluster=my-cluster"Delete kafka rebalance:
oc delete kafkarebalance full-rebalanceThen, you can apply again the first two yaml files.
Prometheus access token lasts 7 days.
To refresh it:
oc delete serviceaccounts grafana-serviceaccount
oc delete configmap grafana-config
k8s/07-create-datasource.sh
oc delete pod --selector name=grafanaDelete Grafana deployment:
oc delete all --selector application=kafka-monitor
oc delete configmap grafana-config
Deploy Grafana running step 7 and 8.
When on the client side you get an error id, e.g.:
2023-06-06 17:50:29,556 DEBUG Runtime failure during token validation (ErrId: 5cbf1e54)You can search that id in the server log to gather further insights.
To raise the log verbosity, use the following configuration:
spec:
  kafka:
    logging:
      type: inline
      loggers:
        log4j.logger.io.strimzi: "DEBUG"