In this project, we will be analyzing the TMDb movie data. Our goal is to analyze the data and find out the answers to the following questions:
Question 1: Which genre of movies are most popular across the years?
Question 2: What genre of movie has highest budget and revenue?
Question 3: Does popularity of the movie affect the profit?
The dataset consists of movies released on or before 2015. The dataset has variables which include id, imdb_id, popularity, budget, revenue, original_title, cast, homepage, director, tagline, overview, runtime, genres, production_companies, release_date, vote_count, vote_average, release_year, budget_adj, revenue_adj.
id- A unique identifier for each movie. Will help to differentiate movies with same namesimdb_id- A unique identifier for each movie assigned by IMBD Has little significance and it will be droppedpopularity- A numeric quantity showing how the movie is popular This will be used to determine populality of the moviebudget- the amount used in terms of money to make the movie will be dropped and adjusted column usedrevenue- how much was earned from the movie will be dropped and adjusted column usedoriginal_title- the title given to the moviecast- the list of actors in the moviehomepage- a url of website where one can read about the movie not significant in analysis will be droppeddirector- the director of the movietagline- a short descriptive statement about the movieoverview- A brief description of the movieruntime- the running time of the movie in minutesgenres- the genre of the movieproduction_companies- which company produced the movierelease_date- month date and the year the movie was releasedvote_count- the count of votes recievedvote_average- average rating the movie receivedrelease_year- the year the movie was releasedbudget_adj- the is the budget adjusted to reflect the inflationrevenue_adj- the is the revenue adjusted to reflect the inflation
To run the project, you need to have python installed on your computer. You can download python from here. After installing python, you need to install the following libraries:
pandasnumpymatplotlibseaborndatetime
You can install the libraries by running the following command in your terminal:
pip install pandas numpy matplotlib seaborn datetimeIn our project, we have used jupyter notebook to run the code. You can install jupyter notebook by running the following command in your terminal:
pip install jupyterAfter installing the libraries, you can run the project by running the following command in your terminal:
jupyter notebookWe will be using pandas explode() function to split the data in the genres column. This function is available in pandas version 0.25.0 and above. If you are using an older version of pandas, you can update it by running the following command in your terminal:
pip install pandas --upgradeThis section will describe the data wrangling process. We will be performing the following steps:
Load the data into a pandas dataframe
# Load your data and print out a few lines
df = pd.read_csv('./Database_TMDb_movie_data/tmdb-movies.csv')
We will investigate the dataset to determine if there are any missing values, duplicate values, and any other issues that need to be addressed before we can proceed with the analysis. We will also drop the columns that are not significant in the analysis. For these steps, we will be using the following commands:
df.shape- to get the number of rows and columns in the datasetdf.describe()- to get the statistical information about the datasetdf.info()- to get the information about the datasetdf.isnull().sum()- to get the count of missing values in each columndf.duplicated().sum()- to get the count of duplicate values in the datasetdf.nunique()- to get the count of unique values in each columndf.dtypes- to get the data types of each column
Upon executing the df.info() and df.isnull().sum() commands, it becomes evident that several columns, namely homepage, director, tagline, overview, genres, and production_companies, have missing values. Since these columns do not hold significant value in the analysis, we will eliminate them. Additionally, we will eliminate the imdb_id column as it is also not essential in the analysis. Additionally, we have identified a duplicated row in the dataset, which we will remove.
# Drop the columns that are not needed. These columns are imdb_id, homepage, tagline, keywords, overview, budget, revenue, cast.
df.drop(['imdb_id', 'homepage', 'tagline', 'keywords', 'overview', 'budget', 'revenue', 'cast'], axis=1, inplace=True)

# Drop the duplicates.
df.drop_duplicates(inplace=True)
The release_date column is in string format. We will convert it to datetime format. This will help us to work with dates beter. We will also create a new column profit which will be the difference between revenue_adj and budget_adj.
# Convert release_date to datetime format
df['release_date'] = pd.to_datetime(df['release_date'])

# Create a new column profit which is the difference between revenue_adj and budget_adj
df['profit'] = df['revenue_adj'] - df['budget_adj']
We will create a new column with month name from release_date column. This will help us to analyse the data based on month and determine the most popular month for movies and if movies released in a particular month are more profitable.
# Create a new column month which will have the month name from release_date
df['month'] = df['release_date'].dt.month_name()
The genres column has multiple genres for a movie. We will split the genres and create a new row for each genre. This will help us to analyse the data based on genres and determine the most popular genre for movies and if movies of a particular genre are more profitable.
# Split the genres column and create a new row for each genre
df_genres = df.copy()
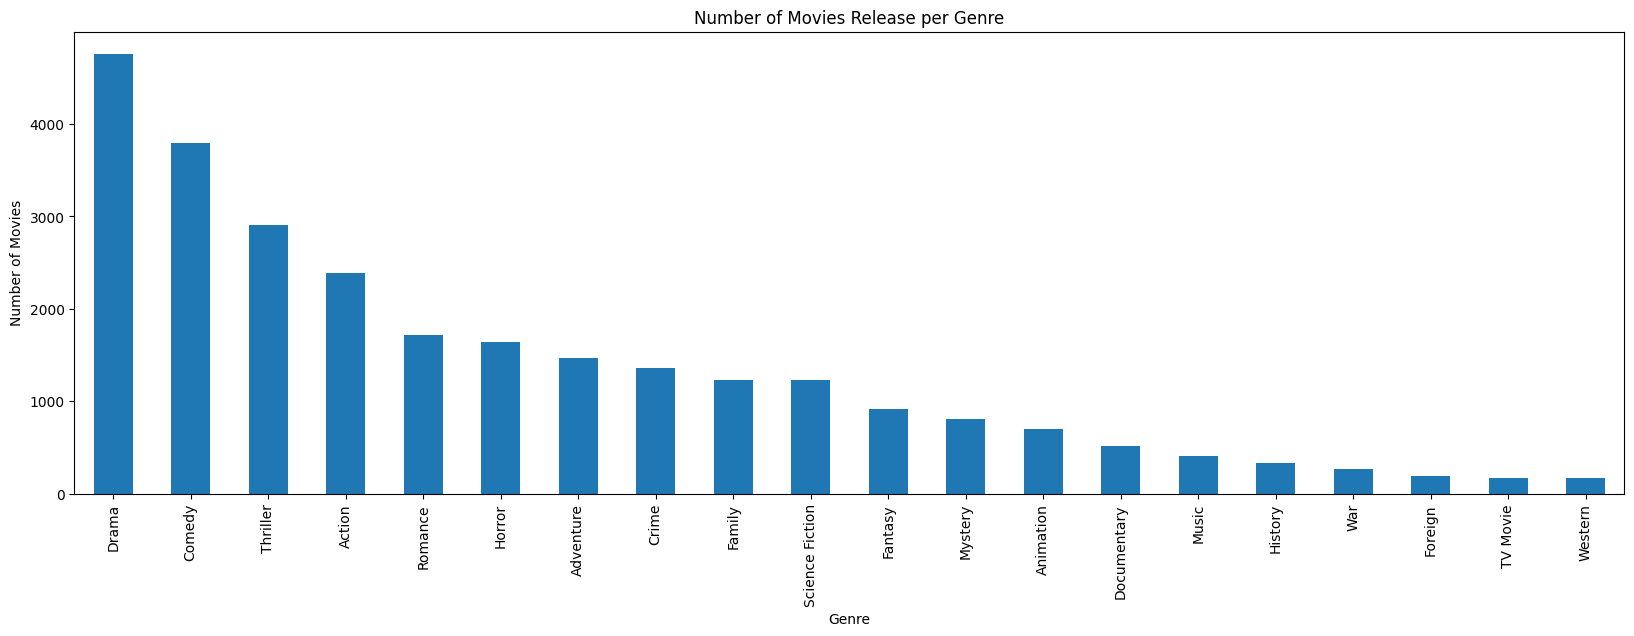
df_genres = df_genres.assign(genres=df_genres['genres'].str.split('|')).explode('genres')The most popular genre of movies is Drama while Western is the least popular genre of movies.
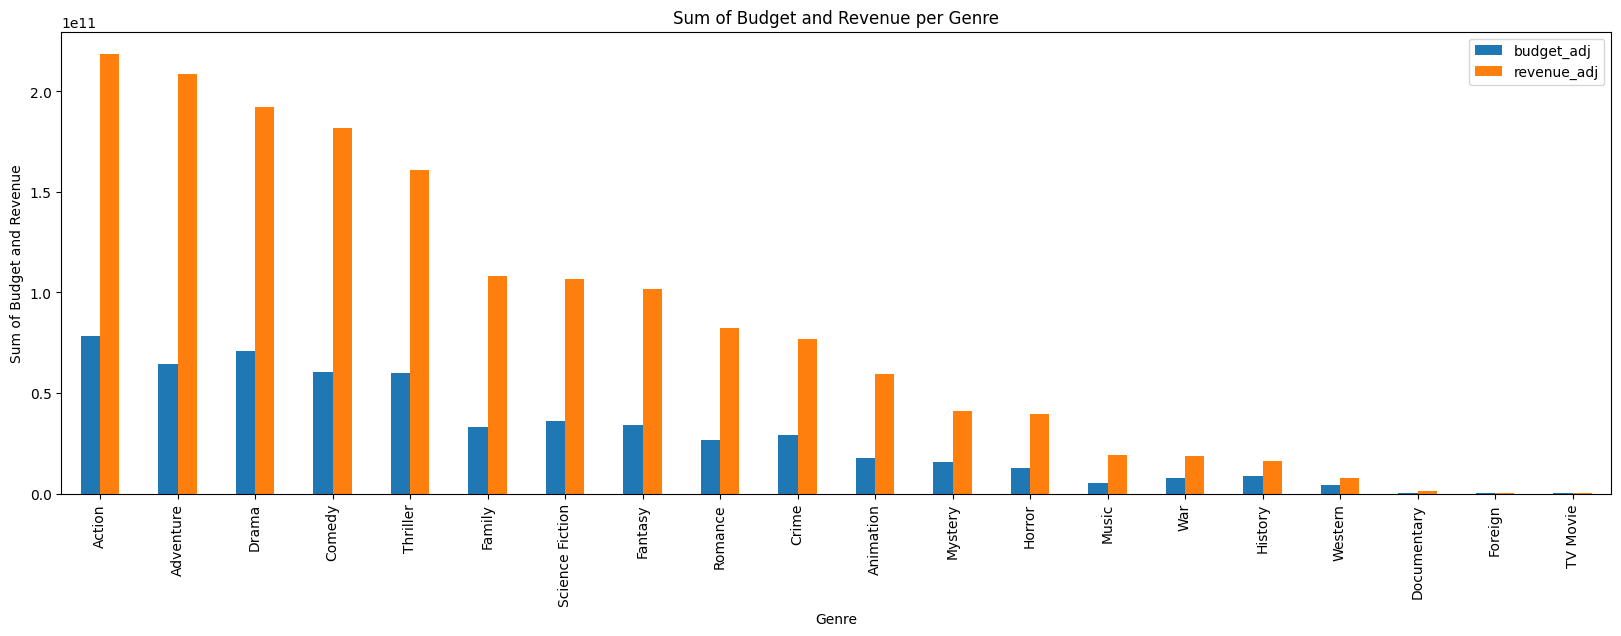
The genre of movie with highest budget is Action followed closely by Drama while the genre of movie with highest revenue is Action. Based on these observations, we can see how the budget and revenue are related to the genre of the movie.
From the above plot, we can see month of release can affect the revenue. Movies released in the month of June are the most profitable. The least profitable month of release is January.
After analysing the data, we can conclude the following: The success of a movie can be determined by the genre of the movie. Movies of genre Adventure and Action are the most profitable. We have also seen that certain months of release can affect the revenue. Movies released in the month of June are the most profitable. The least profitable month of release is January. We have also seen that the popularity of the movies does not mean there will be a high profit. Movies with low popularity, when combined together, have the highest profit.
For a movie to be successful, it should also have a good budget, should be released in the month of June and should be of genre Adventure or Action.

