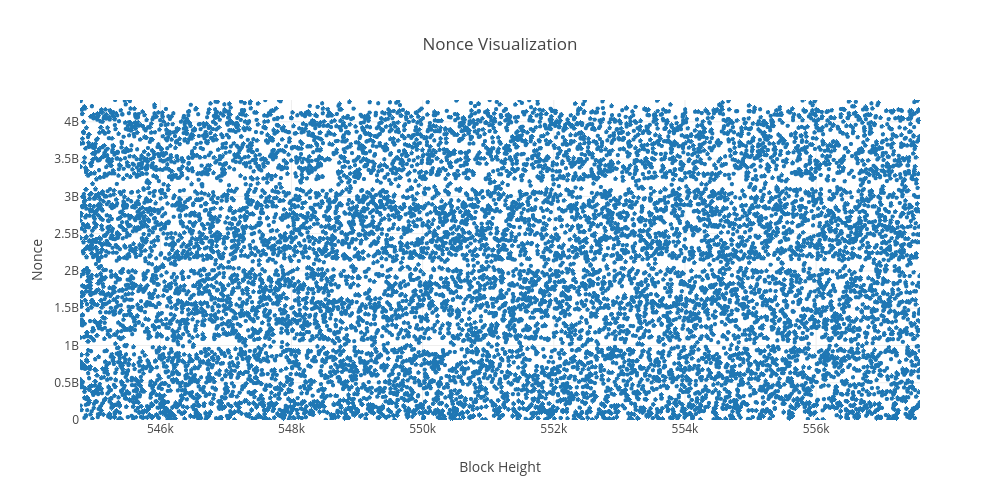
This nodejs codebase was inspired by some tweets from @100TrillionUSD about a weird pattern in the nonce vs block height visualization. Check out the thread to see what others are saying on the topic. Also there's a dope reddit thread on the topic sparked by u/NekoNormalan.
npm install
I'm using config to specify things like the RPC server, blocks to sync/index in a go and plotly credentials. You can update the values in config/default.json or just create a copy named development.json or production.json to match your NODE_ENV so that you don't commit any senstive credentials.
The visualization is of the Bitcoin blockchain. So run the following command to get a few blocks to visualize.
node persist-blocks.js
This will start index the blockchain from the newest block to the oldest.
The nonce.png is created by running the following command
node nonce-to-height-scatter-plot.js
There's a few things that could be done to make this codebase better or easier to use. Here are a few of them.
- Export an html of an interactive version of the visualization.
- Write a few more scripts for other visualizations.
- Sync and index the coinbase transaction and make visulizations.
