
Wrapper for matplotlib that allows for pythonic plot specifications
- Free software: MIT license
- Documentation: https://pythonic-plots.readthedocs.io.
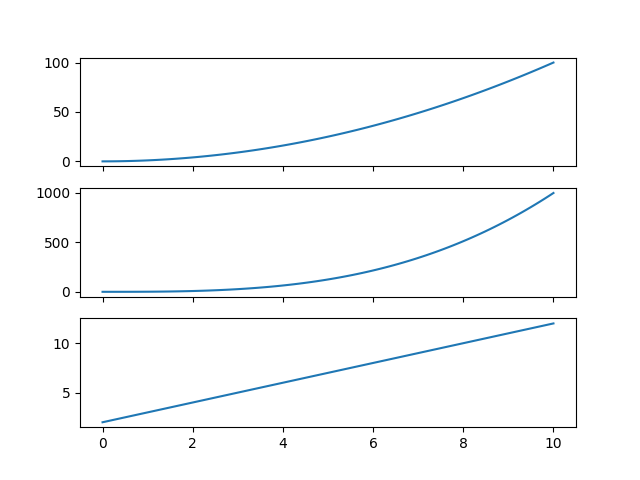
The point of this package is to wrap pyplot plotting functions with lazy evaluations so that subplots can be defined using lists or nested lists. A simple example is:
>>> from pythonic_plots import plt
>>> import numpy as np
>>> x = np.linspace(0, 10, 100)
>>> panel = [plt.plot(x, x**2),
...          plt.plot(x, x**3),
...          plt.plot(x, x+2)]
>>> plt.show(panel)
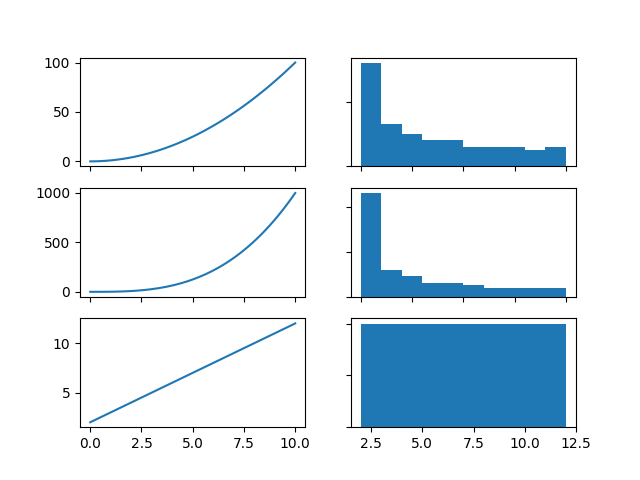
Or a nested list:
>>> panel = [[plt.plot(x, x**2), plt.hist(x**2)],
...          [plt.plot(x, x**3), plt.hist(x**3)],
...          [plt.plot(x, x+2),  plt.hist(x+2)]]
>>> plt.show(panel)
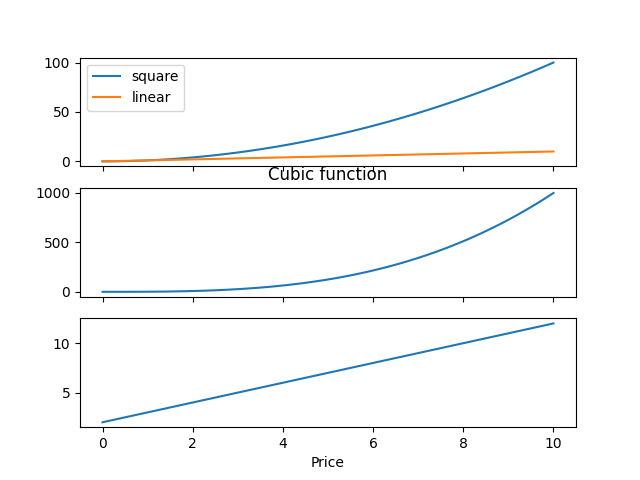
In order to make each subplot more complicated, addition can be used:
>>> panel = [plt.plot(x, x**2, label="square") + plt.plot(x, x, label="linear") + plt.legend(),
...          plt.plot(x, x**3) + plt.set_title("Cubic function"),
...          plt.plot(x, x+2) + plt.set_xlabel("Price")]
>>> plt.show(panel)
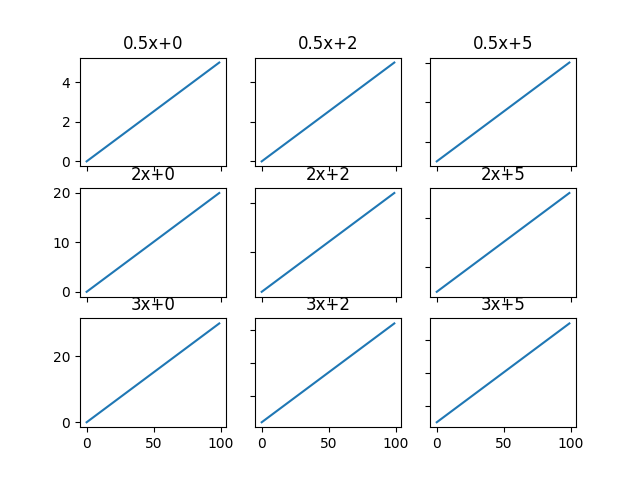
And panels can be specified programatically using list comprehensions:
>>> panel = [[plt.plot(a*x+b)+plt.set_title(f"{a}x+{b}") for b in (0, 1, 2)]
...          for a in (0.5, 2, 3)]
>>> plt.show(panel, sharex=True, sharey=True)
This package was created with Cookiecutter and the audreyr/cookiecutter-pypackage project template.


