-
This repository reproduces the experimental results of a paper "Causal Effect Estimation on Hierarchical Spatial Graph Data" presented in KDD 2023.
-
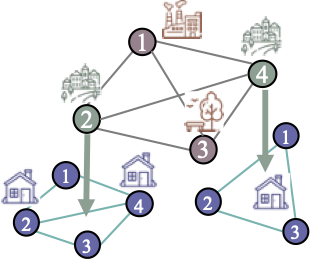
An example of hierarchical spatial graph data with global and local graphs containing covariates (blue), intervention (green).
- python 3
- To install requirements:
conda env create -f environment.yml
conda activate sinet_env
.
├── README.md
├── config
│   └── GWN-GWN-MLP
│       ├── make_script.py
│       ├── run_script.sh
│       ├── script
│       └── template.yml
├── data
│   ├── experiment
│   ├── sample
│   │   ├──xz <- download sample.zip and unzip it
│   │   └──y  <- download sample.zip and unzip it
│   ├── source
│   └── y_scaler.pkl
├── demo_sinet.py <- run this!
├── environment.yml
├── model
│   ├── sinet.py
│   └── template.py
├── out
└── util
    ├── smoothmax.py
    ├── util_dataloader.py
    ├── util_globalgraph.py
    ├── util_seatgraph.py
    └── util_stgraph.py
- The simulation data can be download from here and should be set in the folder
./data/.
- see
demo_sinet.pyfor run a demo. - see
./config/run_script.shfor commands for running scripts. - Further details are documented within the code.
If you find this repository, e.g., the code and the datasets, useful in your research, please cite the following paper:
@inproceedings{takeuchi2023sinet,
  title={Causal Effect Estimation on Hierarchical Spatial Graph Data},
  author={Takeuchi, Koh and Nishida, Ryo and Kashima, Hisashi and Onishi, Masaki},
  booktitle={the 29th ACM SIGKDD Conference on Knowledge Discovery and Data Mining (KDD '23)},
  year={2023}
}

