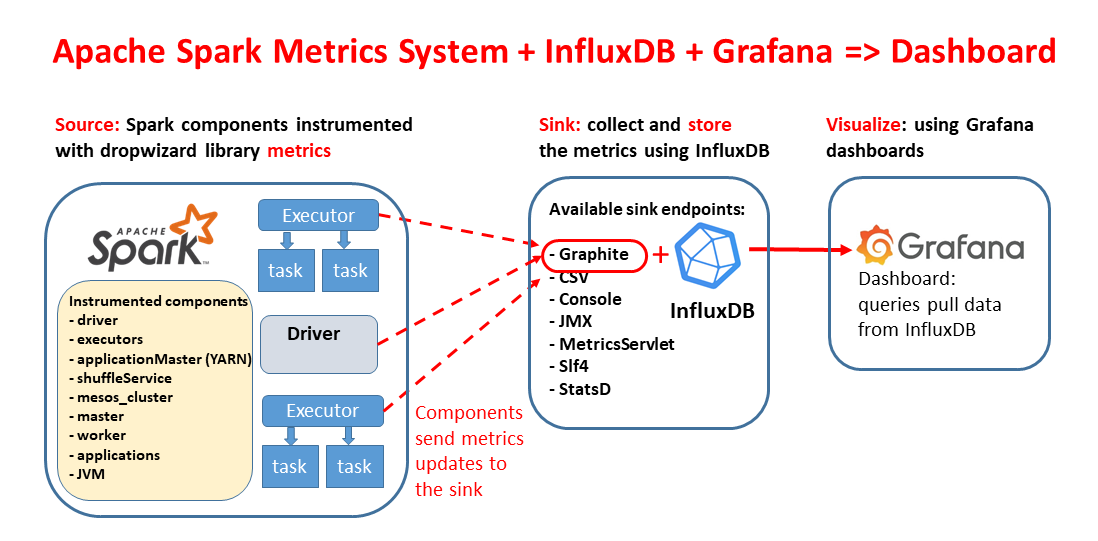
This repository is meant to streamline the deployment of Apache Spark Performance Dashboard using containers technology. It is implemented using Grafana, InfluxDB, and the Spark metrics system.
Why: Troubleshooting Spark jobs and understanding how system resources are used by Spark executors can be complicated. This type of data is precious for visualizing and understanding root causes of performance issues. Using the Spark Dashboard you can collect and visualize many of key metrics available by the Spark metrics system as time series, empowering Spark applications troubleshooting, including straggler and memory usage analyses.
Compatibility: Use with Spark 3.x and 2.4.
Demos and blogs:
- Short demo of the Spark dashboard
- Blog entry on Spark Dashboard
- Talk at Data+AI Summit 2021, slides
- Notes on Spark Dashboard
Main author and contact: Luca.Canali@cern.ch
Previous contributors: Riccardo Castellotti, Michal Bien.
Related work: sparkMeasure a tool for performance troubleshooting of Apache Spark workloads
The Spark Dashboard collects and displays Apache Spark workload metrics produced by
the Spark metrics system.
Spark metrics are exported via a Graphite endpoint and stored in InfluxDB.
Metrics are then queried from InfluxDB and displayed using a set of pre-configured Grafana dashboards distributed with this repo.
Note that the provided installation instructions and code are intended as examples for testing and experimenting.
Hardening the installation will be necessary for production-quality use.
Two different installation options are packaged in this repository, use the one that best suits your environment:
- dockerfiles -> Docker build files for a Docker container image, use this to deploy the Spark Dashboard using Docker.
- charts -> a Helm chart for deploying the Spark Dashboard on Kubernetes.
- Quickstart:
docker run --network=host -d lucacanali/spark-dashboard:v01 - Details: dockerfiles
- Quickstart:
helm install spark-dashboard https://github.com/cerndb/spark-dashboard/raw/master/charts/spark-dashboard-0.3.0.tgz - Details: charts
You will need to set a few Spark configuration parameters to hook the Spark metrics system instrumentation to the dashboard. In particular, you need to point Spark to write to the InfluxDB instance (via a Graphite endpoint).
# InfluxDB endpoint, as started using the docker container
INFLUXDB_ENDPOINT=`hostname`

# For helm deployments use this instead
#INFLUXDB_ENDPOINT=spark-dashboard-influx.default.svc.cluster.local

bin/spark-shell (or spark-submit or pyspark) ...addtitional options...

--conf "spark.metrics.conf.*.sink.graphite.class"="org.apache.spark.metrics.sink.GraphiteSink" \
--conf "spark.metrics.conf.*.sink.graphite.host"=$INFLUXDB_ENDPOINT \
--conf "spark.metrics.conf.*.sink.graphite.port"=2003 \
--conf "spark.metrics.conf.*.sink.graphite.period"=10 \
--conf "spark.metrics.conf.*.sink.graphite.unit"=seconds \
--conf "spark.metrics.conf.*.sink.graphite.prefix"="luca" \
--conf "spark.metrics.conf.*.source.jvm.class"="org.apache.spark.metrics.source.JvmSource" \
--conf spark.metrics.appStatusSource.enabled=true \
- The Grafana dashboard should be reachable at port 3000 of your machine/VM where you started the container
- Point your browser to
http://hostname:3000(edithostnameas relevant) - Credentials: use the default for the first login (user: admin, password: admin)
- The Grafana dashboard is reachable at port 3000 of the spark-dashboard-service.
See service details:kubectl get service spark-dashboard-grafana
When using NodePort and an internal cluster IP address, this is how you can port forward to the service from the local machine:kubectl port-forward service/spark-dashboard-grafana 3000:3000
- First logon: use user "admin", with password admin (you can change that after logon)
- Choose one of the provided dashboards (for example start with Spark_Perf_Dashboard_v03) and select the user, applicationId and timerange.
- You will need a running Spark application configured to use the dashboard to be able to select and application and display the metrics.
Optionally, you can add annotation instrumentation to the performance dashboard. Annotations provide additional info on start and end times for queries, jobs and stages. To activate annotations, add the following additional configuration, needed for collecting and writing extra performance data:
INFLUXDB_HTTP_ENDPOINT="http://`hostname`:8086"
--packages ch.cern.sparkmeasure:spark-measure_2.12:0.21 \
--conf spark.sparkmeasure.influxdbURL=$INFLUXDB_HTTP_ENDPOINT \
--conf spark.extraListeners=ch.cern.sparkmeasure.InfluxDBSink \
- More details on how this works and alternative configurations at Spark Dashboard
- The dashboard can be used when running Spark on a cluster (Kubernetes, YARN, Standalone, Mesos) or in local mode. When using Spark in local mode, please use Spark version 3.1 or higher, see SPARK-31711
- The configuration in the example below is done using
spark.metrics.conf...parameters, as an alternative you can choose to configure the metrics system using the configuration file$SPARK_HOME/conf/metrics.properties file
- InfluxDB will use port 2003 (graphite endpoint), and port 8086 (http endpoint) of
your machine/VM (when running using
--network=host). - Note: the endpoints need to be available on the node where you started the Docker container and reachable by Spark executors and driver (mind the firewall).
- Find the InfluxDB endpoint IP with
kubectl get service spark-dashboard-influx. Optionally resolve the dns name withnslookupof such IP. For example, the InfluxDB service host name of a test installation is:spark-dashboard-influx.default.svc.cluster.local
The provided example dashboards are examples based on the authors' usage. Only a subset of the metrics values logged into
InfluxDB are visualized in the provided dashboard.
For a full list of the available metrics see the
documentation of Spark metrics system.
New dashboards can be added by putting them in the relevant grafana_dashboards folder and re-building the container image
(or re-packaging the helm chart).
On Helm: running helm-update is enough to upload it as ConfigMap and make it available to Grafana.
Automatically persisting manual edits is not supported at this time.
