Original code modified from https://gabrieltanner.org/blog/collecting-prometheus-metrics-in-golang
Run:
go buildto get the executable ORdocker build . -t example-appto create a container image if you prefer docker instead or don't have access to a Go dev environment
go run .ORdocker run -p 8080:8080 example-app
Then visit http://localhost:8080 or http://localhost:8080/metrics
Run docker-compose up
You can access Prometheus at http://localhost:9090 and Graphana at http://localhost:3000
- Login into Graphana. Default user/password for Graphana is admin/admin
- Add a datasource for type Prometheus at address http://localhost:9090 and auth type "Browser"
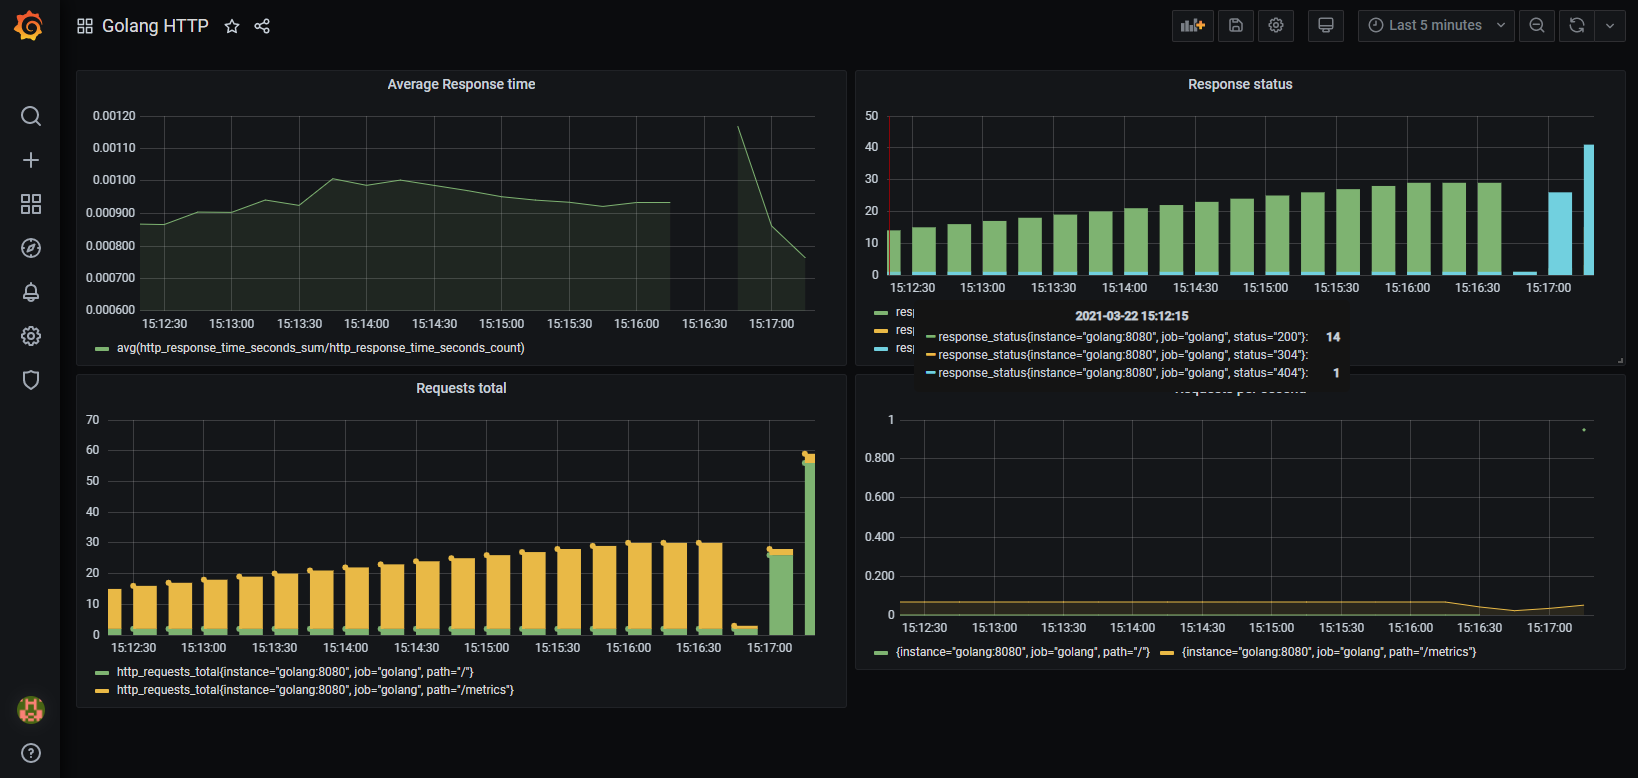
- Import graphana/graphana-dashboard.json as a premade dashboard
