Team Members: Ehsan Khan, Jeff Mackey, Lei Kang, Saurav Mitra
Extract
- Data Source
World Wild Life: https://www.worldwildlife.org/species/directoryProcess
Scraped the names of endangered species listed in the multiple web-pages. Went into each of these species page. Extracted the image url, description, scientific name, status of danger and population of these endangered species. - Data Source
IUCN Red List: https://www.iucnredlist.org/Process
The species list scraped from World Wild Life are double-checked with IUCN Red List by animal’s scientific name. Redundant common names with the same scientific name as well as that referred to two scientific names were crossed out. Scientific names were extra terms or typo errors were corrected. Animals’ native extant countries w/o resident were scraped and saved. - Data Source
Global Climate Change: https://data.world/data-society/global-climate-change-dataProcess
*.csv files for global land temperatures by country was downloaded. - Data Source
Country Codes : https://countrycode.org/Process
Country names with country code and iso codes were scraped down and saved as reference to unify names for animal habitat countries as well as those appearing in temperature table. - Data Source
NY Times: https://developer.nytimes.com/docs/articlesearch-product/1/Process
API calls were made to retrieve NY Times articles of the endangered species.
Transform
A database was generated for the endangered animal species scraped from World Wildlife. Any record with missing any of the following information (image url, scientific name, status, population, species description) was dropped.
There were different land regions in the temperature data which could not be identified with any country code. Such as, some of the land regions represented continents instead of countries, some of them have inconsistent names, that did not make sense, were cleaned up.
Species habitats were matched with the corresponding country as listed in the country codes data. Any inconsistent names were sorted out and manually replaced. So were those from temperature table.
Load
A non-relational database has been used to load all the cleaned data. We are dealing with multiple sets of data from different sources, which might or might not have reference to each other. Also, this will be a flexible way to access records from each collection in the database. PyMongo has been used with a single database and 4 collections. The four collections have the following:
- Species information: image url, description, scientific name, status of danger and population
- News Articles: New York Times Articles
- Animal fact: Animal common name, Other name, Scientific name, Habitat/Ecology
- Temperature: Country, Average Temperature, Temperature Uncertainty (Time Series data from 1750)
Following data analyses can be performed with the database:
- Spatial analysis of Endangered Species and population by country can be done.
- Relationship between country temperature and endangered species can be investigated.
- Awareness of endangered species can be estimated by the mention in press, viz. New York Times.
Visualization
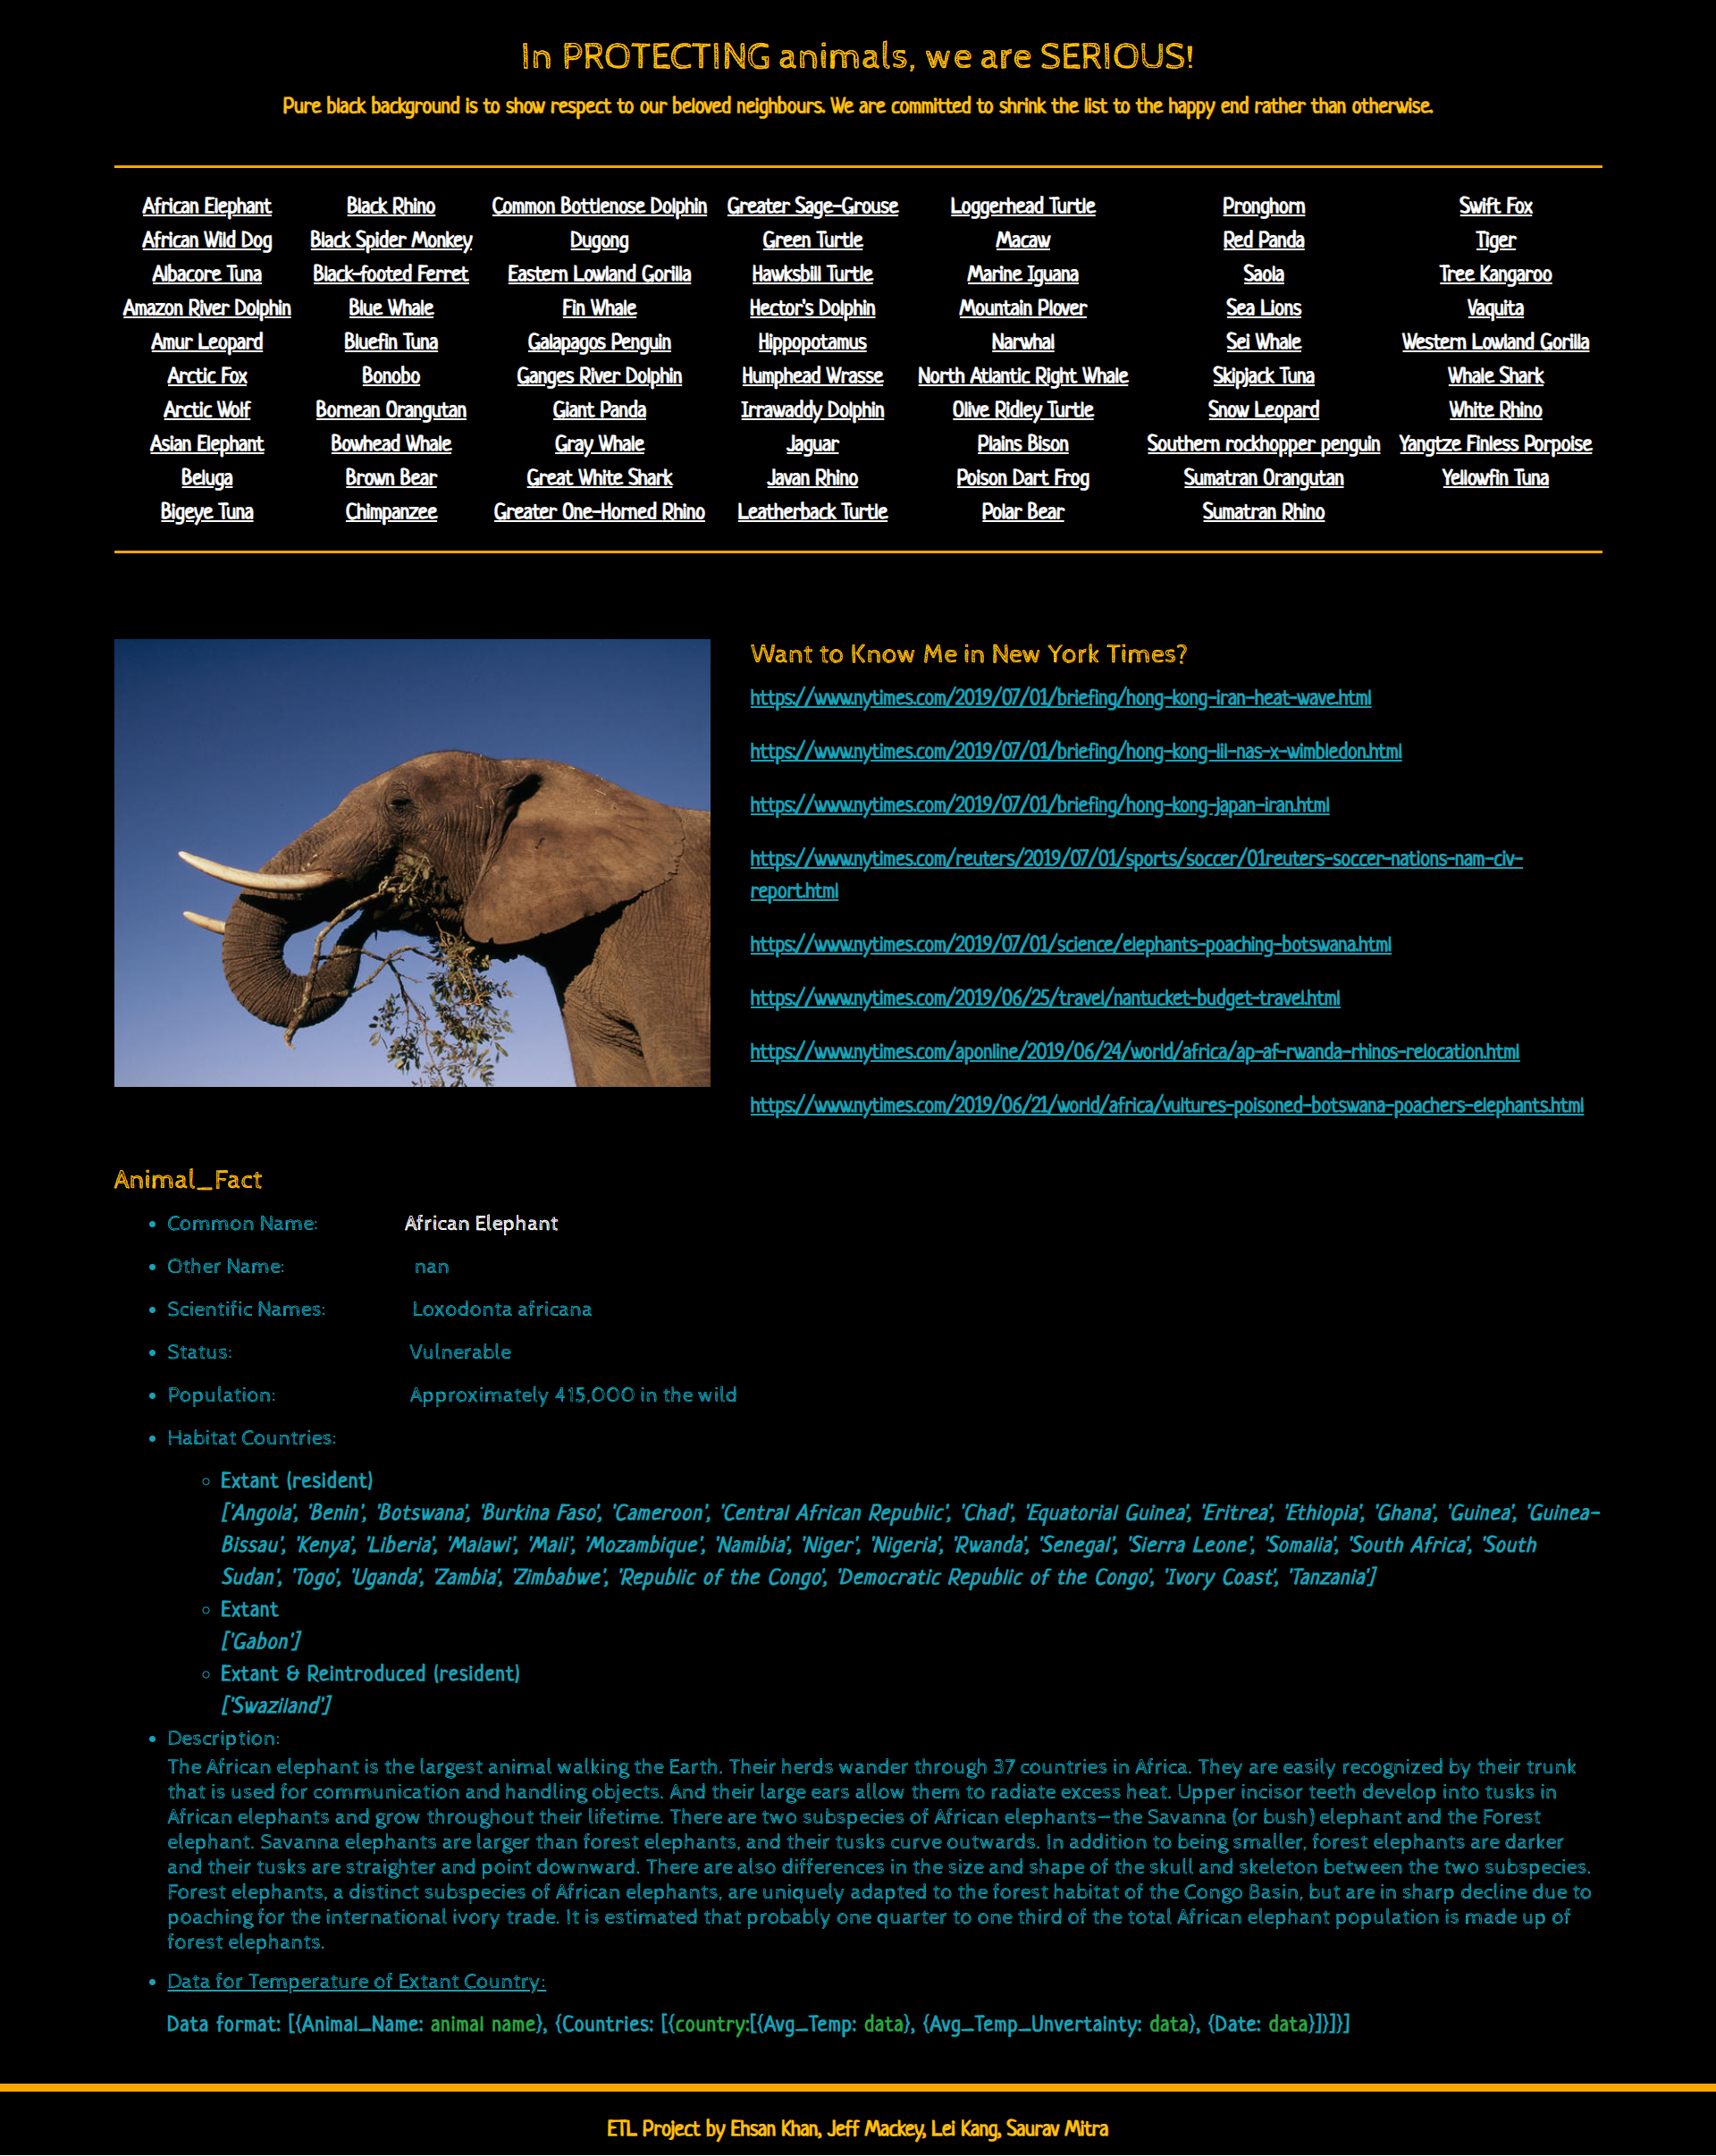
App has been created to visually show the data in html. Link for downloading the temperature data by extant country for each queried animal is available.
