In this lab, we shall put the node centrality measures in to practice to analyze the character interactions in graph structure from the popular series of novels called ""A Song of Ice and Fire" by George R. R. Martin. The of famous HBO series "Game of Thrones" is derived from this saga. In this lab, we shall calculate different centrality measures to identify the the importance of characters as the story progresses.
You will be able to:
- Understand and explain network centrality and its importance in graph analysis
- Understand and calculate Degree, Closeness, Betweenness and Eigenvector centrality measures
- Describe the use case for several centrality measures
A. J. Beveridge, and J. Shan created a network from books "A song of ice and fire" by extracting relationships between characters of the story. The dataset is available at Github as an interaction network which was built as
Parse the text and build a graph by connecting (creating an edge) two characters (nodes of the graph) whenever their names appear within 15 words. The edge weight corresponds to the number of interactions.
The datasets have been made available for you in the repo. You are encouraged to visit A. J. Beveridge's blog to see how this dataset is created, and different network analysis activities which are being performed with this dataset. The image you see below, has been created using same datasets. The blog gives you information on this and more experiments. For this lab, we shall focus more on graph analysis than visualizations.
Let's get on with it.
- Let's give you a head start by loading the libraries that you might need for this experiment.
import pandas as pd
import networkx as nx
import matplotlib.pyplot as plt
import warnings
warnings.filterwarnings('ignore')

%matplotlib inlineThe dataset is available for all 5 books, with two CSV files for each book. One contains nodes data as adjacency matrix and other carries edges data as edge list, e.g. for book 1, asoiaf-book1-edges.csv and asoiaf-book1-nodes.csv. So we have 10 files in total.
- Read edge data for all books into pandas dataframe: book1_df .. book5_df.
How about using a for loop to do this in one go - optional.
# Load edges into dataframes# Create empty instances for each book above- Read the edge lists from the dataframes above into relevant graphs.
- inspect the contents of graph to get an idea about the data structures contained within
# Read edge lists into dataframesLet's use and compare different centralities measures we saw earlier to identify importance of nodes in this network. There is no one right way of calaculating it, every approach has a different meaning.
Degree centrality which is defined by degree of a node (number of neighbors) divided by a noramlizing factor n-1 where n is the number of nodes.
- Find the neighbours of 'Catelyn-Stark' from book 1.
# Neighbors for catelyn stark['Arya-Stark',
'Bran-Stark',
'Bronn',
'Brynden-Tully',
'Cersei-Lannister',
'Colemon',
'Donnel-Waynwood',
'Eddard-Stark',
'Edmure-Tully',
'Eon-Hunter',
'Hallis-Mollen',
'Hoster-Tully',
'Jaime-Lannister',
'Joffrey-Baratheon',
'Jon-Arryn',
'Jon-Snow',
'Jon-Umber-(Greatjon)',
'Luwin',
'Lysa-Arryn',
'Marillion',
'Masha-Heddle',
'Moreo-Tumitis',
'Mya-Stone',
'Mychel-Redfort',
'Nestor-Royce',
'Petyr-Baelish',
'Rickard-Karstark',
'Rickon-Stark',
'Robb-Stark',
'Robert-Arryn',
'Robert-Baratheon',
'Rodrik-Cassel',
'Sansa-Stark',
'Stevron-Frey',
'Theon-Greyjoy',
'Tyrion-Lannister',
'Tytos-Blackwood',
'Tywin-Lannister',
'Vardis-Egen',
'Varys',
'Walder-Frey',
'Wendel-Manderly',
'Willis-Wode']
nx.degree_centrality(graph) returns a dictionary where keys are the nodes and values are the corresponding degree centrality.
- Find the five most and least important characters from book 1 according to degree centrality
# Five most important characters from book 1 according to degree centrality[('Eddard-Stark', 0.3548387096774194),
('Robert-Baratheon', 0.2688172043010753),
('Tyrion-Lannister', 0.24731182795698928),
('Catelyn-Stark', 0.23118279569892475),
('Jon-Snow', 0.19892473118279572)]
# Five least important characters from book 1 according to degree centrality[('Clydas', 0.005376344086021506),
('Arthur-Dayne', 0.005376344086021506),
('Arys-Oakheart', 0.005376344086021506),
('Mance-Rayder', 0.005376344086021506),
('Thoros-of-Myr', 0.005376344086021506)]
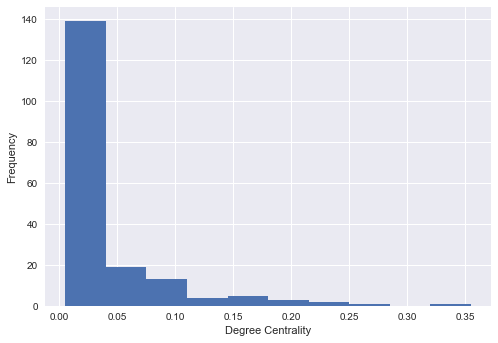
- Plot and explain histogram from degree centrality values, calculated from book 1, and comment on the output
# Plot a histogram of degree centrality# Your observations here
- Create a new centrality measure as a function,
weighted_degree_centrality(Graph)which takes in Graph and the returns a weighted degree centrality dictionary.
Refer to this paper to get an insight into this approacj
Weighted degree is calculated by:
-
Sum the weight of the all edges of a node
-
Normalize the weighted degree by the total weight of the graph i.e. sum of weighted degrees of all nodes
-
Calculated weighted degree centrality for book 1 using this function
def weighted_degree_centrality(G):

    pass
# Uncomment below to run
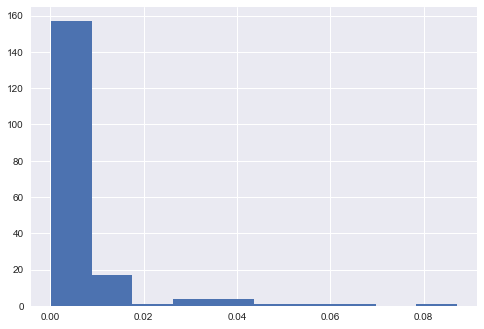
#plt.hist(list(weighted_degree_centrality(G1).values()))
#plt.show()- Get the top 10 characters from book 1, based on weighted degree centrality and compare with the results of simple degree centrality. Record your observations below
# Weighted DC[('Eddard-Stark', 0.08715720879717621),
('Robert-Baratheon', 0.06387455878360032),
('Jon-Snow', 0.05321748574531632),
('Tyrion-Lannister', 0.044121639967417865),
('Sansa-Stark', 0.03699429812652729),
('Bran-Stark', 0.03604398588107521),
('Catelyn-Stark', 0.03529731197393429),
('Robb-Stark', 0.03502579418951941),
('Daenerys-Targaryen', 0.030070594623947868),
('Arya-Stark', 0.02918816182459951)]
# Un-weighted DC[('Eddard-Stark', 0.3548387096774194),
('Robert-Baratheon', 0.2688172043010753),
('Tyrion-Lannister', 0.24731182795698928),
('Catelyn-Stark', 0.23118279569892475),
('Jon-Snow', 0.19892473118279572),
('Robb-Stark', 0.18817204301075272),
('Sansa-Stark', 0.18817204301075272),
('Bran-Stark', 0.17204301075268819),
('Cersei-Lannister', 0.16129032258064518),
('Joffrey-Baratheon', 0.16129032258064518)]
# Your observations here
- __ Confirm that sum of weighted degree centralitity value for all nodes sum up to 1 i.e. normalization__
# Uncomment to run

#sum(list(weighted_degree_centrality(G1).values()))
1.0000000000000002
- Calculate the weighted and un-weighted "Betweenness" centrality for book 2, and compare top ten characters as above
- Comment on the results
# Unweighted Betweenness Centrality[('Eddard-Stark', 0.2696038913836117),
('Robert-Baratheon', 0.21403028397371796),
('Tyrion-Lannister', 0.1902124972697492),
('Jon-Snow', 0.17158135899829566),
('Catelyn-Stark', 0.1513952715347627),
('Daenerys-Targaryen', 0.08627015537511595),
('Robb-Stark', 0.07298399629664767),
('Drogo', 0.06481224290874964),
('Bran-Stark', 0.05579958811784442),
('Sansa-Stark', 0.03714483664326785)]
# Weighted Betweenness similarity [('Robert-Baratheon', 0.23341885664466297),
('Eddard-Stark', 0.18703429235687297),
('Tyrion-Lannister', 0.15311225972516293),
('Robb-Stark', 0.1024018949825402),
('Catelyn-Stark', 0.10169012330302643),
('Jon-Snow', 0.09027684366394043),
('Jaime-Lannister', 0.07745109164464009),
('Rodrik-Cassel', 0.07667992877670296),
('Drogo', 0.06894355184677767),
('Jorah-Mormont', 0.0627085149665795)]
# Your observations hereWell, lets find out.
- Find the correlation between following:
- Weighted Degree
- Closeness
- Weighted Betweenness
- Weighted Eigenvector
- Use book 1 for the analysis (You may choose other books as well)
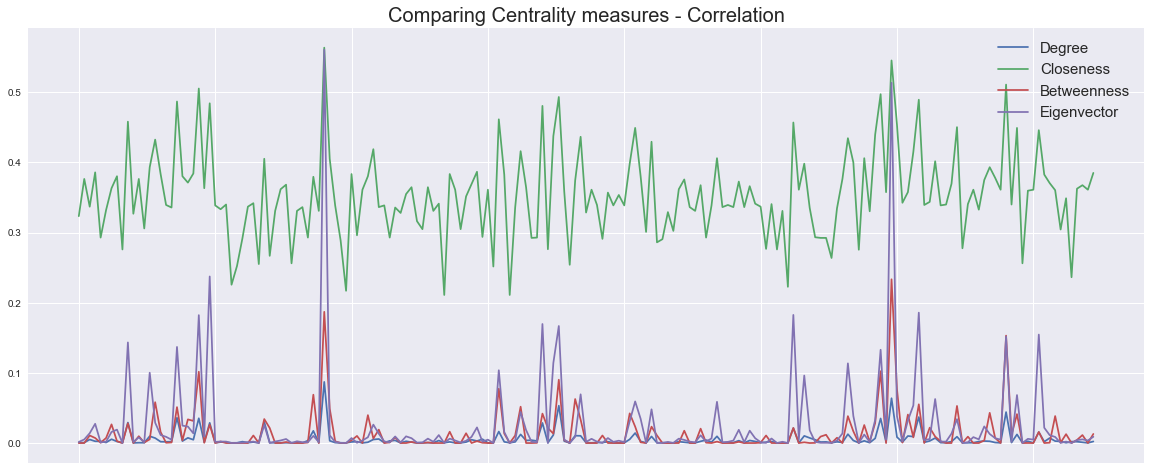
- Calculate correlation matrix and visualize the results for all characters
- Comment on the results
# Create a dataframe with 4 centrality measures, for all characters.dataframe tbody tr th {
vertical-align: top;
}
.dataframe thead th {
text-align: right;
}
| Degree | Closeness | Betweenness | Eigenvector | |
|---|---|---|---|---|
| Addam-Marbrand | 0.000611 | 0.323478 | 0.000000 | 0.001551 |
| Aegon-I-Targaryen | 0.000611 | 0.376518 | 0.000000 | 0.005096 |
| Aemon-Targaryen-(Maester-Aemon) | 0.005023 | 0.336957 | 0.010753 | 0.013992 |
| Aerys-II-Targaryen | 0.002512 | 0.385892 | 0.007183 | 0.027406 |
| Aggo | 0.002444 | 0.292913 | 0.000450 | 0.000852 |
| Albett | 0.000747 | 0.332143 | 0.007169 | 0.001875 |
| Alliser-Thorne | 0.005430 | 0.363281 | 0.026584 | 0.015771 |
| Alyn | 0.002172 | 0.380368 | 0.002693 | 0.019102 |
| Arthur-Dayne | 0.000272 | 0.275964 | 0.000000 | 0.000071 |
| Arya-Stark | 0.029188 | 0.458128 | 0.028114 | 0.143378 |
# plot the measures as lines to see if they correlate# calculate Correlation matrix.dataframe tbody tr th {
vertical-align: top;
}
.dataframe thead th {
text-align: right;
}
| Degree | Closeness | Betweenness | Eigenvector | |
|---|---|---|---|---|
| Degree | 1.000000 | 0.713617 | 0.857222 | 0.922520 |
| Closeness | 0.713617 | 1.000000 | 0.675276 | 0.697500 |
| Betweenness | 0.857222 | 0.675276 | 1.000000 | 0.805318 |
| Eigenvector | 0.922520 | 0.697500 | 0.805318 | 1.000000 |
# Your observations here
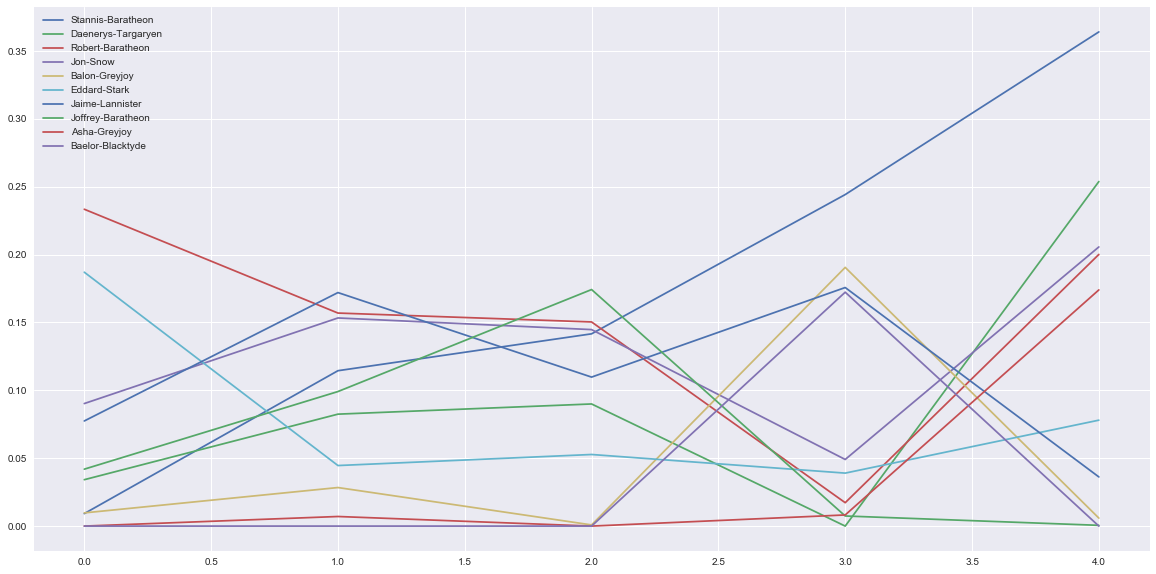
By Studying the change in centrality throughout the series, we can create an evolution of characters as the story progresses.
- Calculate the weighted degree centrality for all five books (edge lists), and save your results in a dataframe
Hint: Fill nans with zero for values that can not be calculated due to being extremely small
# Create a character evolution dataframe based on weighted degree centrality from all books


# Fill Nans and view contents.dataframe tbody tr th {
vertical-align: top;
}
.dataframe thead th {
text-align: right;
}
| Addam-Marbrand | Aegon-Frey-(son-of-Stevron) | Aegon-I-Targaryen | Aegon-Targaryen-(son-of-Rhaegar) | Aegon-V-Targaryen | Aemon-Targaryen-(Dragonknight) | Aemon-Targaryen-(Maester-Aemon) | Aenys-Frey | Aeron-Greyjoy | Aerys-I-Targaryen | ... | Yellow-Dick | Yezzan-zo-Qaggaz | Ygritte | Yohn-Royce | Yoren | Yorko-Terys | Ysilla | Yurkhaz-zo-Yunzak | Zei | Zollo | |
|---|---|---|---|---|---|---|---|---|---|---|---|---|---|---|---|---|---|---|---|---|---|
| 0 | 0.000611 | 0.000000 | 0.000611 | 0.000000 | 0.000000 | 0.000000 | 0.005023 | 0.000000 | 0.000000 | 0.000000 | ... | 0.000000 | 0.000000 | 0.000000 | 0.000000 | 0.00224 | 0.000000 | 0.000000 | 0.00000 | 0.000000 | 0.000000 |
| 1 | 0.000000 | 0.000000 | 0.001336 | 0.000000 | 0.000236 | 0.000000 | 0.002673 | 0.000472 | 0.001730 | 0.000236 | ... | 0.000000 | 0.000000 | 0.001887 | 0.000000 | 0.00684 | 0.000000 | 0.000000 | 0.00000 | 0.000000 | 0.000000 |
| 2 | 0.001711 | 0.001062 | 0.000649 | 0.000177 | 0.000000 | 0.000177 | 0.009083 | 0.000000 | 0.000000 | 0.000000 | ... | 0.000000 | 0.000000 | 0.007314 | 0.000177 | 0.00000 | 0.000000 | 0.000000 | 0.00000 | 0.000177 | 0.000472 |
| 3 | 0.001908 | 0.000000 | 0.000000 | 0.000318 | 0.000318 | 0.000000 | 0.009752 | 0.000000 | 0.012932 | 0.000000 | ... | 0.000000 | 0.000000 | 0.000000 | 0.003922 | 0.00000 | 0.000636 | 0.000000 | 0.00000 | 0.000000 | 0.000636 |
| 4 | 0.000000 | 0.000000 | 0.000350 | 0.011386 | 0.000000 | 0.000000 | 0.003591 | 0.001139 | 0.000613 | 0.000000 | ... | 0.001314 | 0.004204 | 0.001489 | 0.000000 | 0.00000 | 0.000000 | 0.004029 | 0.00035 | 0.000000 | 0.000000 |
5 rows × 796 columns
- Identify top 10 characters i.e. having 10 highest degree centrality values, from
evol_degree_dfand create a new dataframe with their names and centrality value
Eddard-Stark          0.087157
Cersei-Lannister      0.082998
Jon-Snow              0.066649
Tyrion-Lannister      0.065173
Robert-Baratheon      0.063875
Daenerys-Targaryen    0.063146
Jaime-Lannister       0.059148
Joffrey-Baratheon     0.049450
Bran-Stark            0.038208
Sansa-Stark           0.036994
dtype: float64
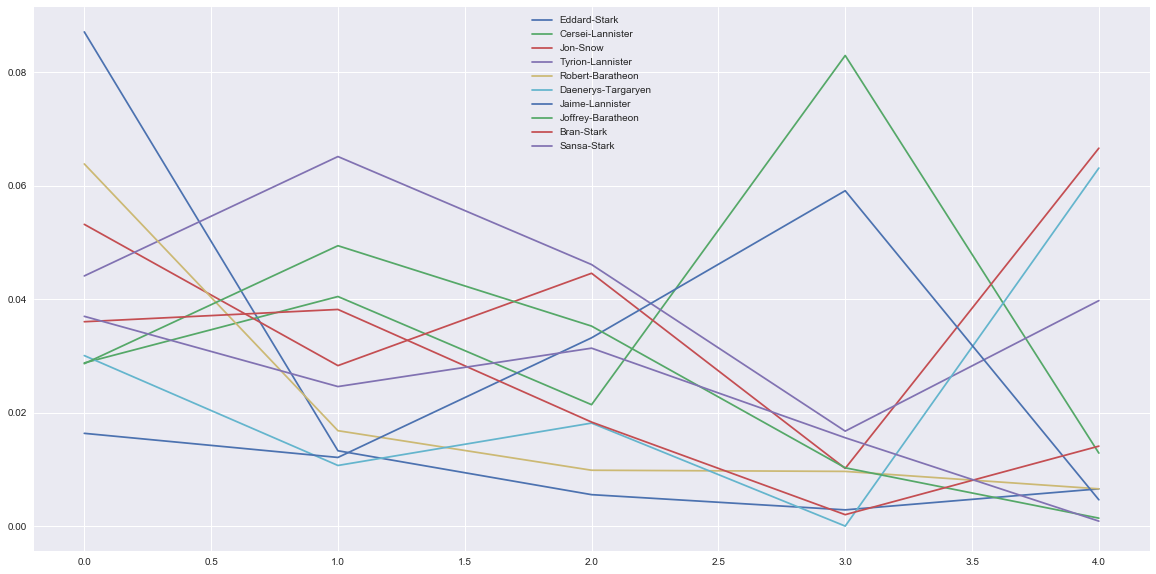
- Plot the evolution of weighted degree centrality of the above characters over the 5 books
- Comment on your answer
# Your observations here
# Record Your observations here - Use the techniques seen so far to visualize and customize the graphs
- Study the shapes of the graphs in terms of spread , clusters etc and see if you can identify any links to the actual books (or the TV series)
In this lab, we looked at different centrality measures of the graph data for the ASIOF dataset. We also compared these measures to see how they correlate with each other. We also saw in practice, the difference between taking the weighted centrality measures and how it may effect the results.


