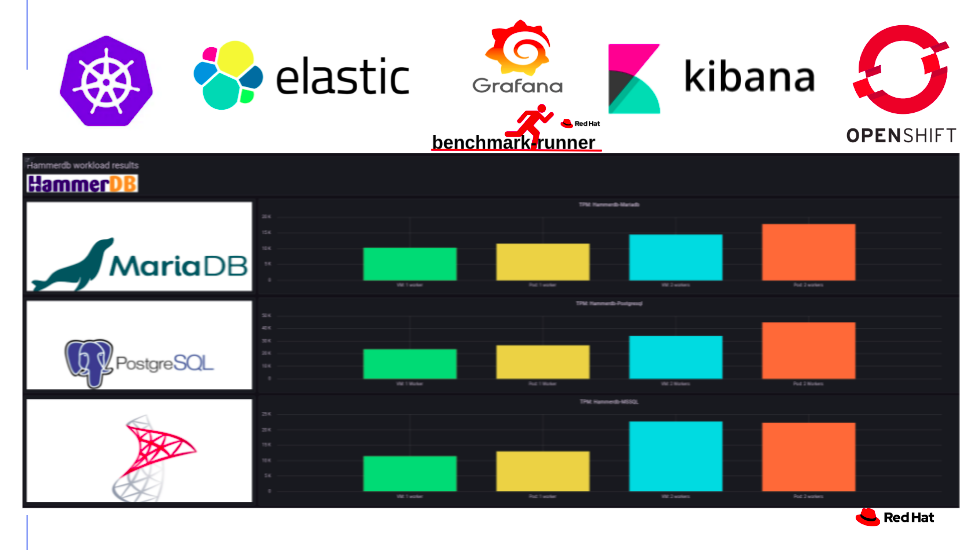
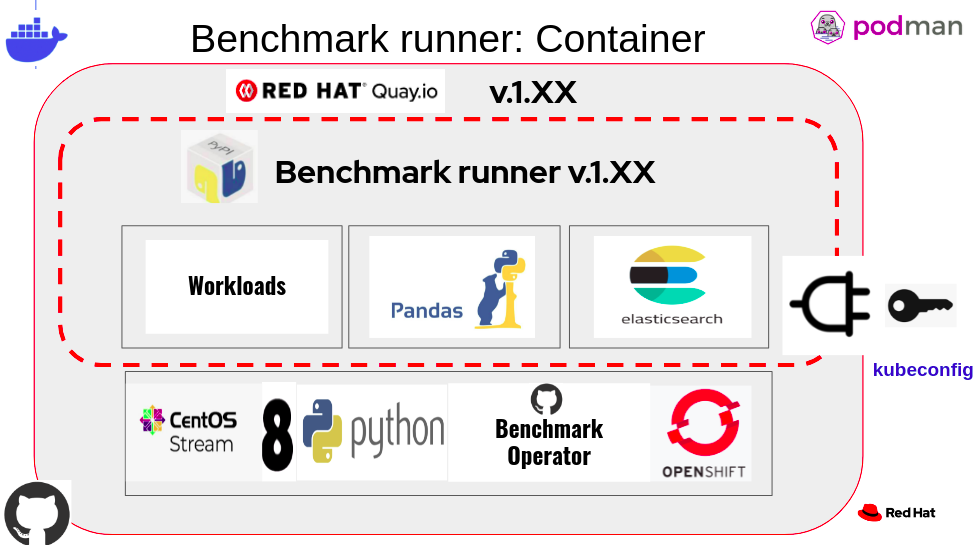
This tool provides a lightweight and flexible framework for running benchmark workloads on Kubernetes/OpenShift Pod or VM.
This tool support the following workloads:
- hammerdb: running hammerdb workload on the following databases: MSSQL, Mariadb, Postgresql on Pod and VM with Configuration
- stressng: running stressng workload on Pod or VM with Configuration
- uperf: running uperf workload on Pod or VM with Configuration
- vdbench: running vdbench workload in a pod with Configuration
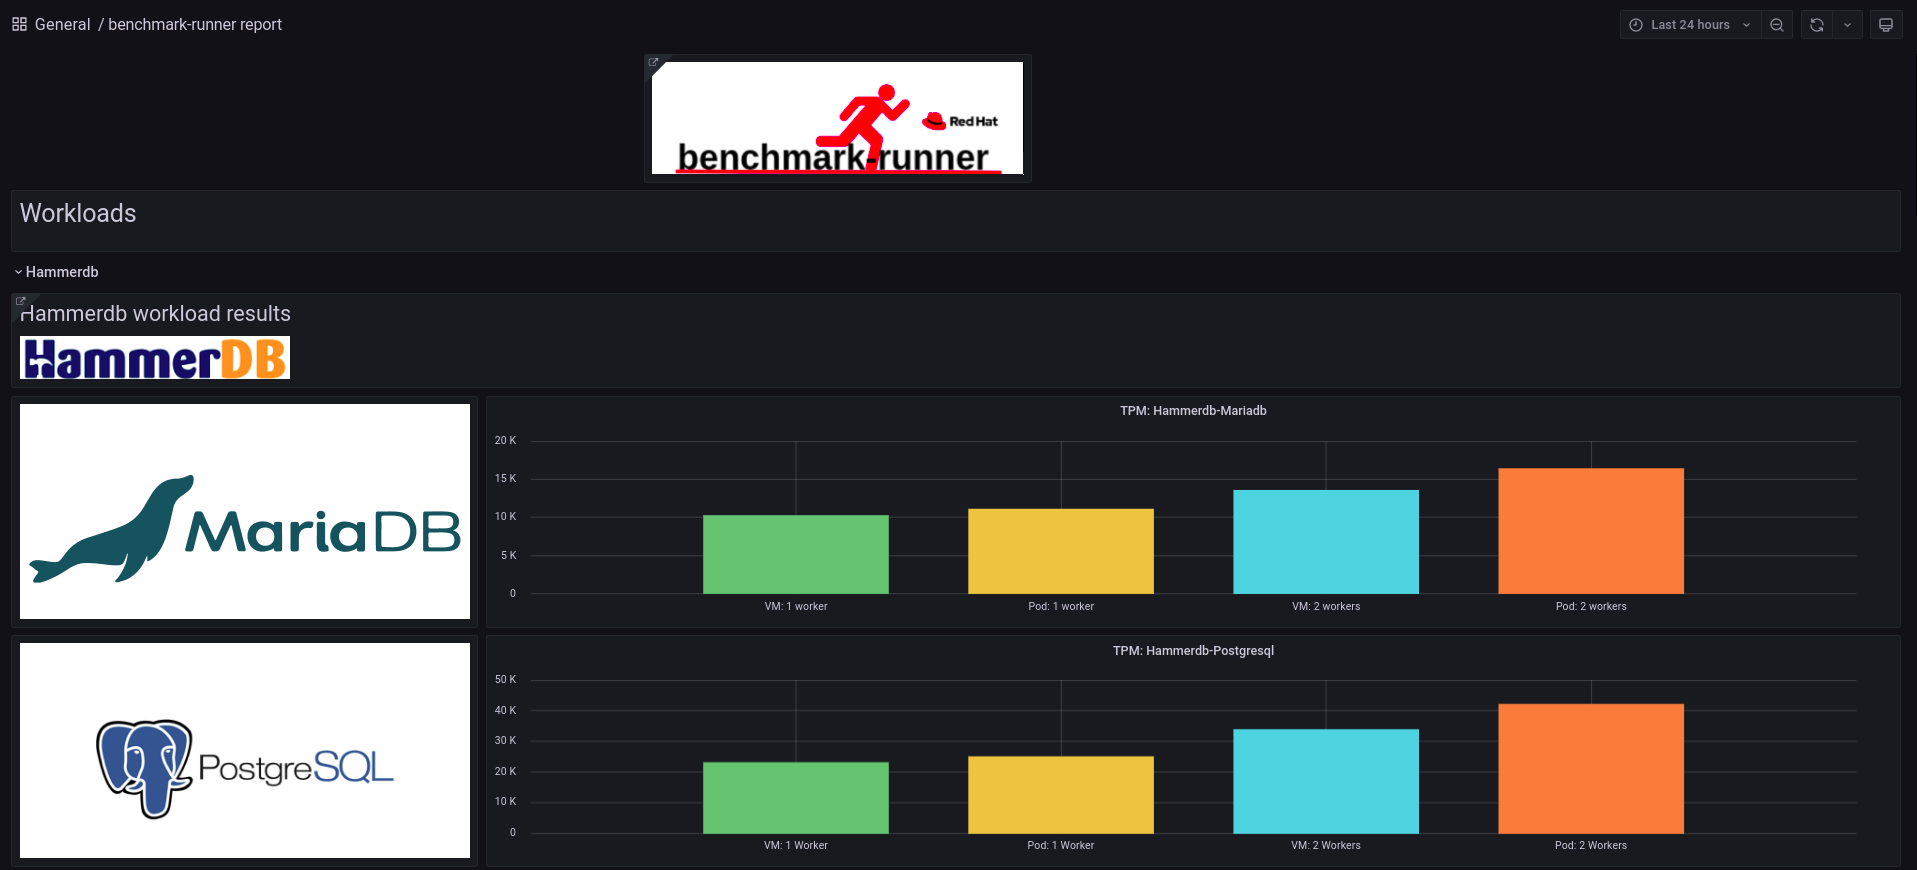
Benchmark-runner grafana dashboard example:

Reference:
- The benchmark-runner package is located in PyPi
- The benchmark-runner container image is located in Quay.io
Documentation is available at benchmark-runner.readthedocs.io
Table of Contents
mandatory: WORKLOAD=$WORKLOAD
Choose one from the following list:
['stressng_pod', 'stressng_vm', 'stressng_kata','uperf_pod', 'uperf_vm', 'uperf_kata', 'hammerdb_pod_mariadb', 'hammerdb_pod_mssql', 'hammerdb_pod_postgres', 'hammerdb_vm_mariadb', 'hammerdb_vm_mssql', 'hammerdb_vm_postgres', 'hammerdb_kata_mariadb', 'hammerdb_kata_mssql', 'hammerdb_kata_postgres', 'vdbench_pod', 'vdbench_kata', 'vdbench_vm']
auto: NAMESPACE=benchmark-operator [ The default namespace is benchmark-operator ]
auto: OCS_PVC=True [ True=OCS PVC storage, False=Ephemeral storage, default True ]
auto: EXTRACT_PROMETHEUS_SNAPSHOT=True [ True=extract Prometheus snapshot into artifacts, false=don't, default True ]
auto: SYSTEM_METRICS=True [ True=collect metric, False=not collect metrics, default True ]
auto: RUNNER_PATH=/tmp [ The default work space is /tmp ]
optional: KUBEADMIN_PASSWORD=$KUBEADMIN_PASSWORD
optional: PIN_NODE_BENCHMARK_OPERATOR=$PIN_NODE_BENCHMARK_OPERATOR [node selector for benchmark operator pod]
optional: PIN_NODE1=$PIN_NODE1 [node1 selector for running the workload]
optional: PIN_NODE2=$PIN_NODE2 [node2 selector for running the workload, i.e. uperf server and client, hammerdb database and workload]
optional: ELASTICSEARCH=$ELASTICSEARCH [ elasticsearch service name]
optional: ELASTICSEARCH_PORT=$ELASTICSEARCH_PORT
podman run --rm -e WORKLOAD=$WORKLOAD -e KUBEADMIN_PASSWORD=$KUBEADMIN_PASSWORD -e PIN_NODE_BENCHMARK_OPERATOR=$PIN_NODE_BENCHMARK_OPERATOR -e PIN_NODE1=$PIN_NODE1 -e PIN_NODE2=$PIN_NODE2 -e ELASTICSEARCH=$ELASTICSEARCH -e ELASTICSEARCH_PORT=$ELASTICSEARCH_PORT -e log_level=INFO -v $KUBECONFIG:/root/.kube/config --privileged quay.io/ebattat/benchmark-runner:latest[TBD]
There are 3 grafana dashboards templates:
** After importing json in grafana, you need to configure elasticsearch data source. (for more details: see HOW_TO.md)
The CI jobs store snapshots of the Prometheus database for each run as part of the artifacts. Within the artifact directory is a Prometheus snapshot directory named:
promdb-YYYY_MM_DDTHH_mm_ss+0000_YYYY_MM_DDTHH_mm_ss+0000.tar
The timestamps are for the start and end of the metrics capture; they
are stored in UTC time (+0000). It is possible to run containerized
Prometheus on it to inspect the metrics. Note that Prometheus
requires write access to its database, so it will actually write to
the snapshot. So for example if you have downloaded artifacts for a
run named hammerdb-vm-mariadb-2022-01-04-08-21-23 and the Prometheus
snapshot within is named
promdb_2022_01_04T08_21_52+0000_2022_01_04T08_45_47+0000, you could run as follows:
$ local_prometheus_snapshot=/hammerdb-vm-mariadb-2022-01-04-08-21-23/promdb_2022_01_04T08_21_52+0000_2022_01_04T08_45_47+0000
$ chmod -R g-s,a+rw "$local_prometheus_snapshot"
$ sudo podman run --rm -p 9090:9090 -uroot -v "$local_prometheus_snapshot:/prometheus" --privileged prom/prometheus --config.file=/etc/prometheus/prometheus.yml --storage.tsdb.path=/prometheus --storage.tsdb.retention.time=100000d --storage.tsdb.retention.size=1000PB
and point your browser at port 9090 on your local system, you can run queries against it, e. g.
sum(irate(node_cpu_seconds_total[2m])) by (mode,instance) > 0
It is important to use the --storage.tsdb.retention.time option to
Prometheus, as otherwise Prometheus may discard the data in the
snapshot. And note that you must set the time bounds on the
Prometheus query to fit the start and end times as recorded in the
name of the promdb snapshot.
see HOW_TO.md


