CountSpores is a customized analysis pipeline to estimate spore growth over time for different conditions, taking technical and biological replicates into account.
Install from GitHub with:
# install.packages("devtools")
devtools::install_github("kreutz-lab/CountSpores")This is an example on how to use CountSpores, introducing
CountSpores’s functions and giving an overview on the output.
To reproduce this example analysis, download the example.xlsx file:
https://github.com/kreutz-lab/CountSpores/blob/master/exampleData/example.xlsx
library(CountSpores)The following line needs to be provided by the user
file: Path to the raw data file
file = "exampleData/example.xlsx"First 3 columns need to correspond to: ‘Condition’, ‘Plate’,‘Day’
Counts per segment should be followed by totals per segment and in
same order
knitr::kable(head(read.xlsx(file, sheet='Exp_1'),15))| Condition | Plate | Day | Area1 | Area2 | Area3 | Area1_total | Area2_total | Area3_total |
|---|---|---|---|---|---|---|---|---|
| WT | A | 1 | 0 | 0 | 0 | 1412 | 1151 | 1181 |
| WT | A | 2 | 127 | 107 | 120 | 1412 | 1151 | 1181 |
| WT | A | 3 | 214 | 175 | 187 | 1412 | 1151 | 1181 |
| WT | A | 4 | 1324 | 1084 | 1144 | 1412 | 1151 | 1181 |
| WT | A | 5 | 1332 | 1091 | 1153 | 1412 | 1151 | 1181 |
| WT | A | 6 | 1342 | 1099 | 1159 | 1412 | 1151 | 1181 |
| WT | A | 7 | 1412 | 1151 | 1181 | 1412 | 1151 | 1181 |
| WT | B | 1 | 0 | 0 | 0 | 644 | 602 | 578 |
| WT | B | 2 | 139 | 134 | 123 | 644 | 602 | 578 |
| WT | B | 3 | 429 | 393 | 378 | 644 | 602 | 578 |
| WT | B | 4 | 535 | 512 | 489 | 644 | 602 | 578 |
| WT | B | 5 | 589 | 542 | 525 | 644 | 602 | 578 |
| WT | B | 6 | 619 | 584 | 573 | 644 | 602 | 578 |
| WT | B | 7 | 644 | 602 | 578 | 644 | 602 | 578 |
| WT | C | 1 | 0 | 0 | 0 | 762 | 666 | 636 |
ReadData(file="exampleData/example.xlsx")ReadData first creates one directory for each experiment (sheet in
excel file)
Then ReadData reads in the raw data, converts columns to factors for
analysis and calculates the corresponding proportions for each segment
on the plate. Additionally mean, sd and se are calculated for QC plots.
This new data file is saved as ‘data_proportional.xlsx’ in the
‘Data_analysis’ directory, created by ReadData.
To apply LME-Model ReadData converts the data frame in long format
‘data_prop_long.xlsx’, which is also saved in Data_analysis
directory.
ReadData returns a list with data_proportional & data_prop_long
data_proportional:
# Call directly in R
# ReadData_out$Exp_1$data_proportional
# Or look at excel file
knitr::kable(head(read.xlsx('Data_analysis/data_proportional.xlsx',sheet='Exp_1')))| Condition | Plate | Day | Area1 | Area2 | Area3 | Area1_total | Area2_total | Area3_total | Prop_1 | Prop_2 | Prop_3 | Mean | sd | se | plot_ID |
|---|---|---|---|---|---|---|---|---|---|---|---|---|---|---|---|
| WT | A | 1 | 0 | 0 | 0 | 1412 | 1151 | 1181 | 0.000000 | 0.000000 | 0.00000 | 0.000000 | 0.0000000 | 0.0000000 | WTA |
| WT | A | 2 | 127 | 107 | 120 | 1412 | 1151 | 1181 | 8.994334 | 9.296264 | 10.16088 | 9.483826 | 0.6054686 | 0.3495675 | WTA |
| WT | A | 3 | 214 | 175 | 187 | 1412 | 1151 | 1181 | 15.155807 | 15.204170 | 15.83404 | 15.398006 | 0.3783895 | 0.2184633 | WTA |
| WT | A | 4 | 1324 | 1084 | 1144 | 1412 | 1151 | 1181 | 93.767705 | 94.178975 | 96.86706 | 94.937914 | 1.6832986 | 0.9718529 | WTA |
| WT | A | 5 | 1332 | 1091 | 1153 | 1412 | 1151 | 1181 | 94.334278 | 94.787142 | 97.62913 | 95.583516 | 1.7859642 | 1.0311269 | WTA |
| WT | A | 6 | 1342 | 1099 | 1159 | 1412 | 1151 | 1181 | 95.042493 | 95.482189 | 98.13717 | 96.220618 | 1.6742811 | 0.9666466 | WTA |
data_prop_long
# Call directly in R
# ReadData_out$Exp_1$data_prop_long
# Or look at excel file
knitr::kable(head(read.xlsx('Data_analysis/data_prop_long.xlsx',sheet='Exp_1')))| Condition | Plate | Day | Segment | Proportion | isWT | isKO_1 | isAnother_KO | isOverexpression | isAnotherPertubation |
|---|---|---|---|---|---|---|---|---|---|
| WT | A | 1 | Prop_1 | 0.000000 | 1 | 0 | 0 | 0 | 0 |
| WT | A | 2 | Prop_1 | 8.994334 | 1 | 0 | 0 | 0 | 0 |
| WT | A | 3 | Prop_1 | 15.155807 | 1 | 0 | 0 | 0 | 0 |
| WT | A | 4 | Prop_1 | 93.767705 | 1 | 0 | 0 | 0 | 0 |
| WT | A | 5 | Prop_1 | 94.334278 | 1 | 0 | 0 | 0 | 0 |
| WT | A | 6 | Prop_1 | 95.042493 | 1 | 0 | 0 | 0 | 0 |
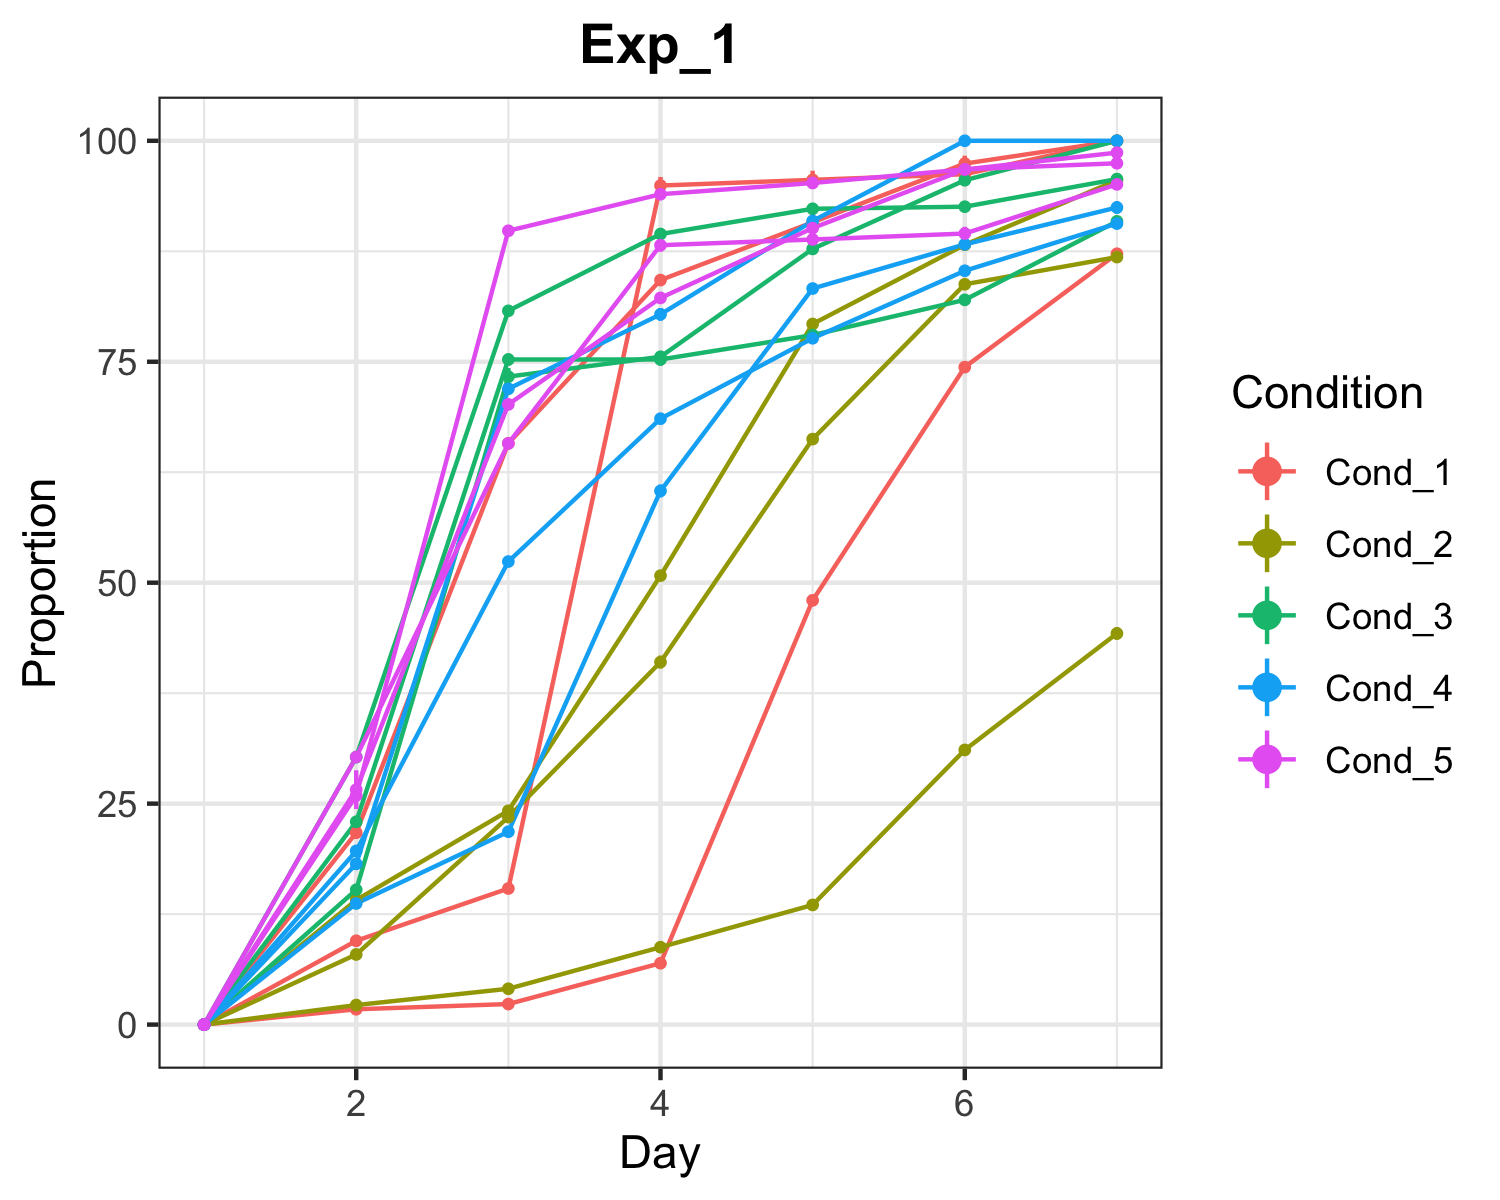
Saves one png file for each experiment, plotting the raw data (mean proportion & se) for each plate & condition over time.
plotTimeCourse(file='Data_analysis/data_proportional.xlsx')Output for ‘Exp_1’ experiment:
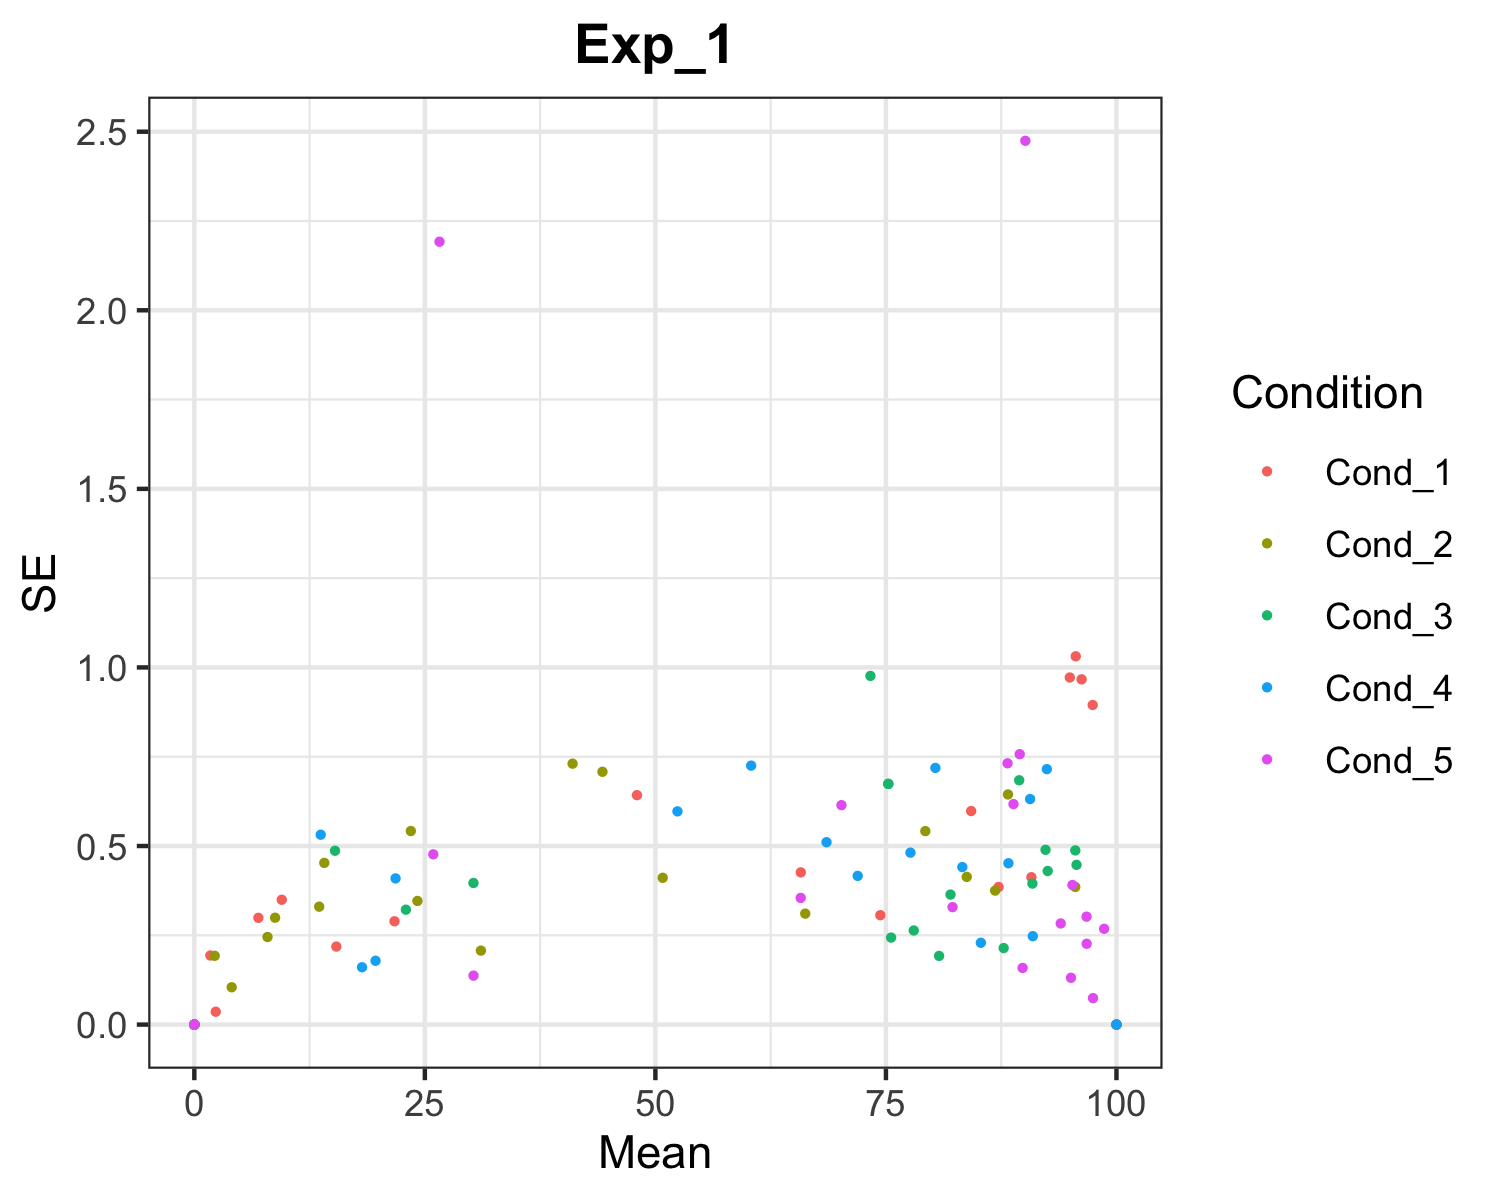
Saves one png file for each experiment, plotting the raw data (se over mean proportion) for each condition.
plotMeanSE(file='Data_analysis/data_proportional.xlsx')Output for ‘Exp_1’ experiment:
Applies lme-models and runs ANOVA for each experiment separately and
returns results.
results.txt: Complete collection lme-model & ANOVA results
summary_results.xlsx: Summarized results for lme-model and ANOVA
runANOVA_out = runANOVA(file='Data_analysis/data_prop_long.xlsx')results.txt for ‘Exp_1’ experiment:
cat(readLines('Exp_1/results.txt',80), sep='\n')
*** Results for Exp_1  ***


------------------------------------
 *** Take WT as intercept ***

Linear mixed model fit by REML. t-tests use Satterthwaite's method [
lmerModLmerTest]
Formula: formula
   Data: dat1

REML criterion at convergence: 2181.1

Scaled residuals:
    Min      1Q  Median      3Q     Max
-3.7937 -0.4488 -0.0003  0.4500  2.9782

Random effects:
 Groups                     Name        Variance Std.Dev.
 Plate:isKO_1               (Intercept) 367.76   19.177
 Plate:isAnother_KO         (Intercept) 206.13   14.357
 Plate:isOverexpression     (Intercept) 170.71   13.065
 Plate:isAnotherPertubation (Intercept) 138.68   11.776
 Residual                                91.23    9.551
Number of obs: 315, groups:
Plate:isKO_1, 6; Plate:isAnother_KO, 6; Plate:isOverexpression, 6; Plate:isAnotherPertubation, 6

Fixed effects:
                             Estimate Std. Error         df t value Pr(>|t|)
(Intercept)                -2.026e-12  1.745e+01  8.629e+00   0.000   1.0000
Day2                        1.098e+01  4.503e+00  2.691e+02   2.438   0.0154
Day3                        2.783e+01  4.503e+00  2.691e+02   6.181 2.35e-09
Day4                        6.204e+01  4.503e+00  2.691e+02  13.779  < 2e-16
Day5                        7.812e+01  4.503e+00  2.691e+02  17.350  < 2e-16
Day6                        8.934e+01  4.503e+00  2.691e+02  19.843  < 2e-16
Day7                        9.574e+01  4.503e+00  2.691e+02  21.263  < 2e-16
Day1:isKO_11                2.178e-12  1.629e+01  2.700e+00   0.000   1.0000
Day2:isKO_11               -2.896e+00  1.629e+01  2.700e+00  -0.178   0.8714
Day3:isKO_11               -1.059e+01  1.629e+01  2.700e+00  -0.650   0.5668
Day4:isKO_11               -2.852e+01  1.629e+01  2.700e+00  -1.750   0.1884
Day5:isKO_11               -2.510e+01  1.629e+01  2.700e+00  -1.541   0.2309
Day6:isKO_11               -2.165e+01  1.629e+01  2.700e+00  -1.329   0.2850
Day7:isKO_11               -2.019e+01  1.629e+01  2.700e+00  -1.239   0.3120
Day1:isAnother_KO1         -3.305e-13  1.256e+01  2.682e+00   0.000   1.0000
Day2:isAnother_KO1          1.185e+01  1.256e+01  2.682e+00   0.944   0.4224
Day3:isAnother_KO1          4.862e+01  1.256e+01  2.682e+00   3.871   0.0372
Day4:isAnother_KO1          1.805e+01  1.256e+01  2.682e+00   1.437   0.2563
Day5:isAnother_KO1          7.910e+00  1.256e+01  2.682e+00   0.630   0.5783
Day6:isAnother_KO1          6.829e-01  1.256e+01  2.682e+00   0.054   0.9604
Day7:isAnother_KO1         -2.212e-01  1.256e+01  2.682e+00  -0.018   0.9872
Day1:isOverexpression1     -3.339e-12  1.158e+01  2.762e+00   0.000   1.0000
Day2:isOverexpression1      6.205e+00  1.158e+01  2.762e+00   0.536   0.6322
Day3:isOverexpression1      2.089e+01  1.158e+01  2.762e+00   1.804   0.1769
Day4:isOverexpression1      7.726e+00  1.158e+01  2.762e+00   0.667   0.5561
Day5:isOverexpression1      5.836e+00  1.158e+01  2.762e+00   0.504   0.6517
Day6:isOverexpression1      1.847e+00  1.158e+01  2.762e+00   0.160   0.8842
Day7:isOverexpression1     -1.377e+00  1.158e+01  2.762e+00  -0.119   0.9135
Day1:isAnotherPertubation1  2.613e-12  1.062e+01  2.885e+00   0.000   1.0000
Day2:isAnotherPertubation1  1.662e+01  1.062e+01  2.885e+00   1.565   0.2191
Day3:isAnotherPertubation1  4.742e+01  1.062e+01  2.885e+00   4.466   0.0227
Day4:isAnotherPertubation1  2.608e+01  1.062e+01  2.885e+00   2.456   0.0946
Day5:isAnotherPertubation1  1.327e+01  1.062e+01  2.885e+00   1.250   0.3030
Day6:isAnotherPertubation1  4.999e+00  1.062e+01  2.885e+00   0.471   0.6711
Day7:isAnotherPertubation1  1.323e+00  1.062e+01  2.885e+00   0.125   0.9090

(Intercept)
Day2                       *
Day3                       ***
Day4                       ***
Day5                       ***
Day6                       ***
Day7                       ***
Day1:isKO_11
Day2:isKO_11
Day3:isKO_11
Day4:isKO_11
Day5:isKO_11
Day6:isKO_11
Day7:isKO_11
Time specific effects on the proportion of sprouted spores in each condition - again for ‘Exp_1’ experiment:
time_effects = read.xlsx('Exp_1/summary_results.xlsx', sheet='LME-Model_by_time')
options(knitr.kable.NA='')
knitr::kable(head(time_effects, 20))| Analyzing.data.in.sheet.Exp_1 | X2 | X3 | X4 | X5 | X6 |
|---|---|---|---|---|---|
| Testing the difference for time point 2 | |||||
| Estimated difference: | |||||
| isWT | isKO_1 | isAnother_KO | isOverexpression | isAnotherPertubation | |
| isWT | -2.89595810011486 | 11.8487025238306 | 6.20467496490041 | 16.616159170928 | |
| isKO_1 | 2.89595810011486 | 14.7446606239483 | 9.10063306501412 | 19.5121172710429 | |
| isAnother_KO | -11.8487025238306 | -14.7446606239483 | -5.64402755893068 | 4.76745664709639 | |
| isOverexpression | -6.20467496490041 | -9.10063306501412 | 5.64402755893068 | 10.4114842060269 | |
| isAnotherPertubation | -16.616159170928 | -19.5121172710429 | -4.76745664709639 | -10.4114842060269 | |
| Standard Error (SE): | |||||
| isWT | isKO_1 | isAnother_KO | isOverexpression | isAnotherPertubation | |
| isWT | 16.4938590541659 | 12.0960766985828 | 11.4297842755544 | 10.6429948767195 | |
| isKO_1 | 16.4938590541659 | 10.102460410223 | 14.66409790197 | 12.7601233892883 | |
| isAnother_KO | 12.0960766985828 | 10.102460410223 | 6.63574074656223 | 5.62230511730436 | |
| isOverexpression | 11.4297842755544 | 14.66409790197 | 6.63574074656223 | 4.85736147962564 | |
| isAnotherPertubation | 10.6429948767195 | 12.7601233892883 | 5.62230511730436 | 4.85736147962564 | |
| p-values: | |||||
| isWT | isKO_1 | isAnother_KO | isOverexpression | isAnotherPertubation | |
| isWT | 0.873550999672821 | 0.395386663028195 | 0.625561707433728 | 0.210762746574646 | |
| isKO_1 | 0.873550999672821 | 0.232789638858788 | 0.581037130784588 | 0.223954666420815 | |
| isAnother_KO | 0.395386663028195 | 0.232789638858788 | 0.428535316583462 | 0.415438706938855 |
ANOVA summary for effect on all time points - again for ‘Exp_1’ experiment:
overall_effects = read.xlsx('Exp_1/summary_results.xlsx', sheet='ANOVA_summary')
options(knitr.kable.NA='')
knitr::kable(overall_effects)| Analyzing.data.in.sheet.Exp_1 | X2 | X3 | X4 | X5 | X6 |
|---|---|---|---|---|---|
| Testing for an impact on ALL time points: | |||||
| p-values for ANOVA: | |||||
| isWT | isKO_1 | isAnother_KO | isOverexpression | isAnotherPertubation | |
| isWT | 0.0708549809347601 | 0.00590600898754365 | 0.2347806018252 | 0.013820035067322 | |
| isKO_1 | 0.0708549809347601 | 0.0070213685040417 | 0.0305273702127073 | 0.00381346810869255 | |
| isAnother_KO | 0.00590600898754365 | 0.0070213685040417 | 0.140213408592498 | 0.762826996428617 | |
| isOverexpression | 0.2347806018252 | 0.0305273702127073 | 0.140213408592498 | 0.119258429134139 | |
| isAnotherPertubation | 0.013820035067322 | 0.00381346810869255 | 0.762826996428617 | 0.119258429134139 |
library(CountSpores)

file = "exampleData/example.xlsx"

example_result = runCountSpores(file)
#> Identified experiments:  Exp_1 Exp_2 Exp_3
All results from CountSpores pipeline are now saved in result folders
as described above.
For further downstream analysis in R, data for analysis and results
from lme-model and ANOVA (stored all together in results.txt) can be
accessed like this:
Access data_prop_long for Exp_1 experiment
knitr::kable(head(example_result$ReadData_out$Exp_1$data_prop_long))| Condition | Plate | Day | Segment | Proportion | isWT | isKO_1 | isAnother_KO | isOverexpression | isAnotherPertubation |
|---|---|---|---|---|---|---|---|---|---|
| WT | A | 1 | Prop_1 | 0.000000 | 1 | 0 | 0 | 0 | 0 |
| WT | A | 2 | Prop_1 | 8.994334 | 1 | 0 | 0 | 0 | 0 |
| WT | A | 3 | Prop_1 | 15.155807 | 1 | 0 | 0 | 0 | 0 |
| WT | A | 4 | Prop_1 | 93.767705 | 1 | 0 | 0 | 0 | 0 |
| WT | A | 5 | Prop_1 | 94.334278 | 1 | 0 | 0 | 0 | 0 |
| WT | A | 6 | Prop_1 | 95.042493 | 1 | 0 | 0 | 0 | 0 |
Access result from linear mixed effects model for Exp_1 experiment and ‘Cond_1’ as reference level
example_result$runANOVA_out$Exp_1$lme$`Cond_1`
#> NULL
Access result from ANOVA for Exp_1 experiment and ‘Cond_1’ as reference level
example_result$runANOVA_out$Exp_1$anova$`Cond_1`
#> NULL
