A Check_MK plugin for checking the status of a galera cluster (based on https://galeracluster.com/library/documentation/monitoring-cluster.html)
The check parases the mysql output of the standard check_mk_agent for the presence of specific wsrep variables and status lines.
It will provide three single checks with WATO integration:
License: GPLv2
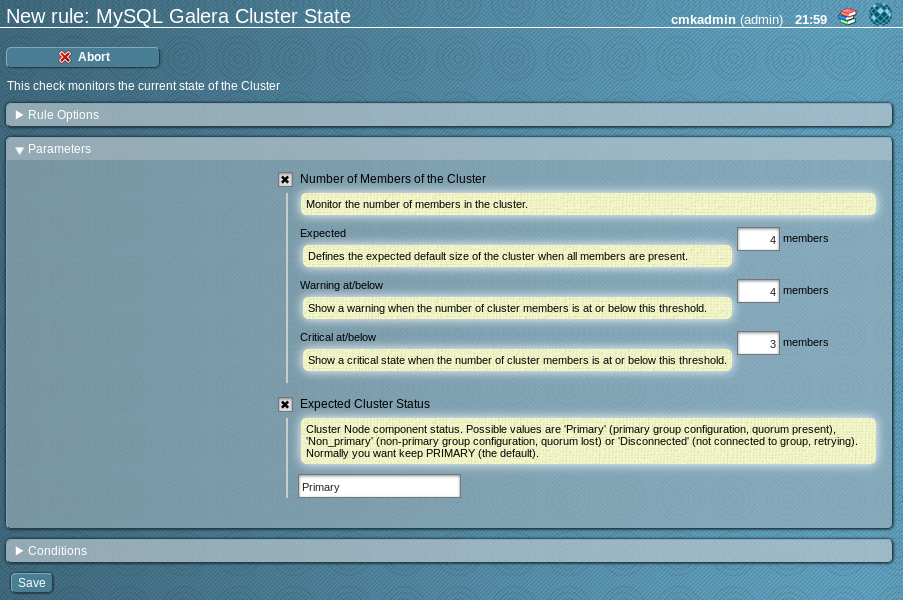
The check shows information about the general Cluster state:
Size- The current size of the cluster and the expected size configured in WATOStatus- The current status of the clusterConfID- Show the number of Cluster Changes and should be the same for all Cluster Nodes.Cluster UUID- shows the current UUID and should be the same for all Members of the Cluster
In the WATO you have the possibility to define:
Number of Members of the Cluster
expected- the number of nodes the cluster normaly haswarning threshold- a warning alert will be thrown when the number of members is below this numbercritical threshold- - a cirtical alert will be thrown when the number of members is below this number
Expected Cluster Status
- Defines the status of the node. This defaults to "Primary" and it normaly doesn't make sense to change this. Any value other than primary will indicate problems with the cluster.
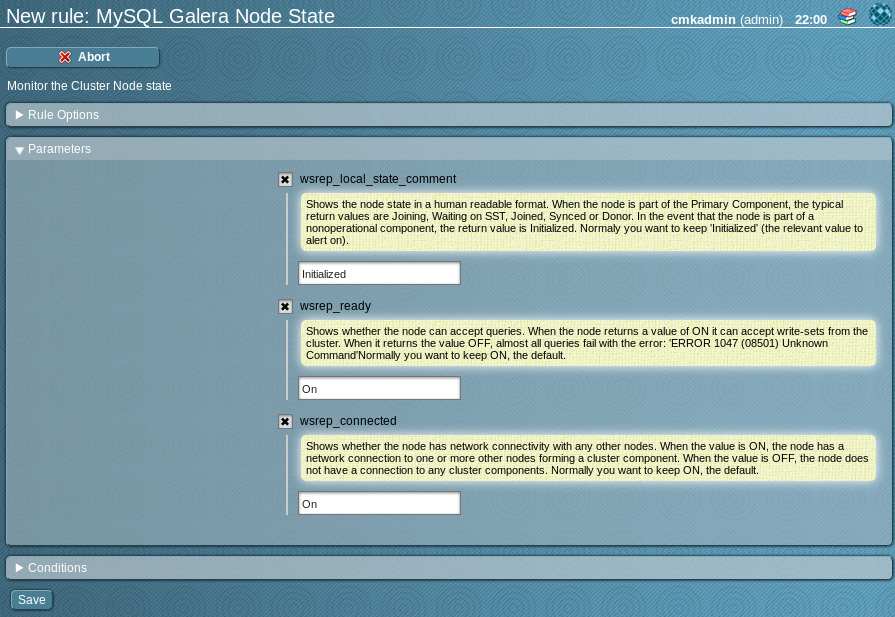
The check shows information about the node state:
Ready- shows if the node is ready for accept write-sets from the clusterConnected- shows if the node has network connectivity with any other nodes.State- shows if the node is a operational part of the cluster
In the WATO you have the possibility to define:
wsrep_local_state_comment
- Shows the node state in a human readable format. When the node is part of the Primary Component, the typical return values are Joining, Waiting on SST, Joined, Synced or Donor. In the event that the node is part of a nonoperational component, the return value is Initialized. Normaly you want to keep 'Initialized' (the relevant value to alert on).
wsrep_ready
- Shows whether the node can accept queries. When the node returns a value of ON it can accept write-sets from the cluster. When it returns the value OFF, almost all queries fail with the error: 'ERROR 1047 (08501) Unknown Command'Normally you want to keep ON, the default.
wsrep_connected
- Shows whether the node has network connectivity with any other nodes. When the value is ON, the node has a network connection to one or more other nodes forming a cluster component. When the value is OFF, the node does not have a connection to any cluster components. Normally you want to keep ON, the default.
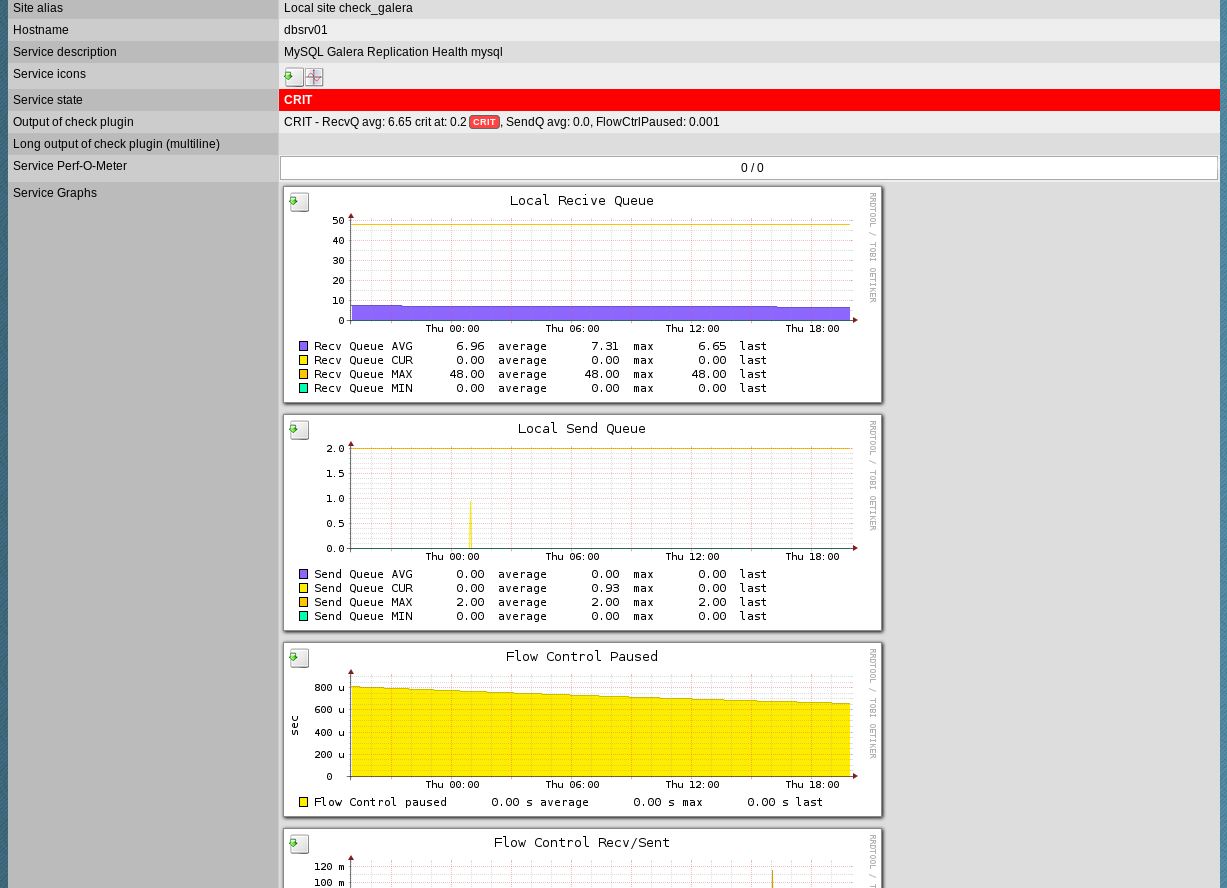
The check shows information about the performance of the cluster node member and can give hints to identify performance problems.
The check shows information about the replication performance of a node:
Receive Queue
Recv Queue AVG- Shows the average size of the local received queue since the last status query.Recv Queue CUR- Current (instantaneous) length of the recv queue.Recv Queue MAX- The maximum length of the recv queue since the last FLUSH STATUS command.Recv Queue MIN- The minimum length of the recv queue since the last FLUSH STATUS command.
Send Queue
Send Queue AVG- Show an average for the send queue length since the last FLUSH STATUS query.Send Queue CUR- Current (instantaneous) length of the send queue.Send Queue MAX- The maximum length of the send queue since the last FLUSH STATUS command.Send Queue MIN- The minimum length of the send queue since the last FLUSH STATUS command.
Flow Control
Flow Control Recv- Returns the number of FC_PAUSE events the node has received, including those the node has sent.Flow Control Sent- Returns the number of FC_PAUSE events the node has sentFlow Control paused- Shows the fraction of the time, since FLUSH STATUS was last called, that the node paused due to Flow Control.
Cert deps distance
Shows the average distance between the lowest and highest sequence number, or seqno, values that the node can possibly apply in parallel. This represents the node’s potential degree for parallelization. In other words, the optimal value you can use with the wsrep_slave_threads parameter, given that there is no reason to assign more slave threads than transactions you can apply in parallel.
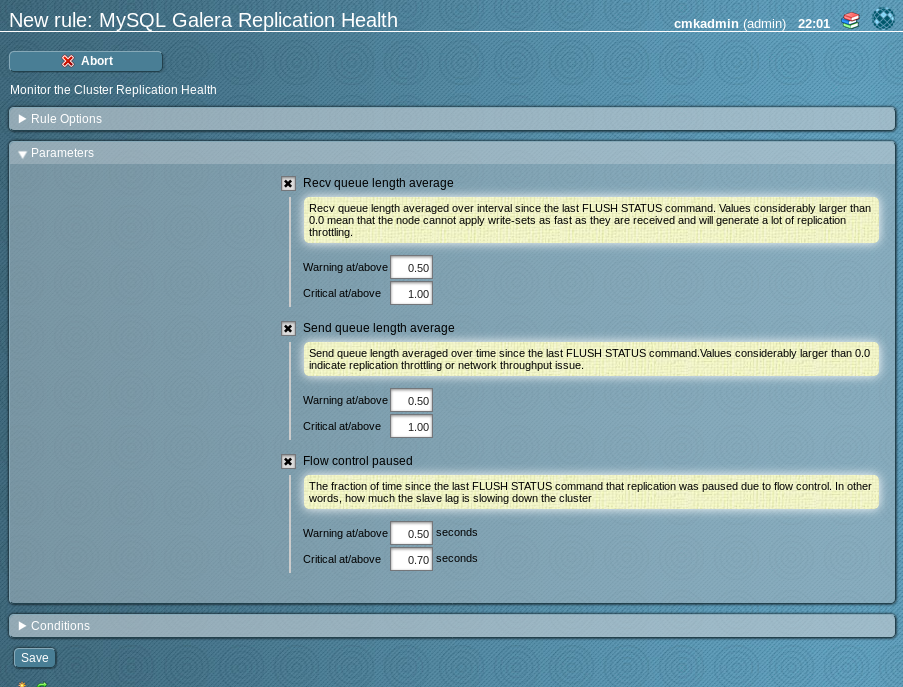
In the WATO you have the possibility to define:
Recv queue length average
- shows the average size of the local received queue since the last status query.
- When the node returns a value higher than 0.0 it means that the node cannot apply write-sets as fast as it receives them, which can lead to replication throttling.
- you can define warning and critical thresholds to alert a node causing replication throttling
Send queue length average
- show an average for the send queue length since the last FLUSH STATUS query.
- Values much greater than 0.0 indicate replication throttling or network throughput issues, such as a bottleneck on the network link. The problem can occur at any layer from the physical components of your server to the configuration of the operating system.
- you can define warning and critical thresholds to alert a node with network throughput problems
Flow control paused
- shows the fraction of the time, since FLUSH STATUS was last called, that the node paused due to Flow Control.
- When the node returns a value of 0.0, it indicates that the node did not pause due to Flow Control during this period. When the node returns a value of 1.0, it indicates that the node spent the entire period paused. If the time between FLUSH STATUS and SHOW STATUS was one minute and the node returned 0.25, it indicates that the node was paused for a total 15 seconds over that time period.
- Ideally, the return value should stay as close to 0.0 as possible, since this means the node is not falling behind the cluster. In the event that you find that the node is pausing frequently, you can adjust the wsrep_slave_threads parameter or you can exclude the node from the cluster.
- Create a personal fork of the project on Github.
- Clone the fork on your local machine. Your remote repo on Github is called
origin. - Add the original repository as a remote called
upstream. - If you created your fork a while ago be sure to pull upstream changes into your local repository.
- Create a new branch to work on!
- Implement/fix your feature, comment your code.
- Add or change the documentation as needed.
- Push your branch to your fork on Github, the remote
origin. - From your fork create a pull request to the
masterbranch.


