Python package for cell-gene coembedding and analysis pipeline for single cell transcriptomics data
Pyhton 3.7 or above with setuptools instaled.
Download the package directly from github. For linux users
https://github.com/Swagatam123/Stardust_package.gitDownload the binary openOrd.jar from the release tag v1.0 and place it under Stardust_package/stardust/run_stardust/ Change the directoery to the package directory
cd Stardust_package/Use the package manager pip to install package.
pip install .The package supports 10x genomics data with .10x file format and csv file with the filename expression.csv The expression data should contain the cells rowwise and genes columnwise.
import stardust

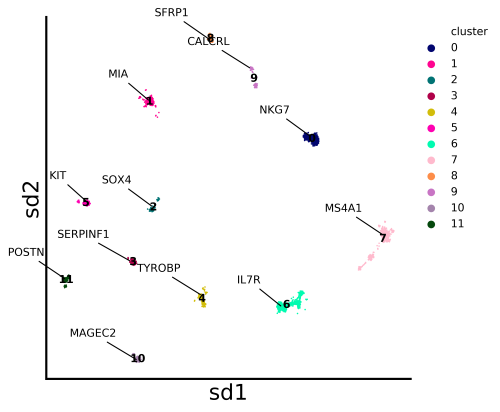
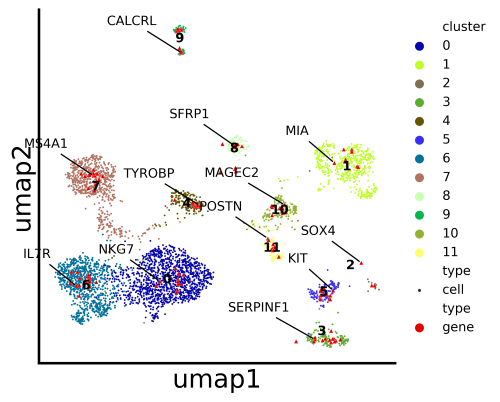
stardust.run_stardust.run() #generated the coembedding plots under Stardust_resuts/visualization_output/4_pass.
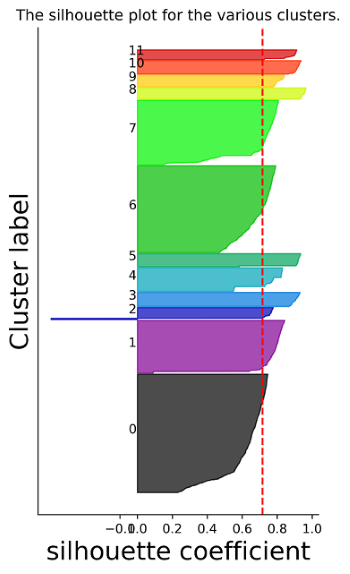
stardust.analysis.silhouette() # optional for analysis purpose
stardust.analysis.heatmap()   # optional for analysis purpose
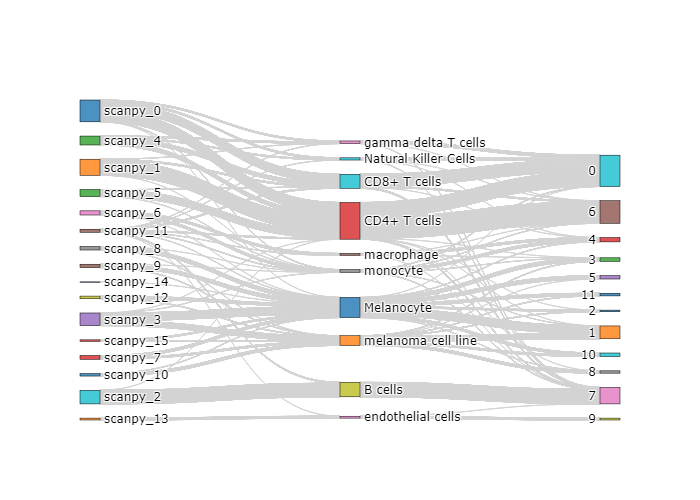
stardust.analysis.alluvial() # optional for analysis purposeThis vignette uses a melanoma data set from the website here to demonstrate a standard pipeline. This vignette can be used as a tutorial as well.
To re-produce the cell-gene co-embedding visualization you need to run the following commands
import stardust

stardust.run_stardust.run() #generated the coembedding plots under Stardust_resuts/visualization_output/4_pass.
On run command, you need to provide the expression matrix path and the file format (i.e either "csv" or "10x" ).
NOTE: For csv file format, the expression file name should be "expression.csv"
NOTE: To run the analysis functions you need to run the cell-gene co-embedding.
stardust.analysis.silhouette()stardust.analysis.heatmap()stardust.analysis.alluvial()The embedding plots at its related data will be available in Stardust_results/visualization_output/4_pass
Pull requests are welcome. For major changes, please open an issue first to discuss what you would like to change.


