Guardian of Kubernetes and OpenShift Clusters
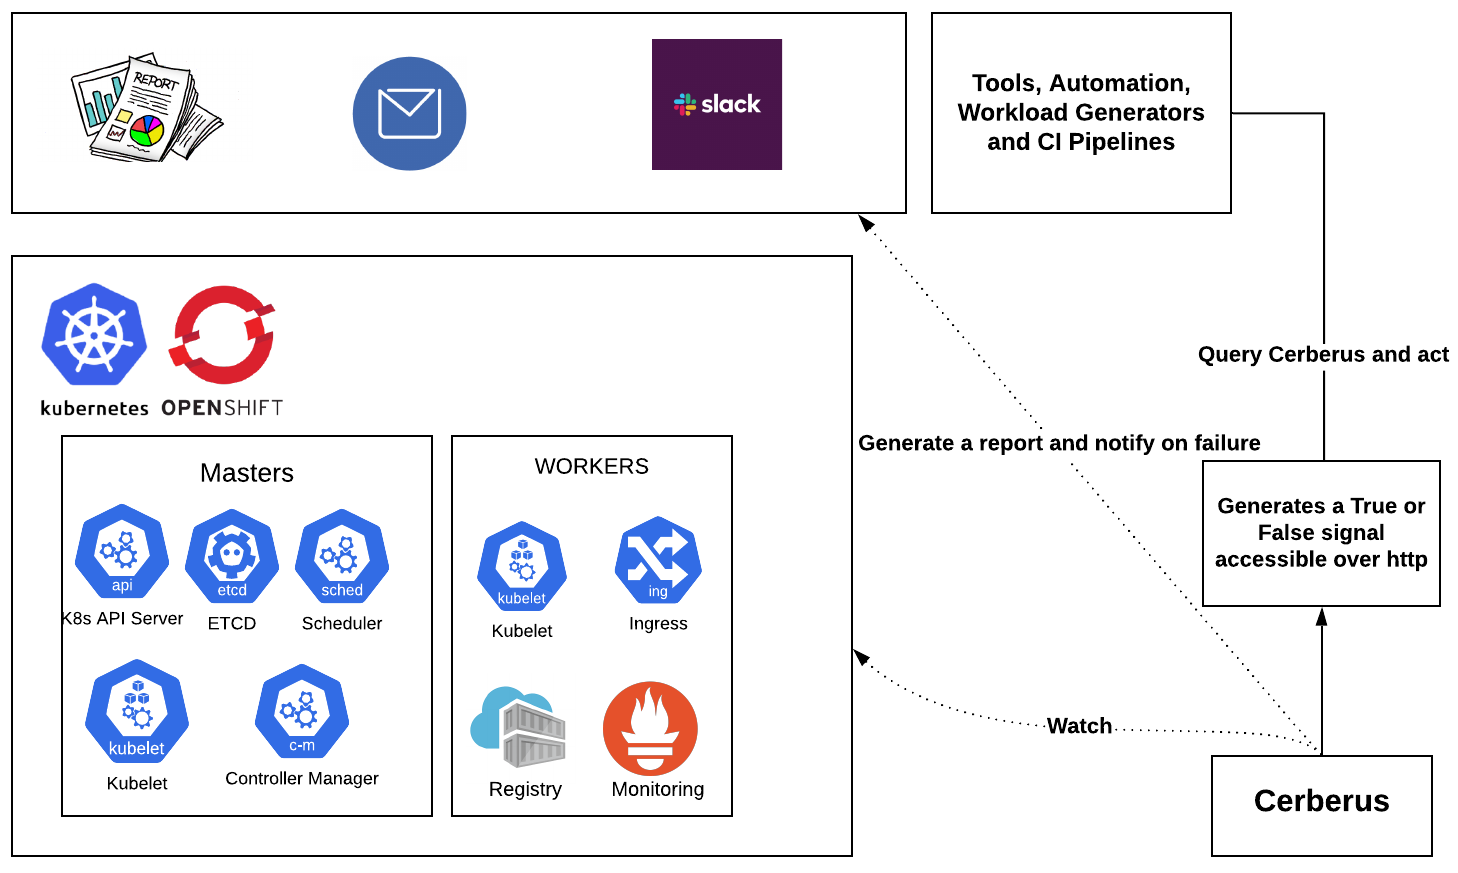
Cerberus watches the Kubernetes/OpenShift clusters for dead nodes, system component failures/health and exposes a go or no-go signal which can be consumed by other workload generators or applications in the cluster and act accordingly.
Instructions on how to setup, configure and run Cerberus can be found at Installation.
Following are the components of Kubernetes/OpenShift that Cerberus can monitor today, we will be adding more soon.
| Component | Description | Working |
|---|---|---|
| Nodes | Watches all the nodes including masters, workers as well as nodes created using custom MachineSets | ✔️ |
| Namespaces | Watches all the pods including containers running inside the pods in the namespaces specified in the config | ✔️ |
| Cluster Operators | Watches all Cluster Operators | ✔️ |
| Masters Schedulability | Watches and warns if masters nodes are marked as schedulable | ✔️ |
| Routes | Watches specified routes | ✔️ |
| CSRs | Warns if any CSRs are not approved | ✔️ |
| Critical Alerts | Warns the user on observing abnormal behavior which might effect the health of the cluster | ✔️ |
| Bring your own checks | Users can bring their own checks and Ceberus runs and includes them in the reporting as wells as go/no-go signal | ✔️ |
An explanation of all the components that Cerberus can monitor are explained here
Cerberus exposes the cluster health and failures through a go/no-go signal, report and metrics API.
When the cerberus is configured to run in the daemon mode, it will continuosly monitor the components specified, runs a light weight http server at http://0.0.0.0:8080 and publishes the signal i.e True or False depending on the components status. The tools can consume the signal and act accordingly.
The report is generated in the run directory and it contains the information about each check/monitored component status per iteration with timestamps. It also displays information about the components in case of failure. Refer report for example.
You can use the "-o <file_path_name>" option to change the location of the created report
Cerberus exposes the metrics including the failures observed during the run through an API. Tools consuming Cerberus can query the API to get a blob of json with the observed failures to scrape and act accordingly. For example, we can query for etcd failures within a start and end time and take actions to determine pass/fail for test cases or report whether the cluster is healthy or unhealthy for that duration.
- The failures in the past 1 hour can be retrieved in the json format by visiting http://0.0.0.0:8080/history.
- The failures in a specific time window can be retrieved in the json format by visiting http://0.0.0.0:8080/history?loopback=.
- The failures between two time timestamps, the failures of specific issues types and the failures related to specific components can be retrieved in the json format by visiting http://0.0.0.0:8080/analyze url. The filters have to be applied to scrape the failures accordingly.
Cerberus supports reporting failures in slack. Refer slack integration for information on how to set it up.
Cerberus also consumes node-problem-detector to detect various failures in Kubernetes/OpenShift nodes. More information on setting it up can be found at node-problem-detector
Users can add additional checks to monitor components that are not being monitored by Cerberus and consume it as part of the go/no-go signal. This can be accomplished by placing relative paths of files containing additional checks under custom_checks in config file. All the checks should be placed within the main function of the file. If the additional checks need to be considered in determining the go/no-go signal of Cerberus, the main function can return a boolean value for the same. Having a dict return value of the format {'status':status, 'message':message} shall send signal to Cerberus along with message to be displayed in slack notification. However, it's optional to return a value. Refer to example_check for an example custom check file.
Monitoring metrics and alerting on abnormal behavior is critical as they are the indicators for clusters health. Information on supported alerts can be found at alerts.
There can be number of use cases, here are some of them:
-
We run tools to push the limits of Kubernetes/OpenShift to look at the performance and scalability. There are a number of instances where system components or nodes start to degrade, which invalidates the results and the workload generator continues to push the cluster until it is unrecoverable.
-
When running chaos experiments on a kubernetes/OpenShift cluster, they can potentially break the components unrelated to the targeted components which means that the chaos experiment won't be able to find it. The go/no-go signal can be used here to decide whether the cluster recovered from the failure injection as well as to decide whether to continue with the next chaos scenario.
-
Benchmark Operator: The intent of this Operator is to deploy common workloads to establish a performance baseline of Kubernetes cluster on your provider. Benchmark Operator consumes Cerberus to determine if the cluster was healthy during the benchmark run. More information can be found at cerberus-integration.
-
Kraken: Tool to inject deliberate failures into Kubernetes/OpenShift clusters to check if it is resilient. Kraken consumes Cerberus to determine if the cluster is healthy as a whole in addition to the targeted component during chaos testing. More information can be found at cerberus-integration.
- https://www.openshift.com/blog/openshift-scale-ci-part-4-introduction-to-cerberus-guardian-of-kubernetes/openshift-clouds
- https://www.openshift.com/blog/reinforcing-cerberus-guardian-of-openshift/kubernetes-clusters
We are always looking for more enhancements, fixes to make it better, any contributions are most welcome. Feel free to report or work on the issues filed on github.
More information on how to Contribute
Key Members(slack_usernames): paige, rook, mffiedler, mohit, dry923, rsevilla, ravi
Thanks to Mary Shakshober ( https://github.com/maryshak1996 ) for designing the logo.

