Viewer for collapsed stack output of profiles. Dedicated to async-profiler.
Simply download latest release from https://github.com/krzysztofslusarski/collapsed-stack-viewer/releases.
git clone --depth 1 https://github.com/krzysztofslusarski/collapsed-stack-viewer.git
cd collapsed-stack-viewer/
mvn clean package
JAVA_HOME should point to JDK 11.
java -jar collapsed-stack-viewer.jar
Java should point to JDK 11. After you run it, viewer is available on http://localhost:8079/.
Viewer is Spring Boot application, you can create application.yml with:
server:
port: 8079 ./profiler -t -d 30 -e cpu -o collapsed -f output.txt <pid>
-t- gives you output divided by thread-d 30- 30s duration-e cpu- profiled event, viewer should work with every event-o collapsed- as name suggest, this is collapsed stack viewer, so this is mandatory output-f output.txt- output file<pid>- pid of your JVM
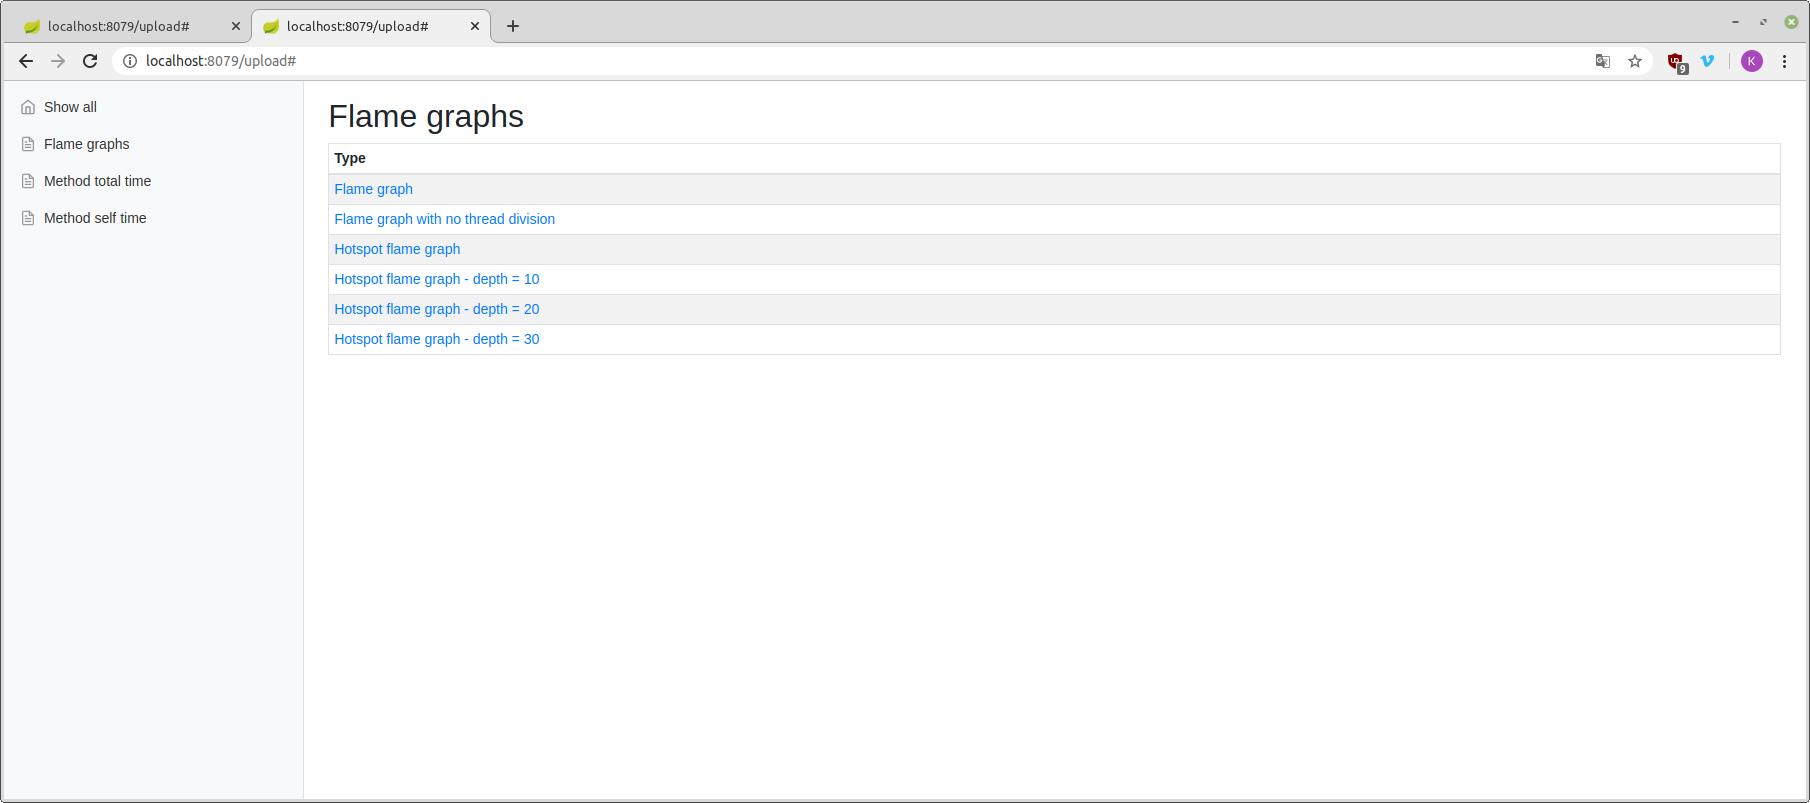
Viewer can generate flame graphs:
- Flame graph - common flame graph from your collapsed stack file
- Flame graph with no thread division - common flame graph with division by thread removed
- Hotspot flame graph - flame graph that is inverted and reversed, presenting hotspots from collapsed stack file:
- depth = 10/20/30 - shortened graph with smaller stacks
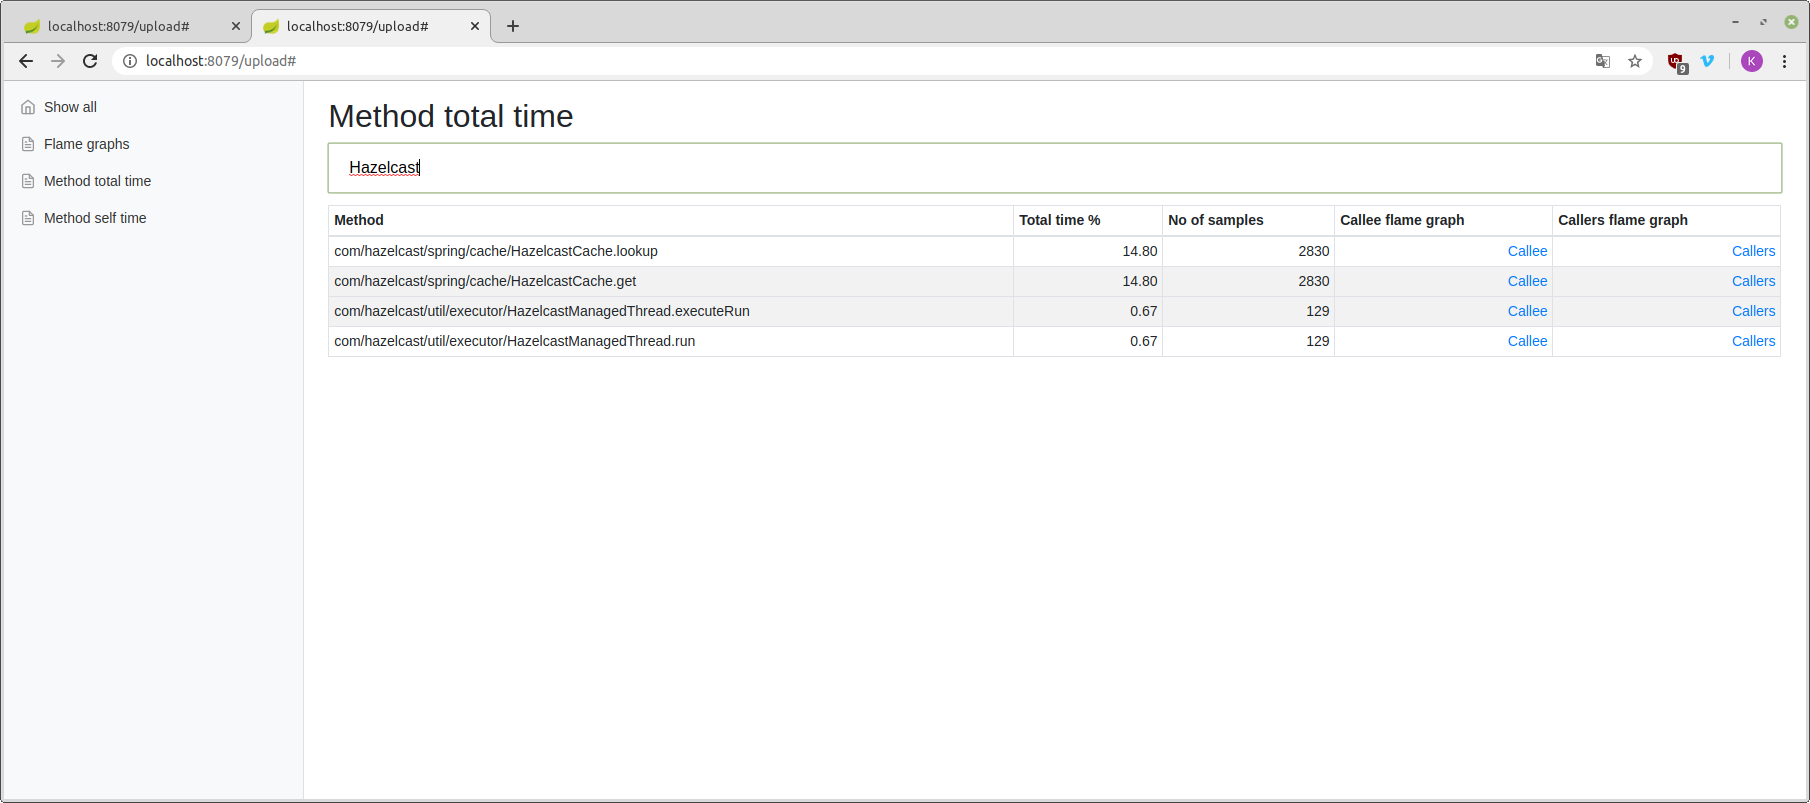
Total time is number of stacks, that method was anywhere on the stack. Method name can be filtered.
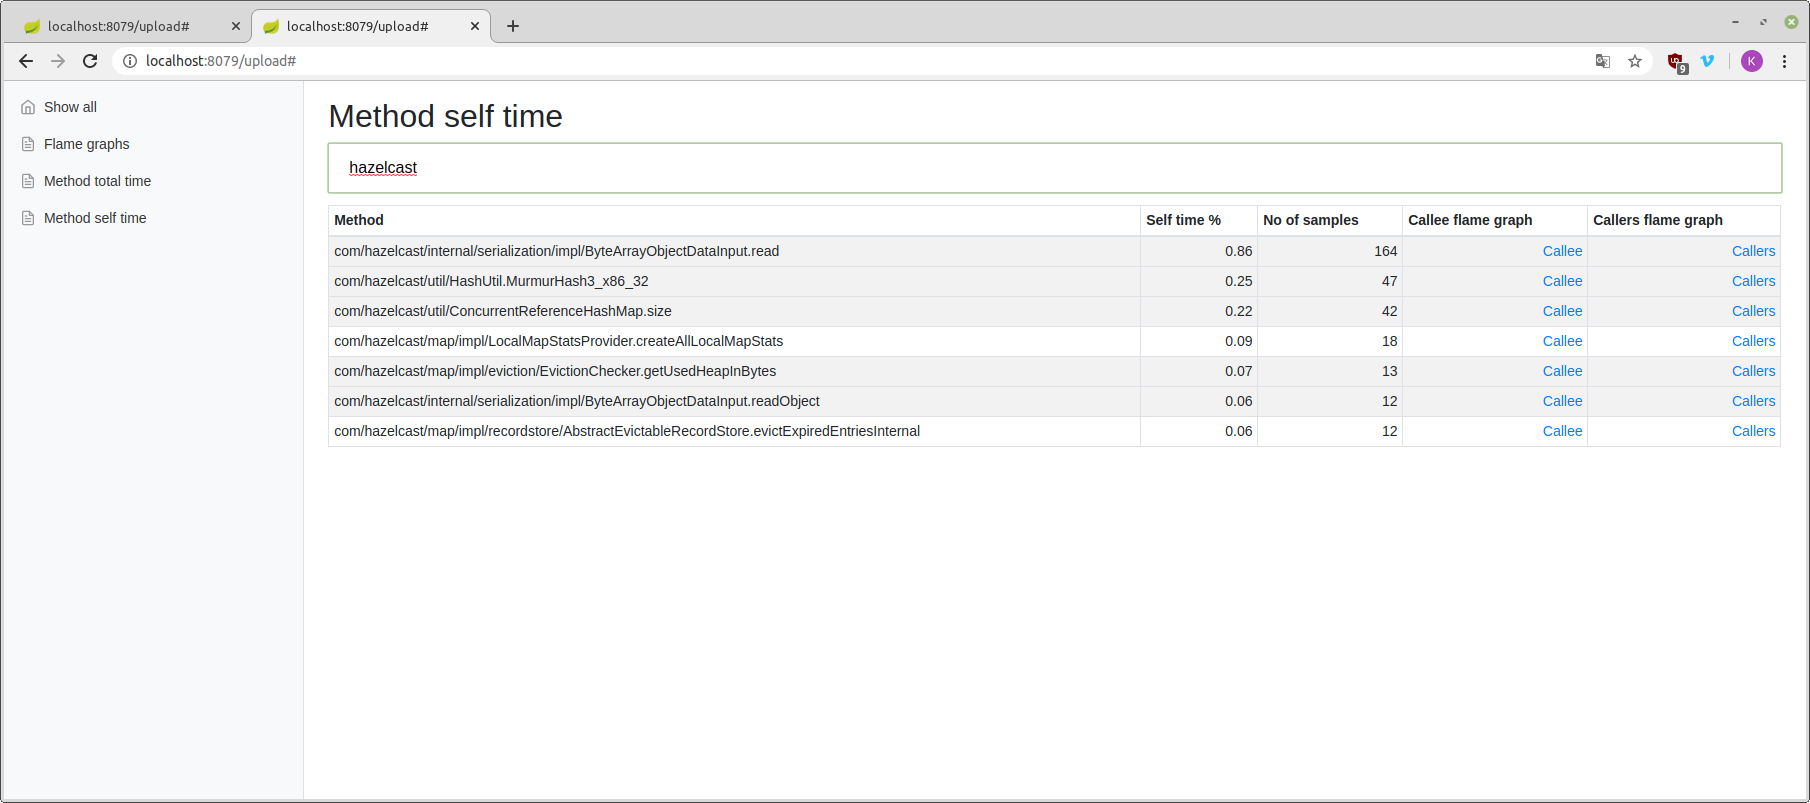
Self time is number of stacks, that method was at the end of the stack. Method name can be filtered.
Callee graph shows what method is actually doing. This graph is aggregated, so it shows every usage of method.
Callers graph shows what which method used profiled method. This graph is aggregated, so it shows every usage of method.
Viewer can compare two files, it will present
- Method total/self time tables:
- Methods not found in the 1st file
- Methods not found in the 2nd file
- Methods that used more resources in the 1st file then in the 2nd file
- Methods that used more resources in the 2nd file then in the 1st file
- Methods that used the same amount of resources


