This project is a Java Virtual Machine and Garbage Collector log analyzer. It is dedicated to JVM 11 and above (JVM 8 support is under development). The logs have to be in a proper format with proper decorators, check sections at the end for limitations and working examples.
The project creates two artifacts:
- analyzer-web.jar - web application that is deployed on http://gclogs.com
- analyzer-standalone.jar - much faster standalone Swing application
Simply download latest release.
git clone --depth 1 https://github.com/krzysztofslusarski/jvm-gc-logs-analyzer.git
cd jvm-gc-logs-analyzer/
mvn clean package
JAVA_HOME should point to JDK 17.
Standalone application: java -jar analyzer-standalone.jar
Web application: java -jar analyzer-web.jar
Java should point to JDK 17.
gc*,
gc+stringdedup=debug,
gc+ergo=trace,
gc+age=trace,
gc+phases=trace,
gc+humongous=trace
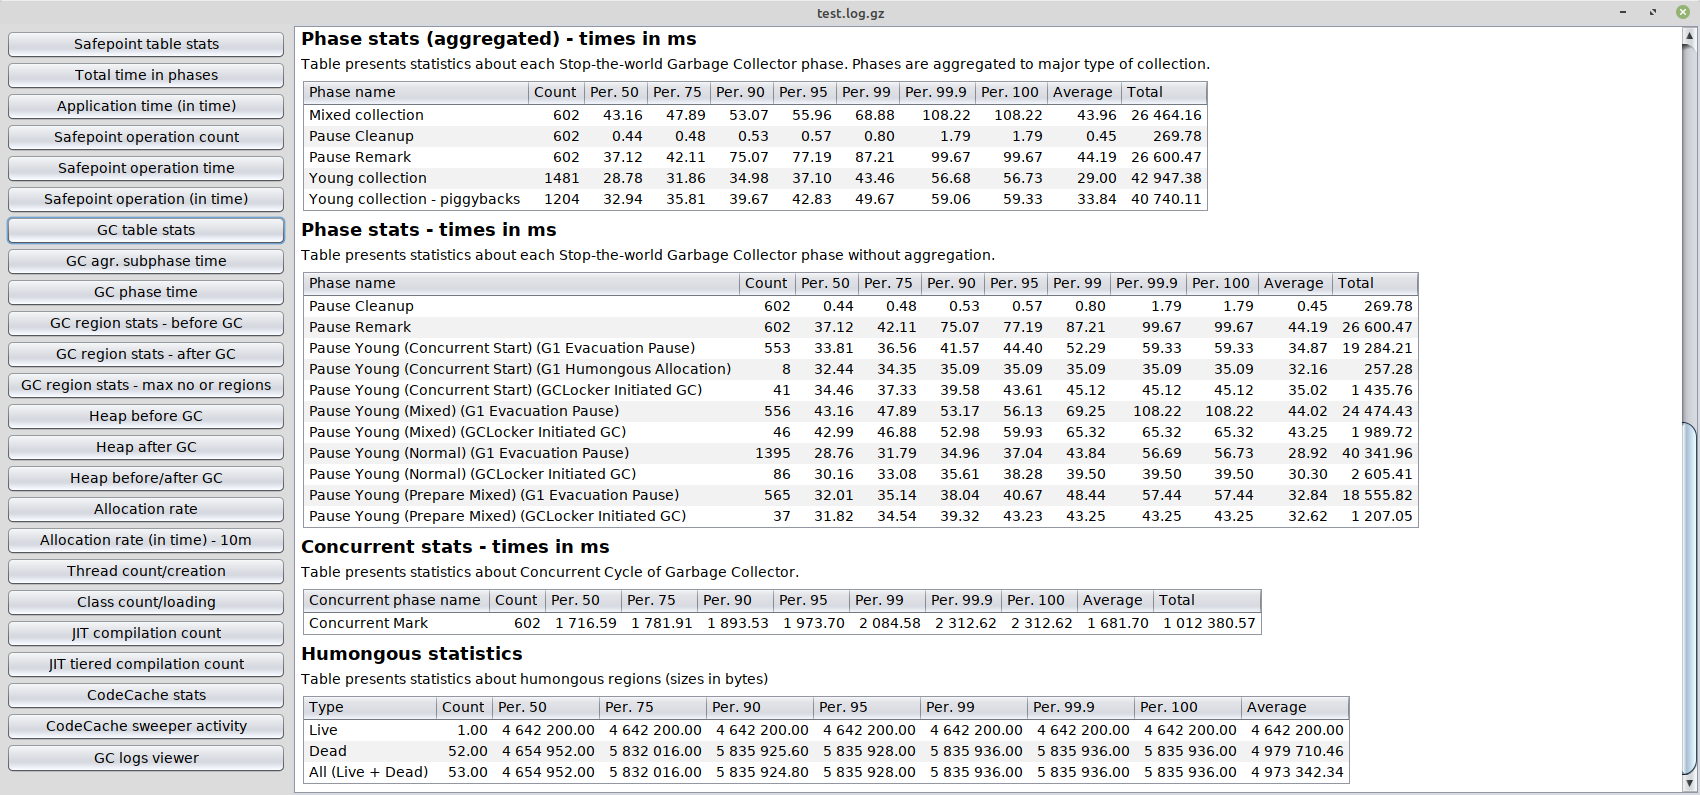
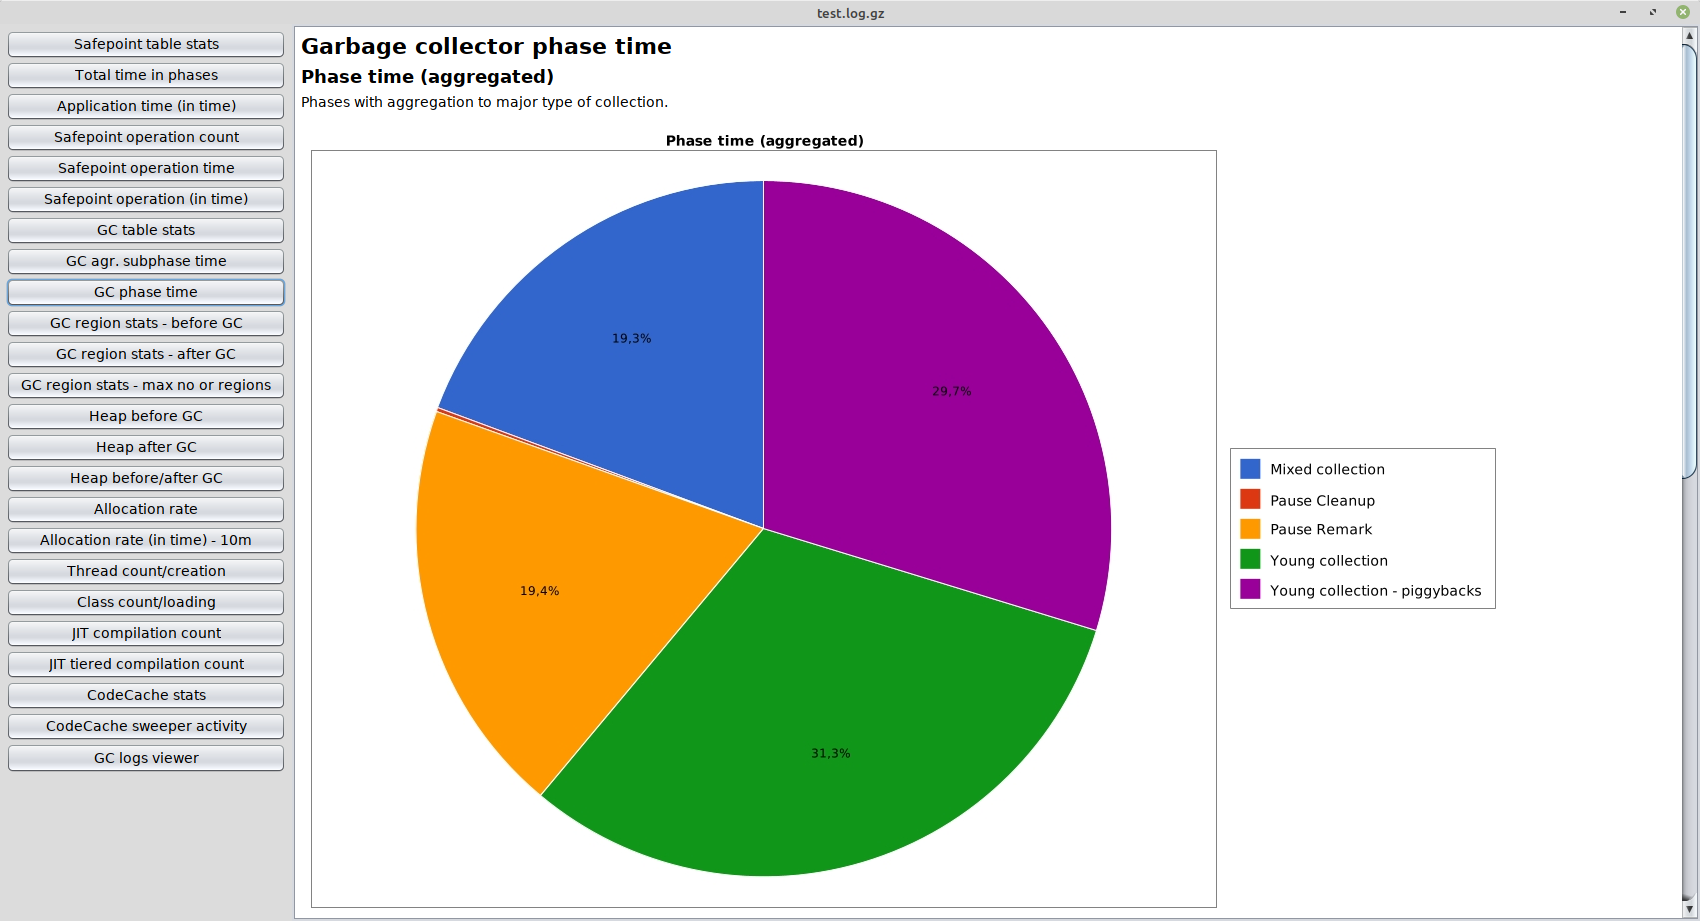
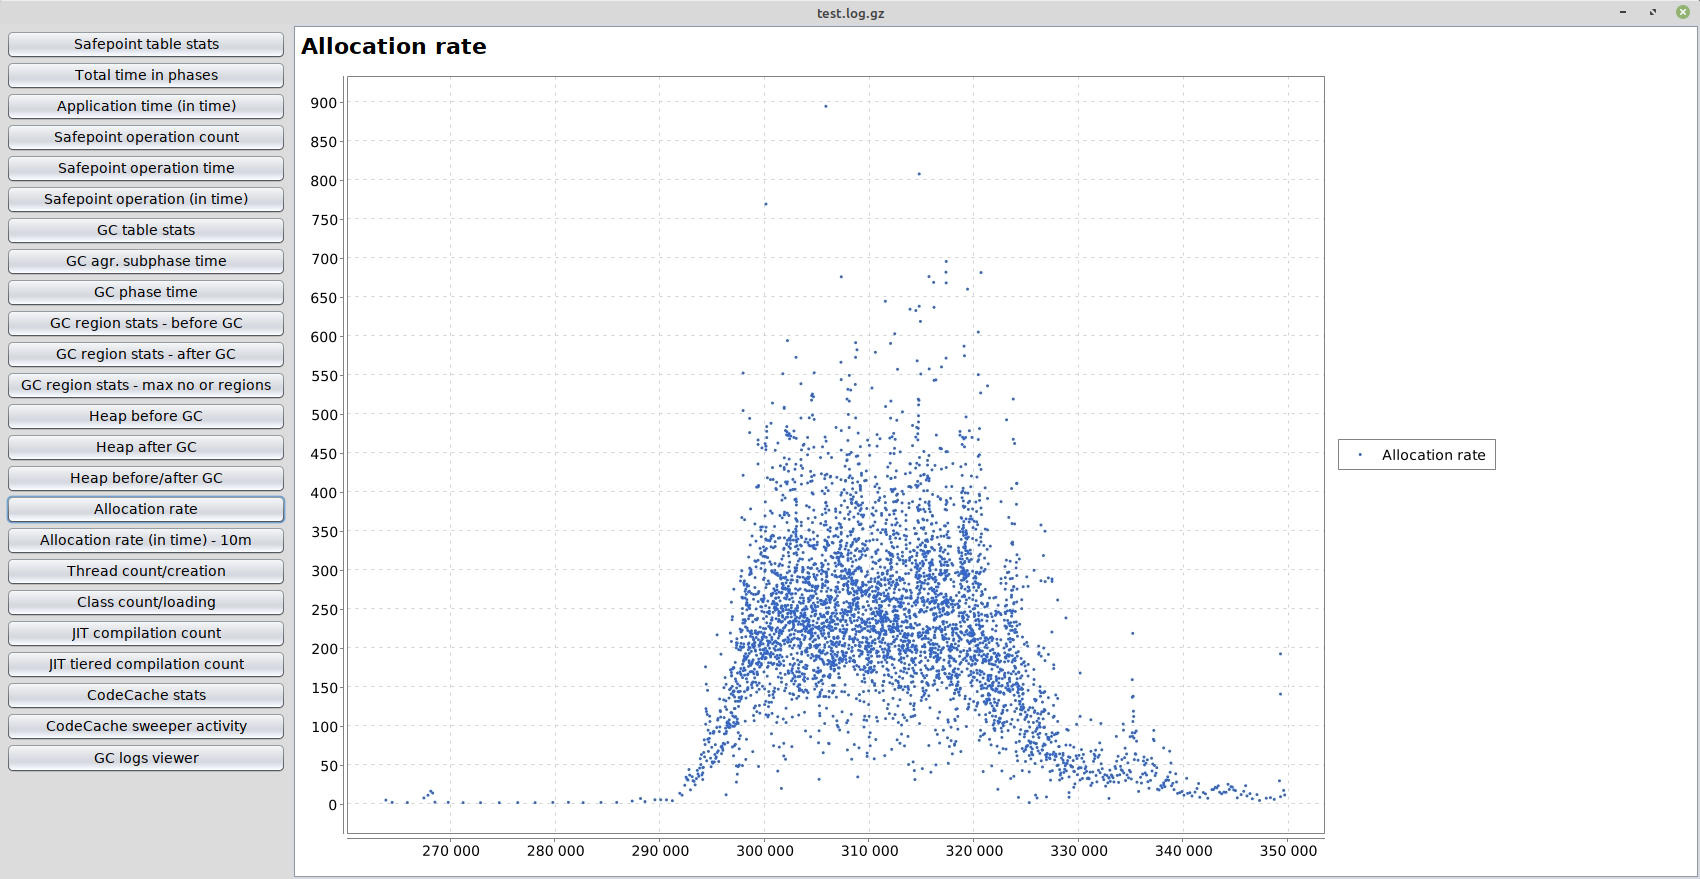
There are multiple charts and tables generated by this tool. I will show in README only the most important one.
-Xlog:safepoint
From safepoint logs this tool will create tables and charts:
In this table you can find aggregated statistics of:
- each safepoint operation
- time to safepoint
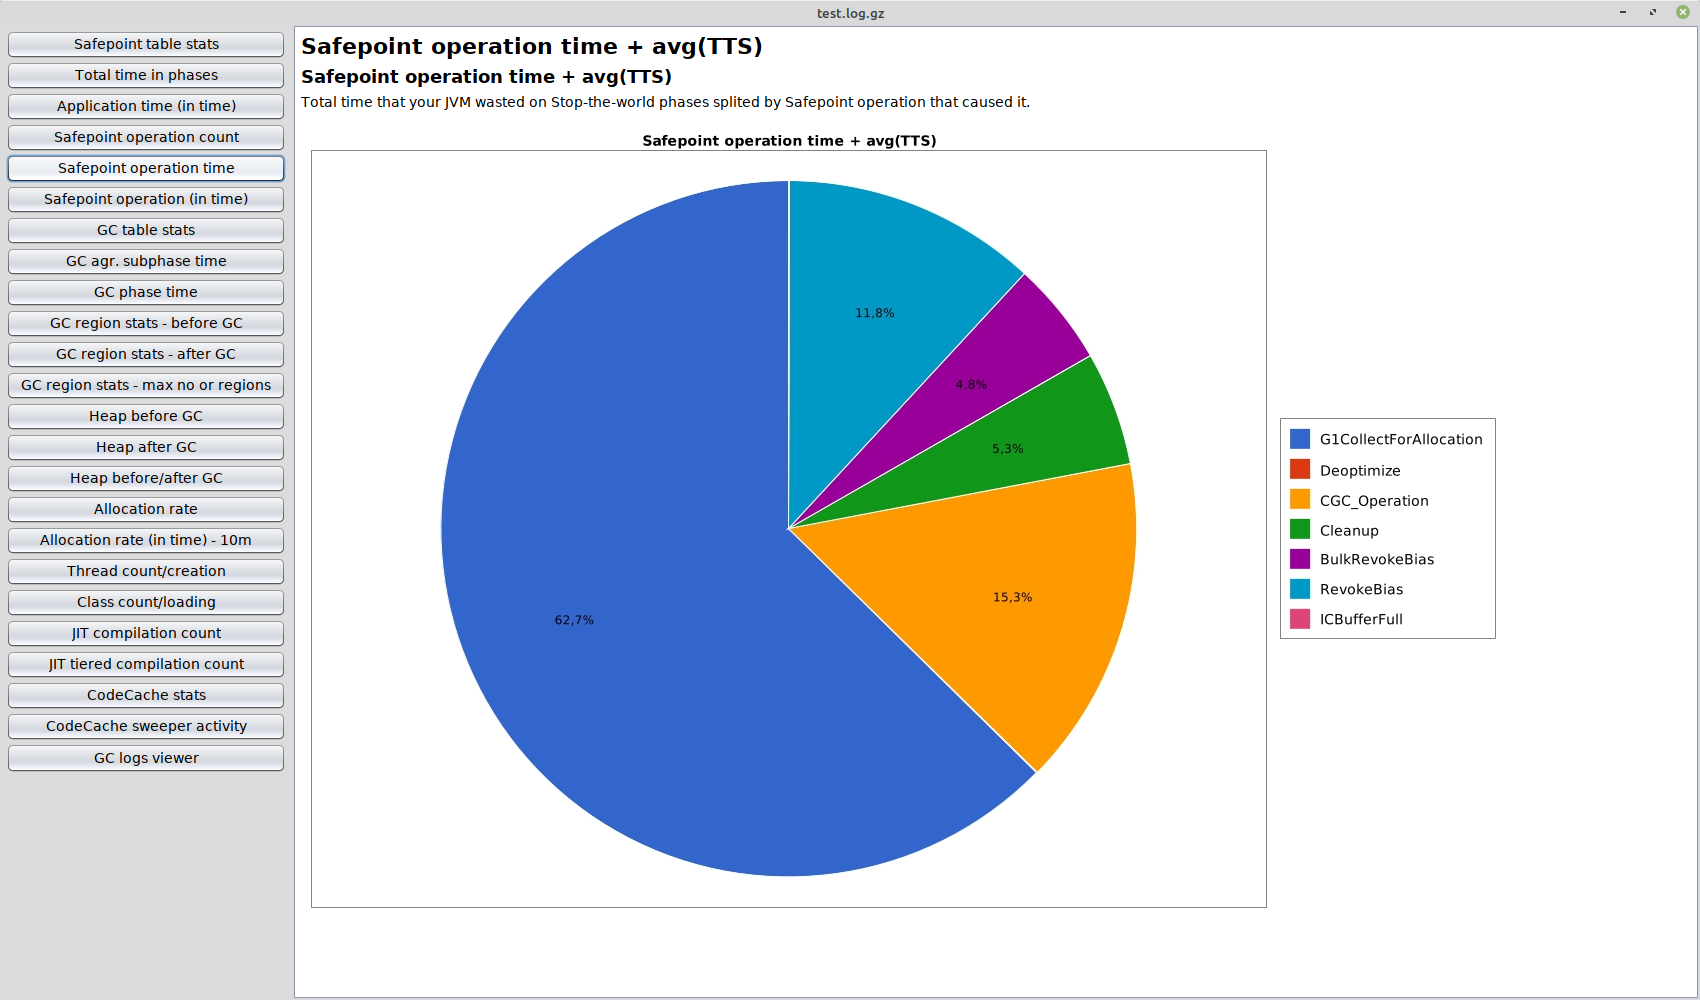
This chart shows how much time your JVM spends in safepoint operation, time to safepoint and in your application.
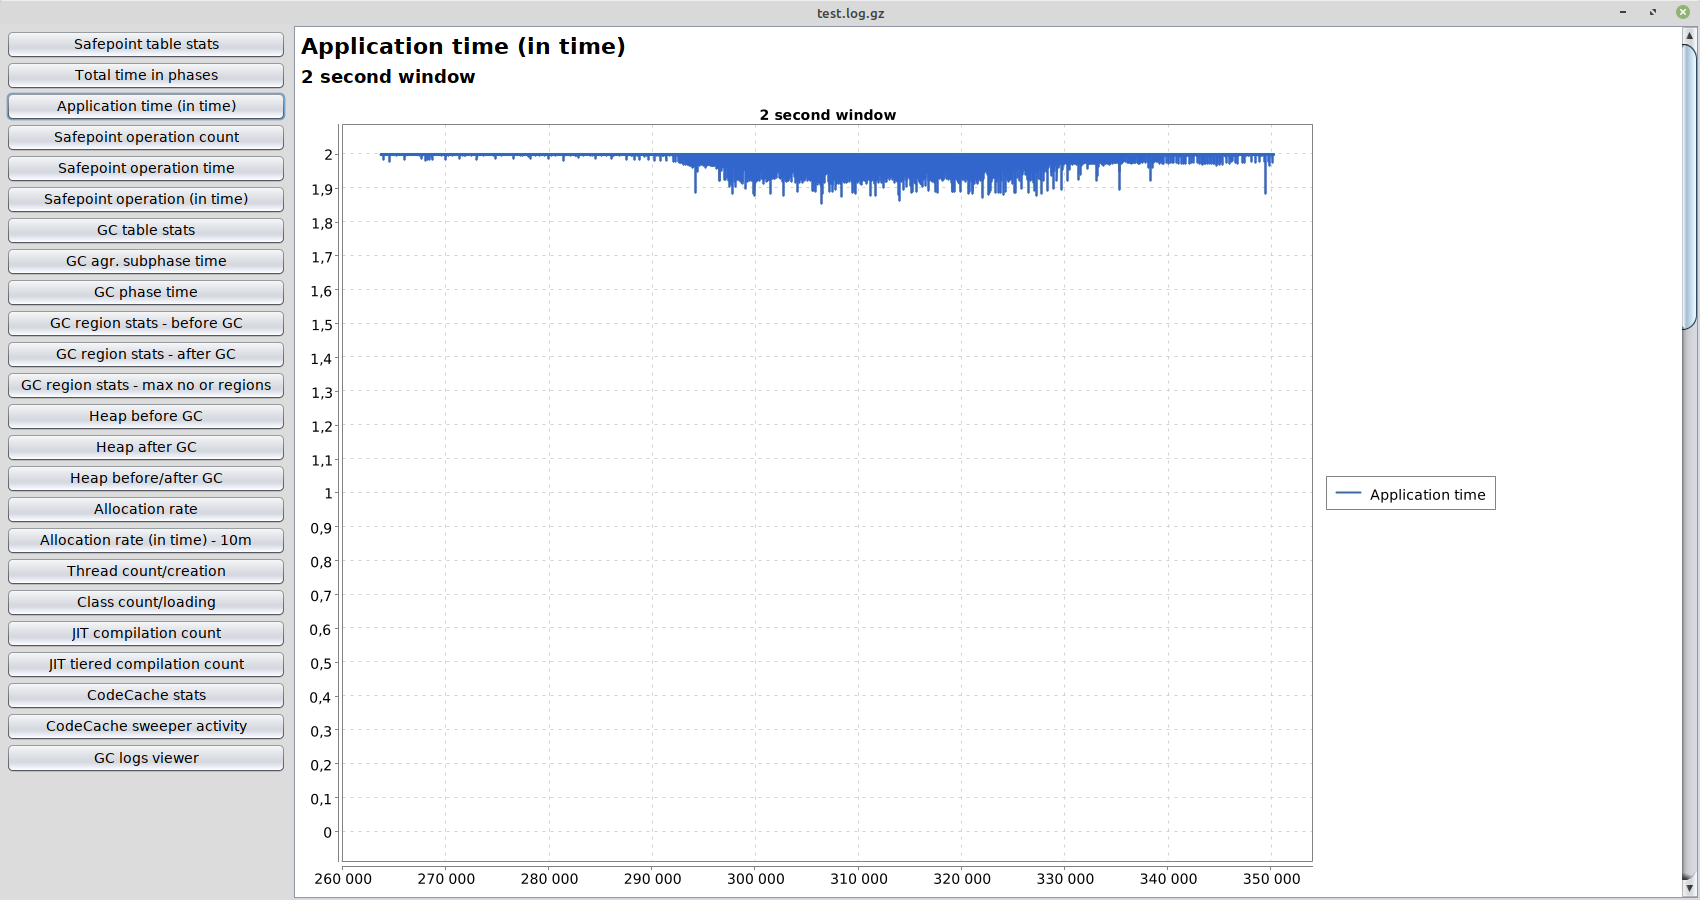
This charts show how much time your JVM spends running your application in 2/5/15 seconds windows.
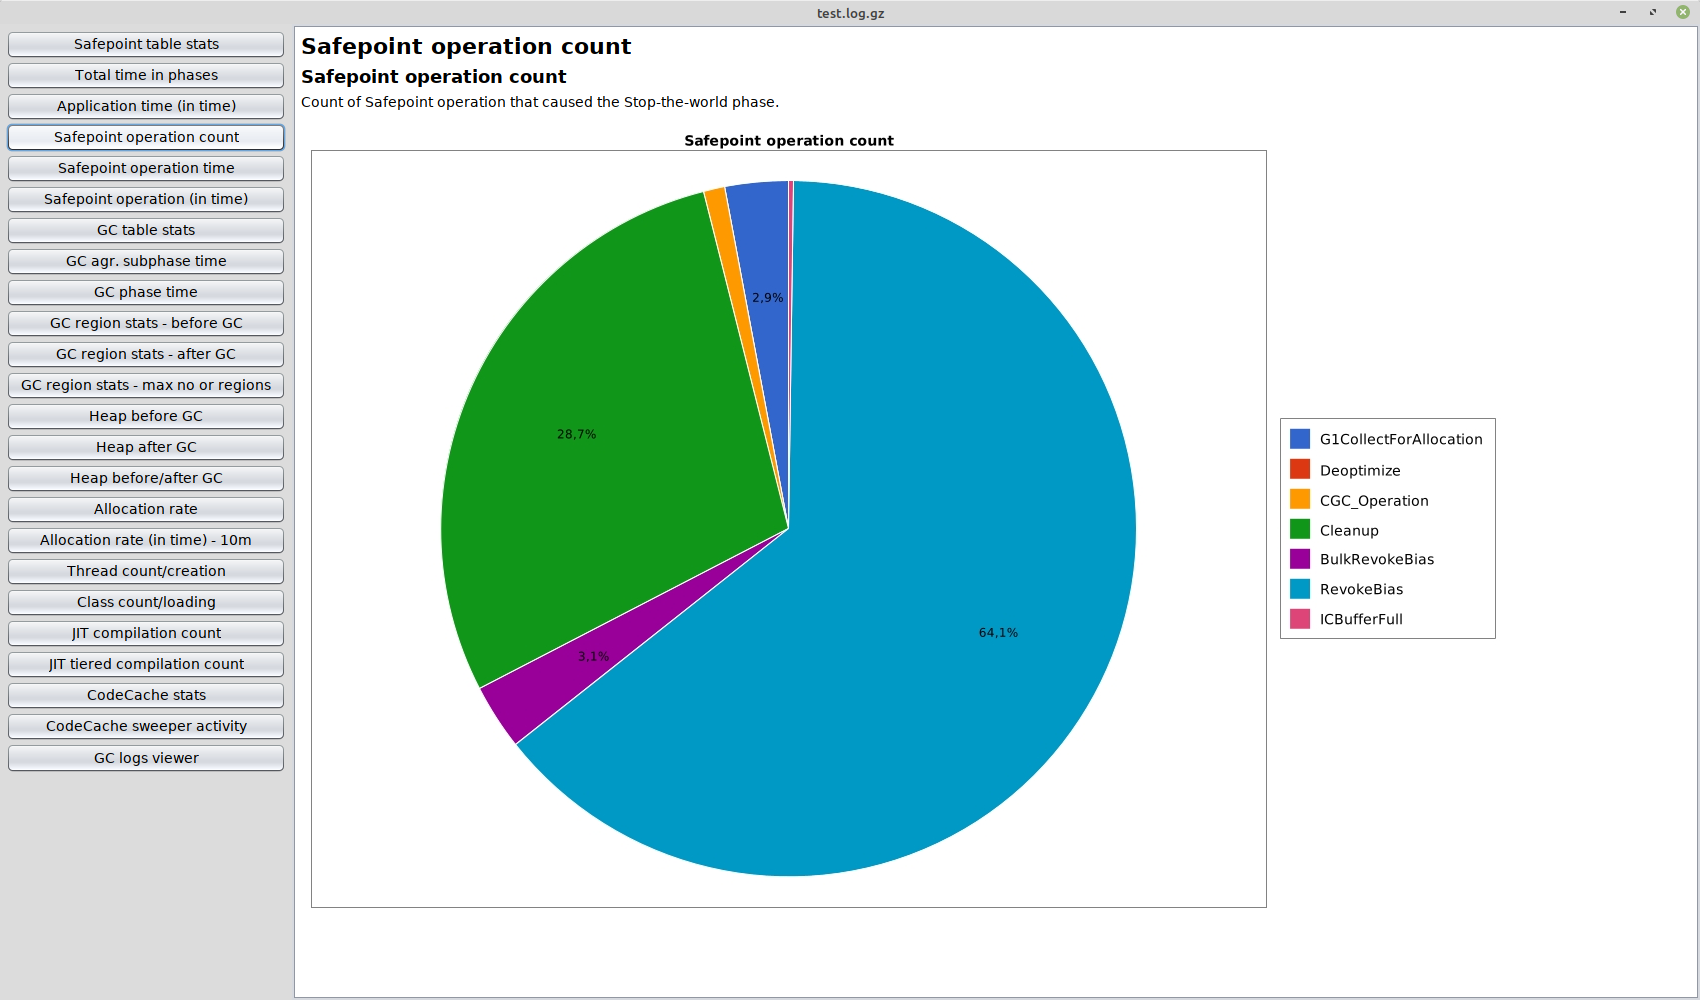
This chart shows distribution of safepoint operation count.
This chart shows distribution of time between each safepoint operation.
This chart shows distribution of safepoint operation in time.
-Xlog:class+unload,class+load
From classloader logs this tool will create charts:
-Xlog:os+thread
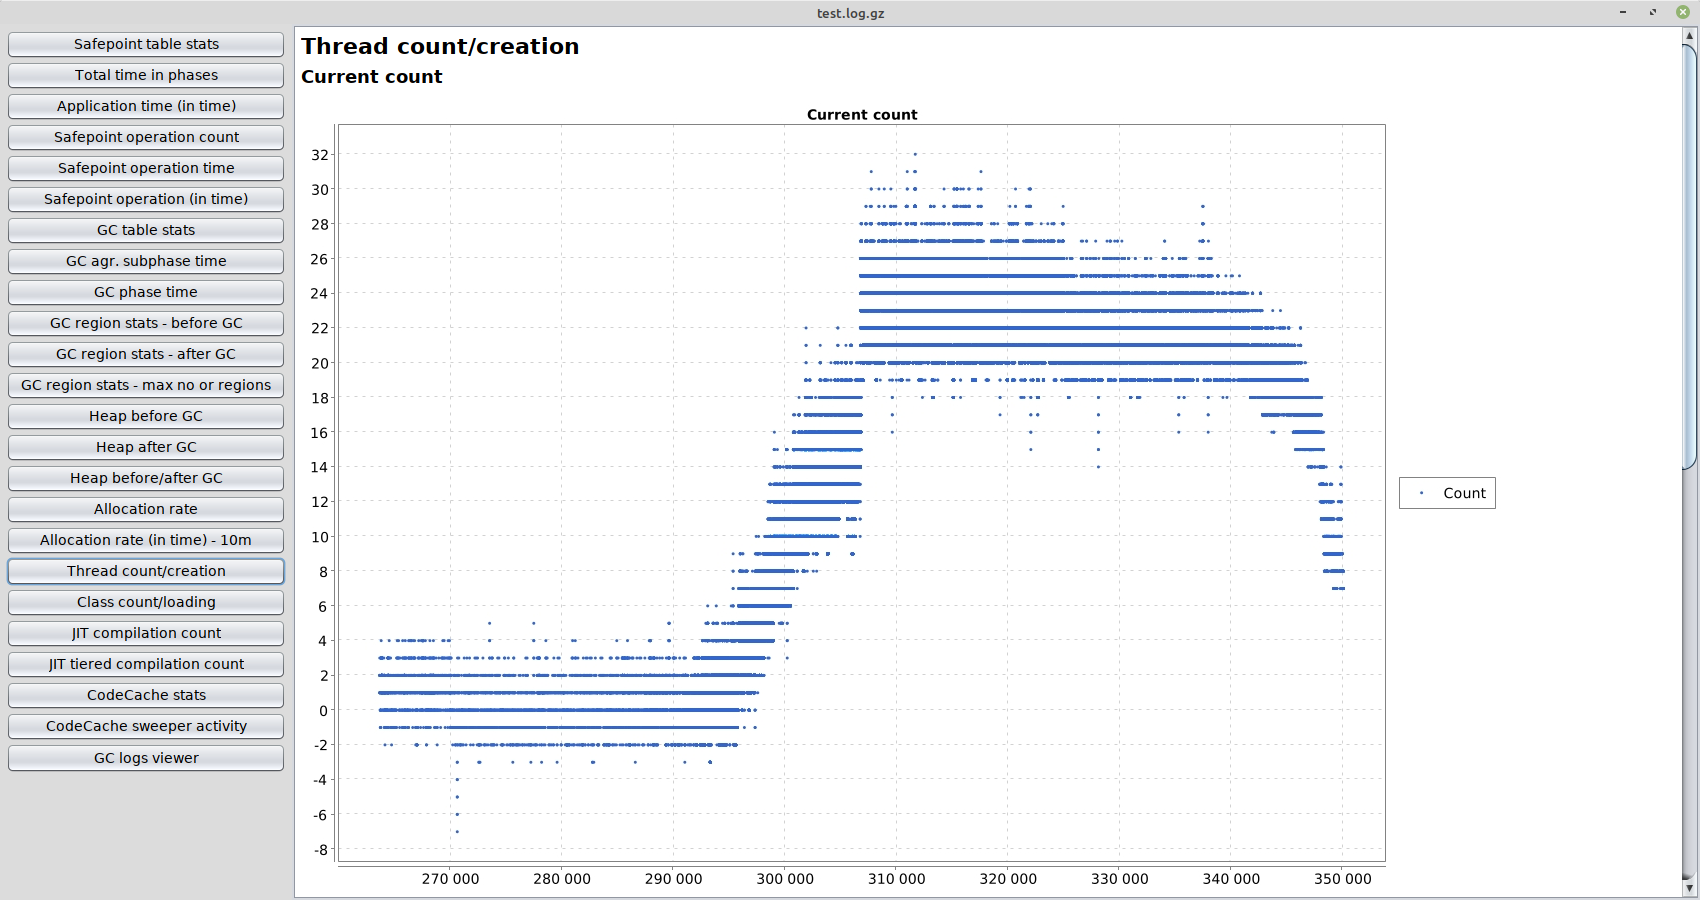
From OS thread logs this tool will create charts:
-Xlog:jit+compilation=debug
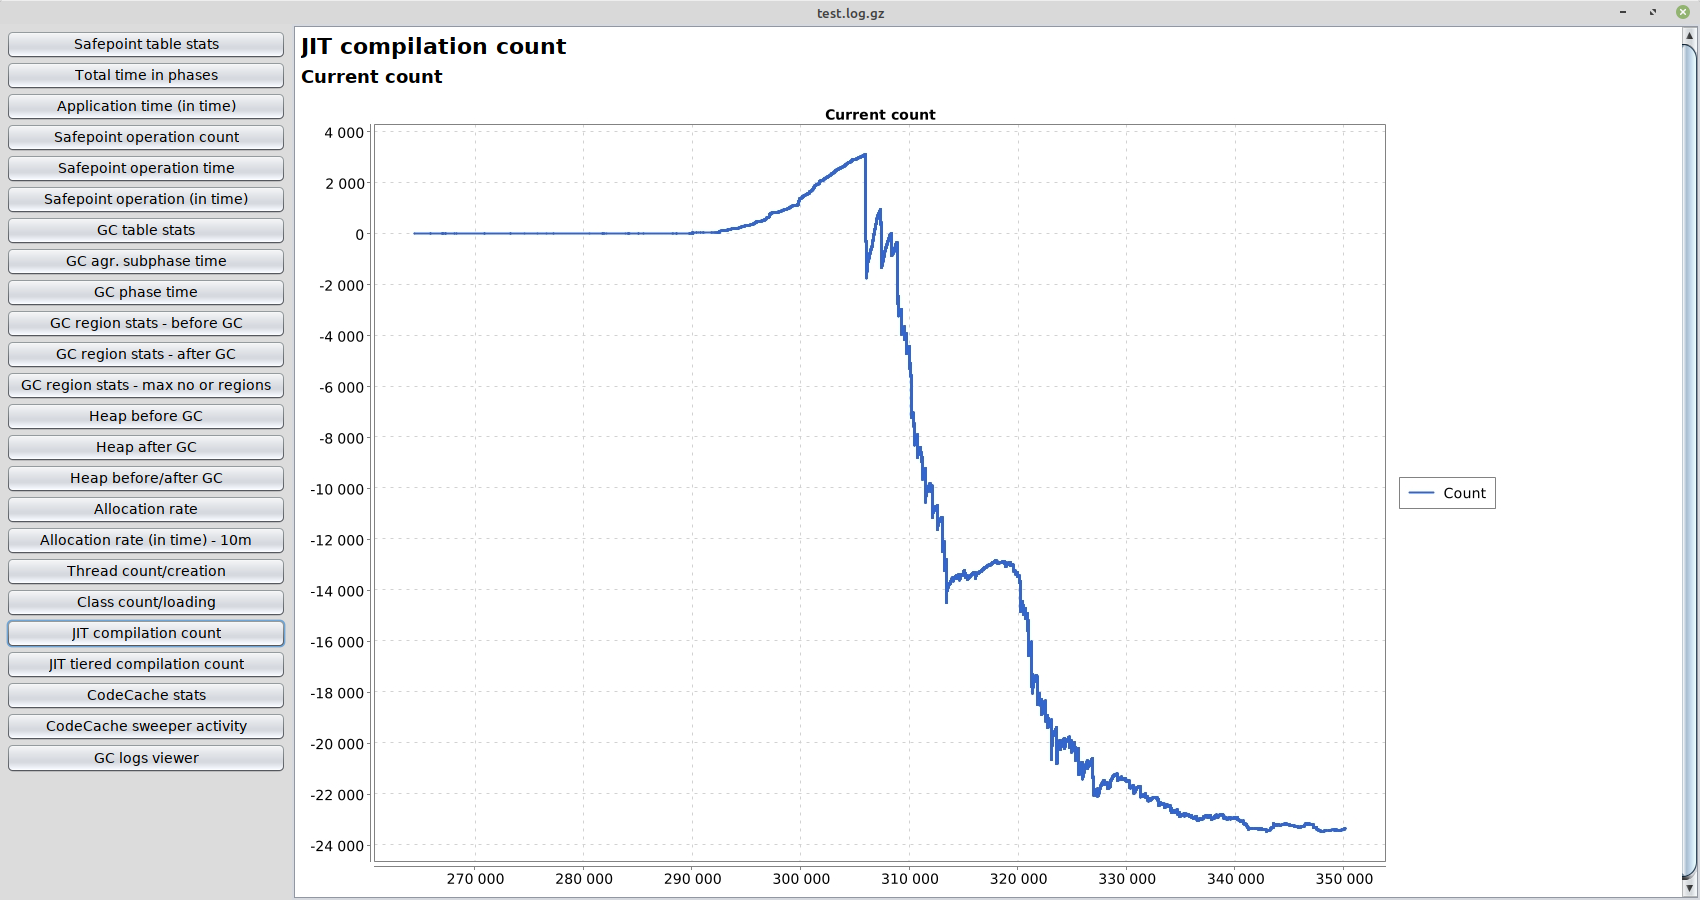
From JIT compilation logs this tool will create charts:
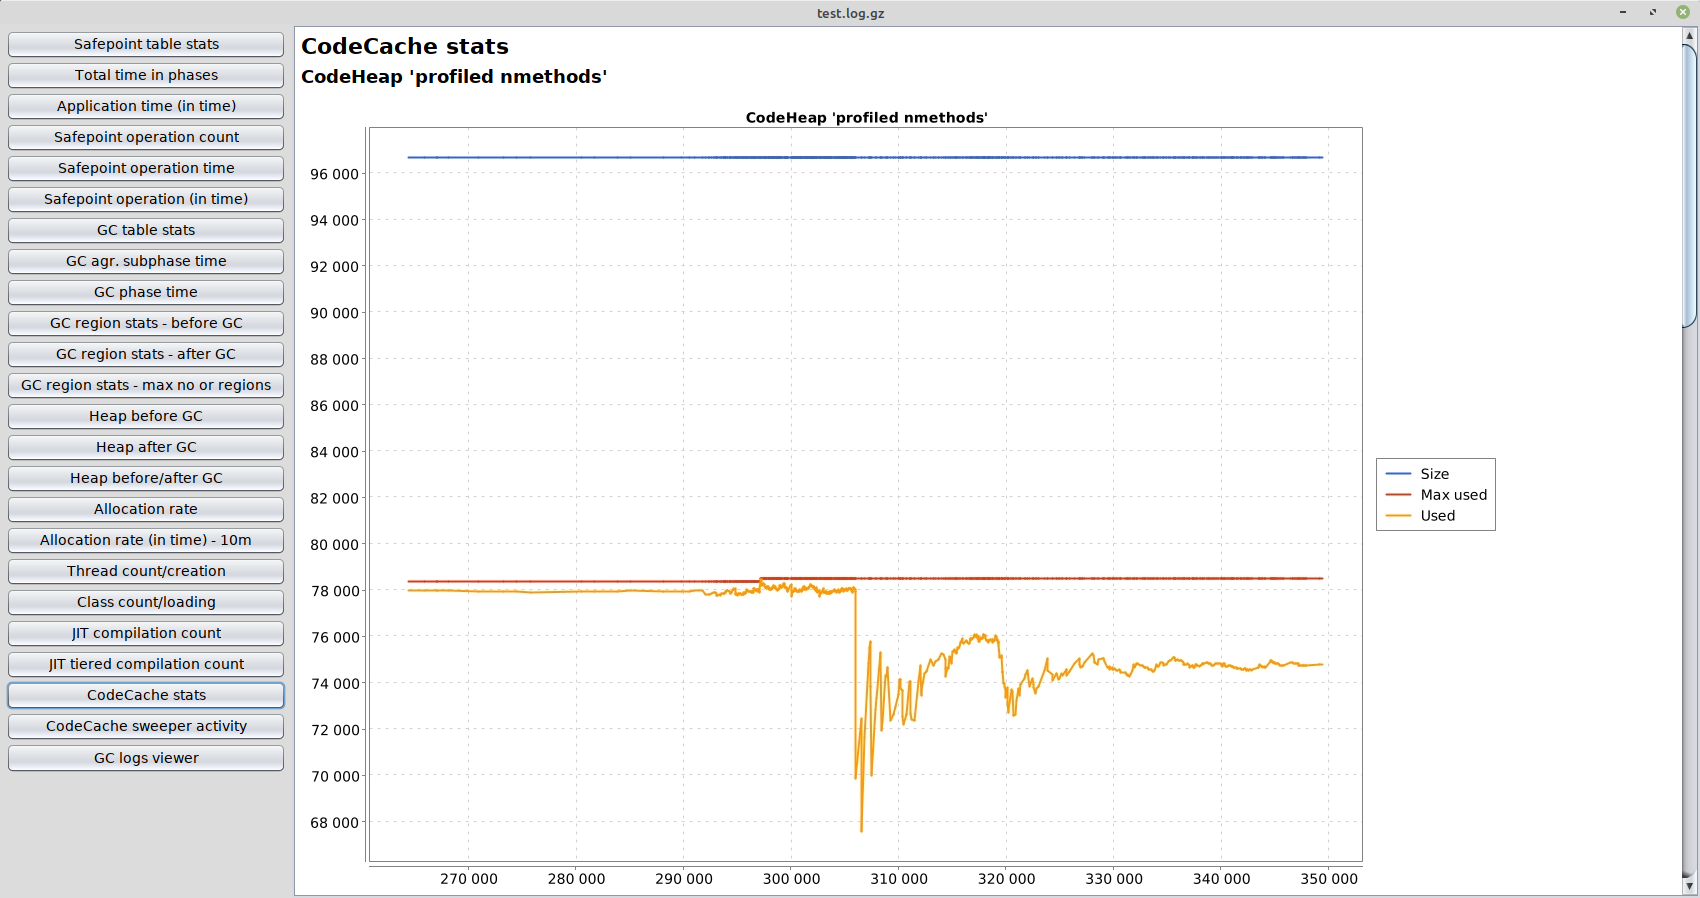
-Xlog:codecache+sweep*=trace
From code cache and sweeper logs this tool will create charts:
I recommend to use following Xlog configuration
-Xlog:codecache=info,
codecache+sweep*=trace,
class+unload,
class+load,
os+thread,
safepoint,
gc*,
gc+stringdedup=debug,
gc+ergo=trace,
gc+age=trace,
gc+phases=trace,
gc+humongous=trace,
jit+compilation=debug
:file=/tmp/app.log
:level,tags,time,uptime
:filesize=104857600,filecount=5
If you want to change Xlog configuration on runtime, you can do it with:
sudo -u JVM_USER jcmd `pgrep -x java` VM.log
output="file=/PATH/TO/gc.log"
output_options="filesize=104857600,filecount=5"
what="codecache=info,codecache+sweep*=trace,class+unload,class+load,os+thread,safepoint,gc*,gc+stringdedup=debug,gc+ergo=trace,gc+age=trace,gc+phases=trace,gc+humongous=trace,jit+compilation=debug"
decorators="level,tags,time,uptime,pid
- Logs from JDK 11, 12, 13 - works with flags below, tested on Parallel, CMS and G1.
- Logs from JDK 9, 10 - should work.
- Logs from JDK 8 and below - experimental (GC and safepoints log support, charts and stas are not accurate, because this logs sucks), tested on Parallel and G1, doesn't work with CMS
- For JDK 11+ decorators: level,tags,time,uptime are needed, check sample Xlog configuration above.
- UI is optimized for Full HD resolution.
- There is no exception handling at all :)
- If you have any idea what other charts/tables I can add please create an issue with explanation why this new feature may be helpful
- If you have logs that doesn't work create an issue with logs included

