Viewer for collapsed stack and JFR outputs of profiles. Dedicated to Async-profiler 2.x, but works also with Async-profiler 1.x and Java Flight Recorder.
To benefit from filters with ECID you need to use precompiled Async-profiler from PR, and make use of a new API created there.
JAVA_HOME should point to JDK 17.
git clone --depth 1 https://github.com/krzysztofslusarski/jvm-profiling-toolkit.git
cd jvm-profiling-toolkit/
mvn clean packagejava -jar viewer-application/target/viewer-application.jar
Java should point to JDK 11. After you run it, viewer is available on http://localhost:8079/.
Viewer is Spring Boot application, you can create application.yml with:
server:
port: 8079 ./profiler -t -d 30 -e cpu -o collapsed -f output.txt <pid>
-t- gives you output divided by thread-d 30- 30s duration-e cpu- profiled event, viewer should work with every event-o collapsed- as name suggest, this is collapsed stack viewer, so this is mandatory output-f output.txt- output file<pid>- pid of your JVM
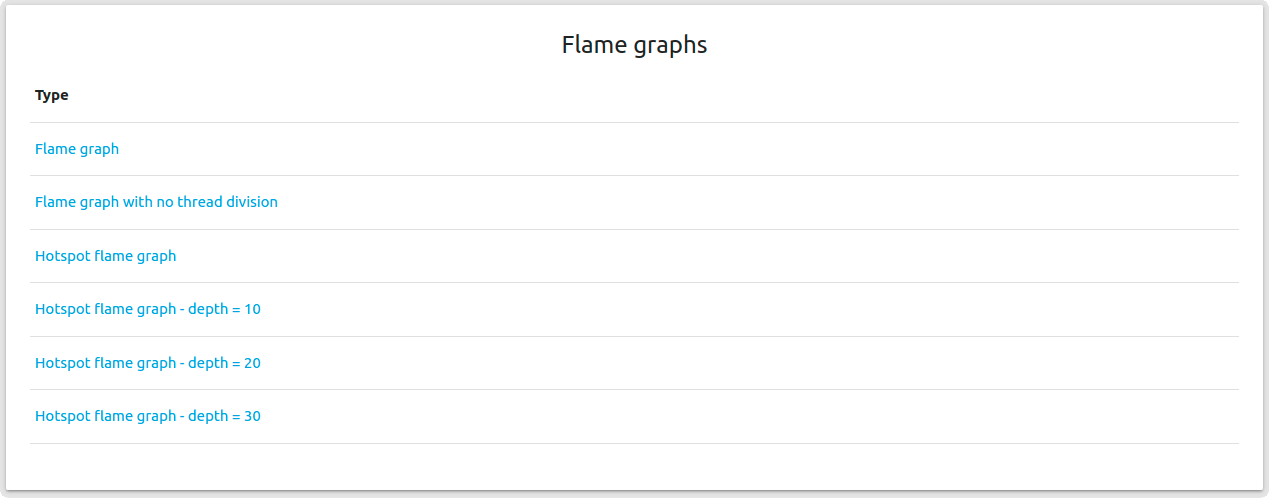
Viewer can generate flame graphs:
- Flame graph - common flame graph from your collapsed stack file
- Flame graph with no thread division - common flame graph with division by thread removed
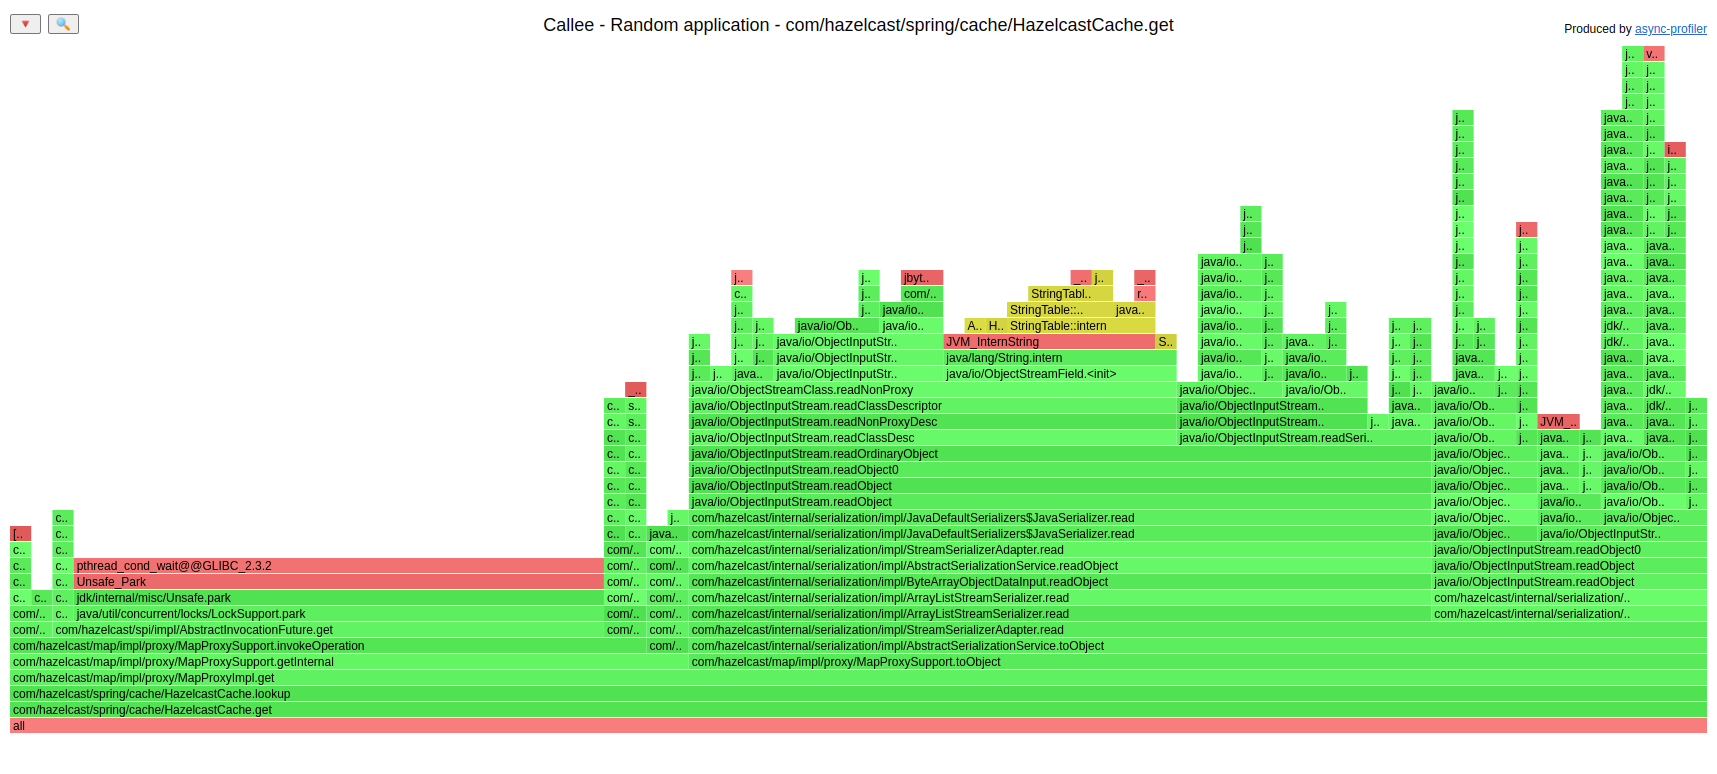
- Hotspot flame graph - flame graph that is inverted and reversed, presenting hotspots from collapsed stack file:
- depth = 10/20/30 - shortened graph with smaller stacks
Total time is number of stacks, that method was anywhere on the stack. Method name can be filtered.
Self time is number of stacks, that method was at the end of the stack. Method name can be filtered.
Callee graph shows what method is actually doing. This graph is aggregated, so it shows every usage of method.
Callers graph shows what which method used profiled method. This graph is aggregated, so it shows every usage of method.
You can add filters to your parser:
- Thread filter
- Access log style filter - end date and duration (in milliseconds)
- Warmup / cooldown filter - this one skips proper number of seconds from the beginning and the end
You can upload multiple JFR files with a single HTTP POST to the analyzer. Analyzer creates following collapsed stack from your JFR file:
- Wall-clock - if you used Async-profiler in
wallmode only - CPU - if you used Async-profiler in
wallmode the CPU file is made fromwalloutput with stacks that were consuming CPU only - Heap allocation (count) - if you used
allocmode - this one presents count of allocations that needed new TLAB or needed allocation outside TLAB - Heap allocation (size) - if you used
allocmode - this one presents size of allocations mentioned above - Locks - if you used
lockmode - CPU load
- JVM system
- JVM user
- JVM total
- Machine total
- Machine total - JVM total
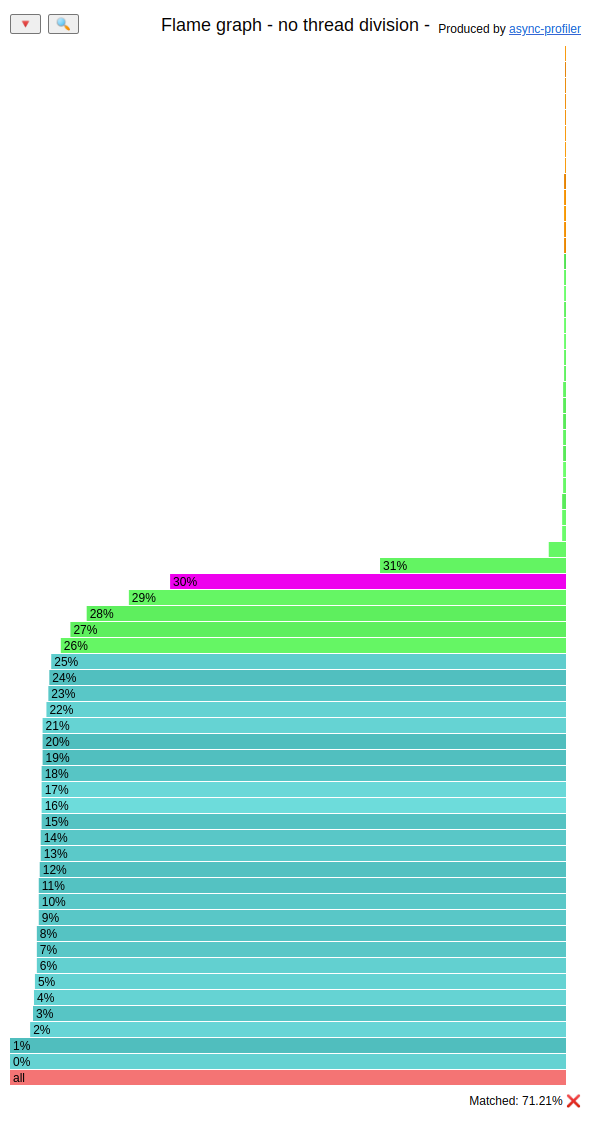
On example above you can see that the CPU (this one is JVM total) consumed at least 30% of the CPU for 71,21% of time.
JFR viewer will also show you:
- OS Info
- CPU Info
- Initial system properties
- JVM Info
If you upload multiple files then last information parsed is present in those sections.


