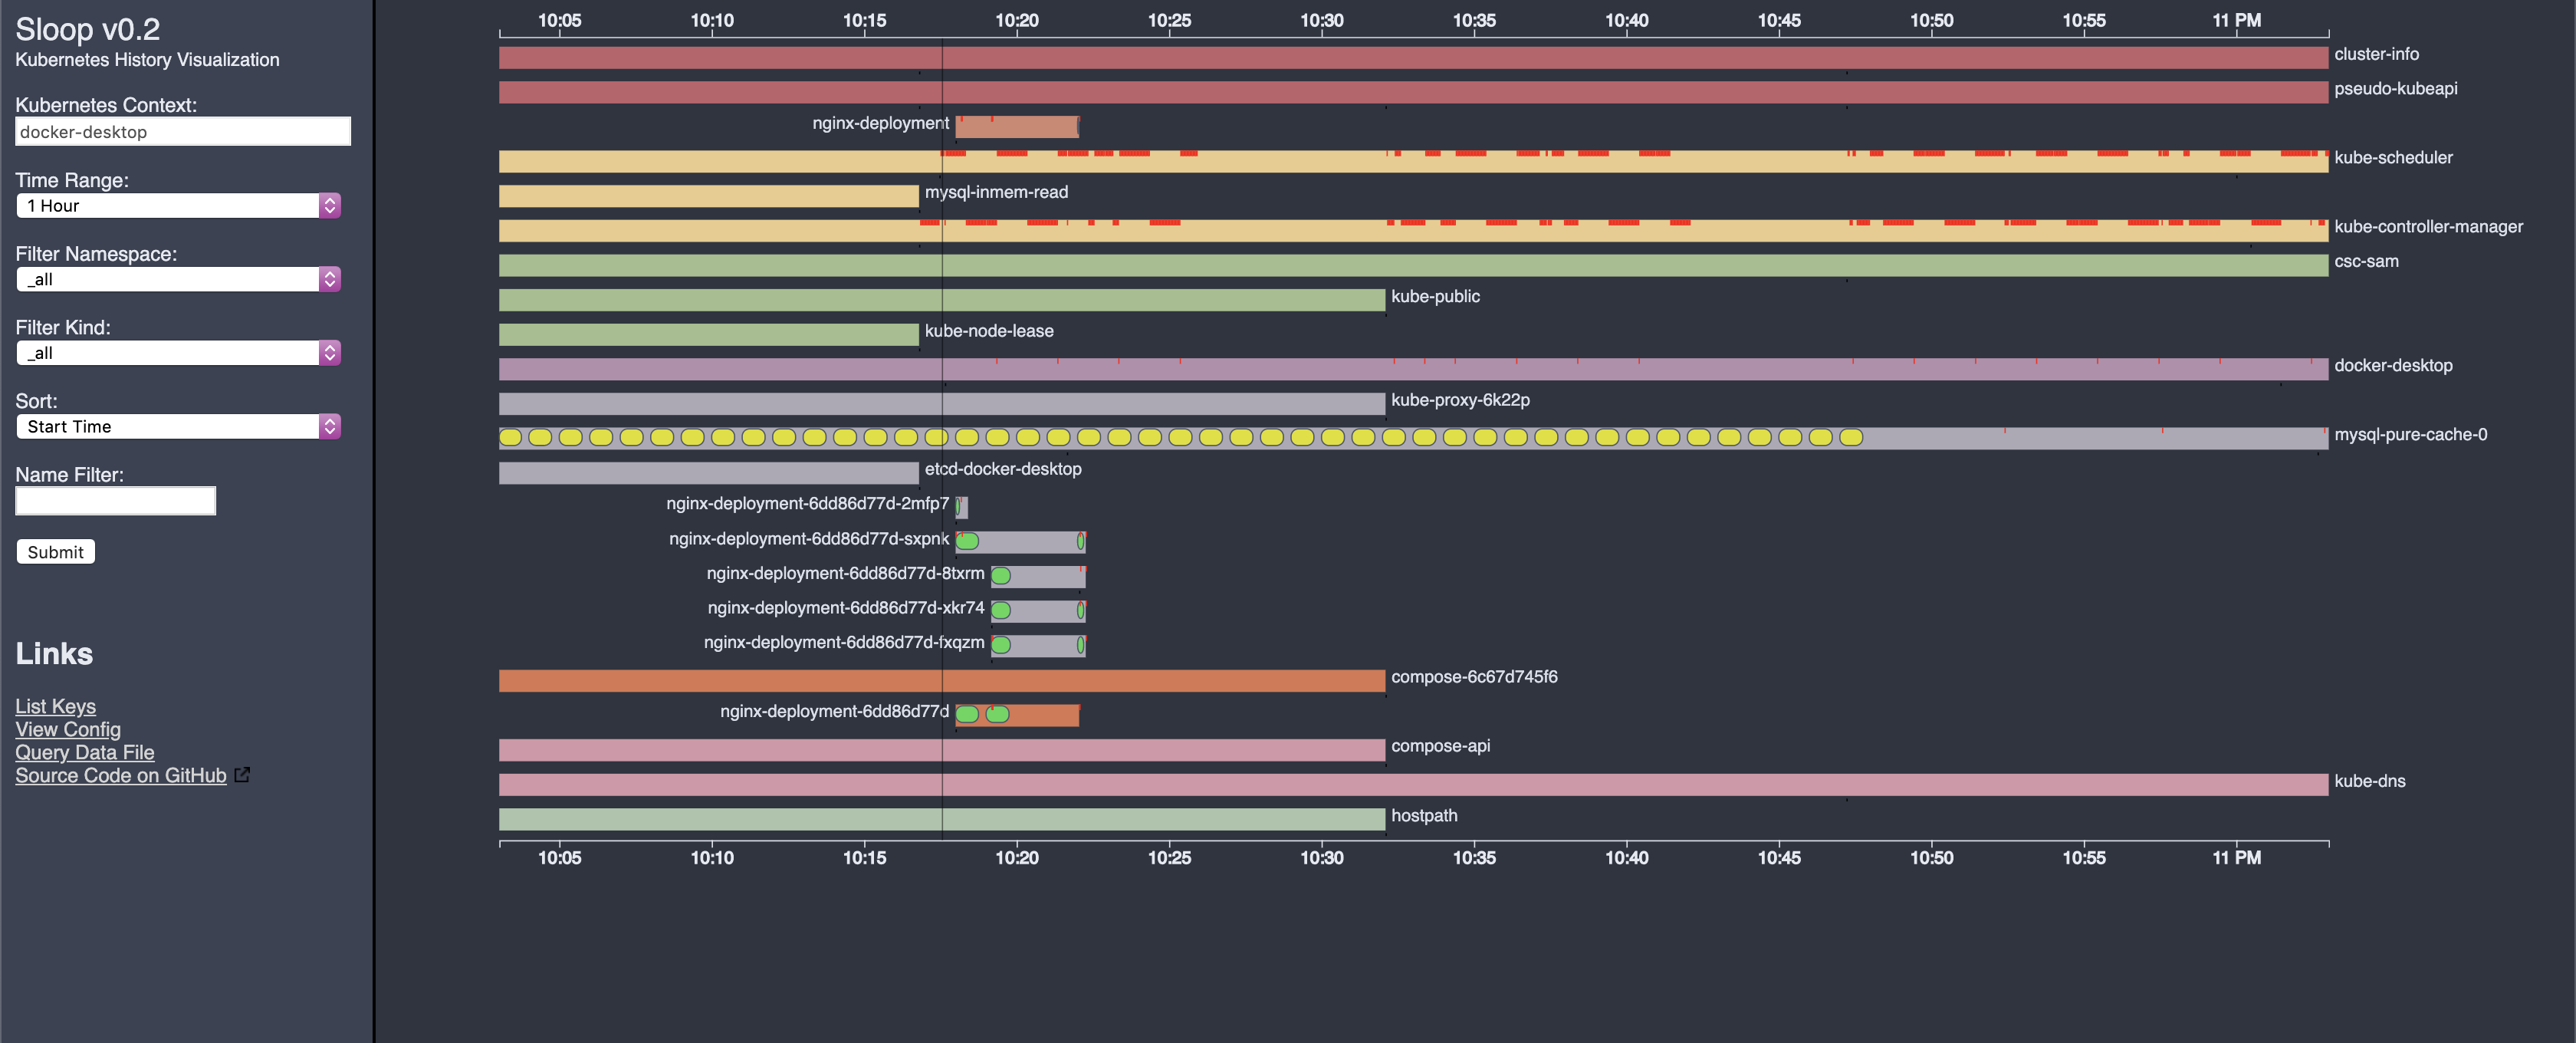
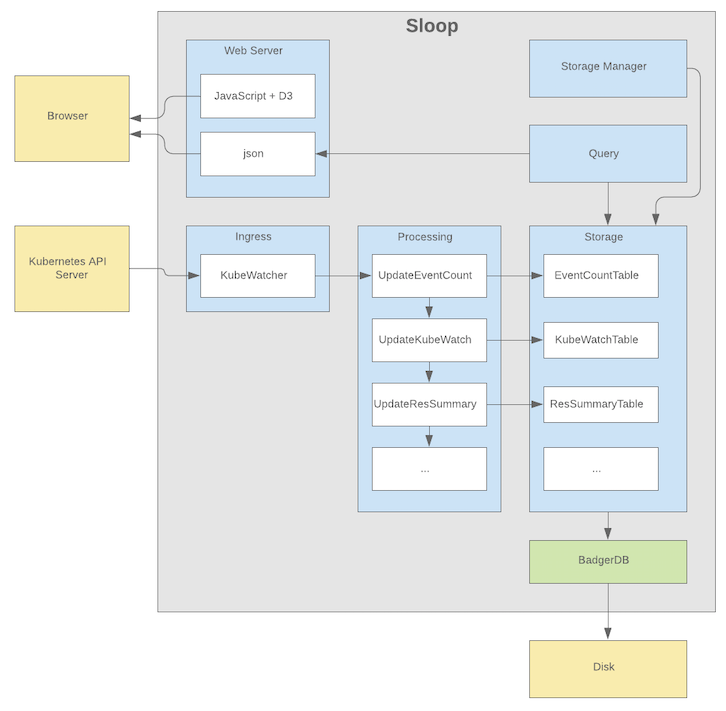
Sloop monitors Kubernetes, recording histories of events and resource state changes and providing visualizations to aid in debugging past events.
Key features:
- Allows you to find and inspect resources that no longer exist (example: discover what host the pod from the previous deployment was using).
- Provides timeline displays that show rollouts of related resources in updates to Deployments, ReplicaSets, and StatefulSets.
- Helps debug transient and intermittent errors.
- Allows you to see changes over time in a Kubernetes application.
- Is a self-contained service with no dependencies on distributed storage.
Sloop can be installed using any of these options:
Users can install sloop by using helm chart now, for instructions refer helm readme
TODO: See the Releases.
Building Sloop from source needs a working Go environment with the version defined in the go.mod file or greater.
See: https://golang.org/doc/install
Clone the sloop repository and build using make:
mkdir -p $GOPATH/src/github.com/salesforce
cd $GOPATH/src/github.com/salesforce
git clone https://github.com/salesforce/sloop.git
cd sloop
make
$GOPATH/bin/sloop
When complete, you should have a running Sloop version accessing the current context from your kubeConfig. Just point your browser at http://localhost:8080/
Other makefile targets:
- docker: Builds a Docker image.
- cover: Runs unit tests with code coverage.
- generate: Updates genny templates for typed table classes.
- protobuf: Generates protobuf code-gen.
To run from Docker you need to host mount your kubeconfig:
make docker-snapshot
docker run --rm -it -p 8080:8080 -v ~/.kube/:/kube/ -e KUBECONFIG=/kube/config sloop
In this mode, data is written to a memory-backed volume and is discarded after each run. To preserve the data, you can host-mount /data with something like -v /data/:/some_path_on_host/
To reflect any changes to webserver/webfiles, run the following command on terminal while within the webserver directory before submitting a pr:
go-bindata -pkg webserver -o bindata.go webfiles/This will update the bindata folder with your changes to any html, css or javascript files within the directory.
This is very similar to above but abstracts running docker with AWS credentials for connecting to EKS
make docker
export AWS_ACCESS_KEY_ID=<access_key_id> AWS_SECRET_ACCESS_KEY=<secret_access_key> AWS_SESSION_TOKEN=<session_token>
./providers/aws/sloop_to_eks.sh <cluster name>
Data retention policy stated above still applies in this case.
This is an advanced feature. Use with caution.
To download a backup of the database, navigate to http://localhost:8080/data/backup
To restore from a backup, start sloop with the -restore-database-file flag set to the backup file downloaded in the previous step. When restoring, you may also wish to set the -disable-kube-watch=true flag to stop new writes from occurring and/or the -context flag to restore the database into a different context.
Sloop's memory usage can be managed by tweaking several options:
badger-use-lsm-only-optionsIf this flag is set to true, values would be collocated with the LSM tree, with value log largely acting as a write-ahead log only. Recommended value for memory constrained environments: falsebadger-keep-l0-in-memoryWhen this flag is set to true, Level 0 tables are kept in memory. This leads to better performance in writes as well as compactions. Recommended value for memory constrained environments: falsebadger-sync-writesWhen SyncWrites is true all writes are synced to disk. Setting this to false would achieve better performance, but may cause data loss in case of crash. Recommended value for memory constrained environments: falsebadger-vlog-fileIO-mappingTableLoadingMode indicates which file loading mode should be used for the LSM tree data files. Setting to true would not load the value in memory map. Recommended value for memory constrained environments: true
Apart from these flags some other values can be tweaked to fit in the memory constraints. Following are some examples of setups.
- Memory consumption max limit: 1GB
               // 0.5<<20 (524288 bytes = 0.5 Mb)
               "badger-max-table-size=524288",
               "badger-number-of-compactors=1",
               "badger-number-of-level-zero-tables=1",
               "badger-number-of-zero-tables-stall=2",
- Memory consumption max limit: 2GB
               // 16<<20 (16777216 bytes = 16 Mb)
               "badger-max-table-size=16777216",
               "badger-number-of-compactors=1",
               "badger-number-of-level-zero-tables=1",
               "badger-number-of-zero-tables-stall=2",
- Memory consumption max limit: 5GB
               // 32<<20 (33554432 bytes = 32 Mb)
               "badger-max-table-size=33554432",
               "badger-number-of-compactors=1",
               "badger-number-of-level-zero-tables=2",
               "badger-number-of-zero-tables-stall=3",
Apart from the above settings, max-disk-mb and max-look-back can be tweaked according to input data and memory constraints.
Sloop uses the Prometheus library to emit metrics, which is very helpful for performance debugging.
In the root of the repo is a Prometheus config file prometheus.yml.
On OSX you can install Prometheus with brew install prometheus. Then start it from the sloop directory by running prometheus
Open your browser to http://localhost:9090.
An example of a useful query is rate(kubewatch_event_count[5m])
Refer to CONTRIBUTING.md
BSD 3-Clause


