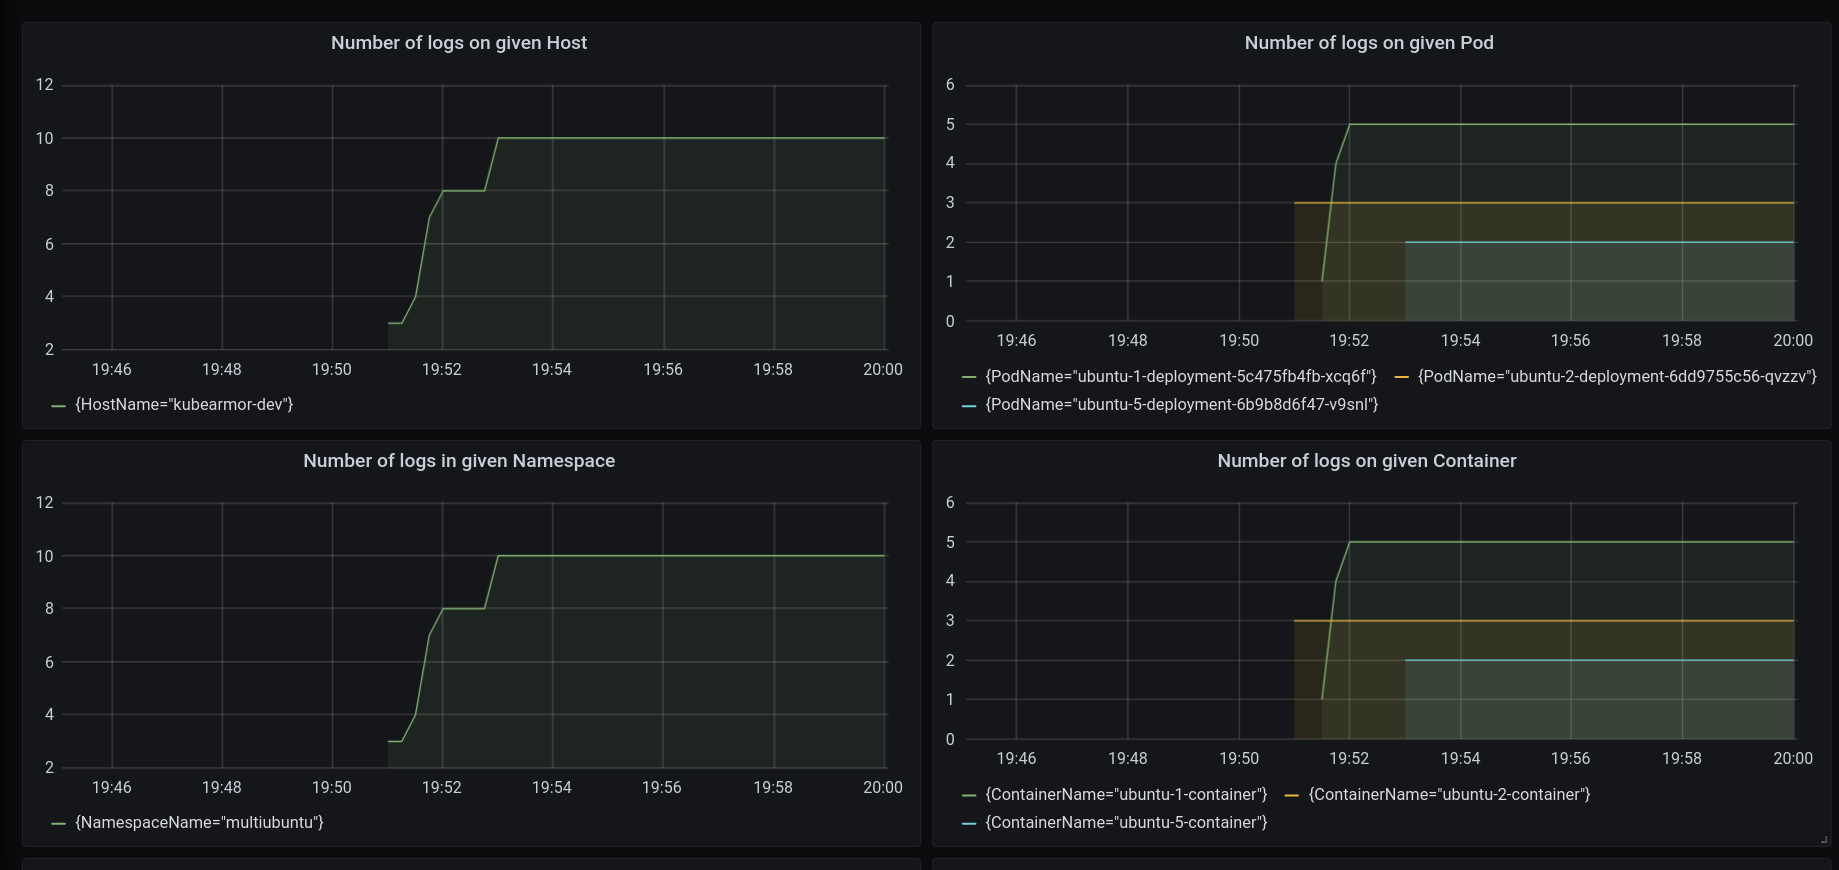
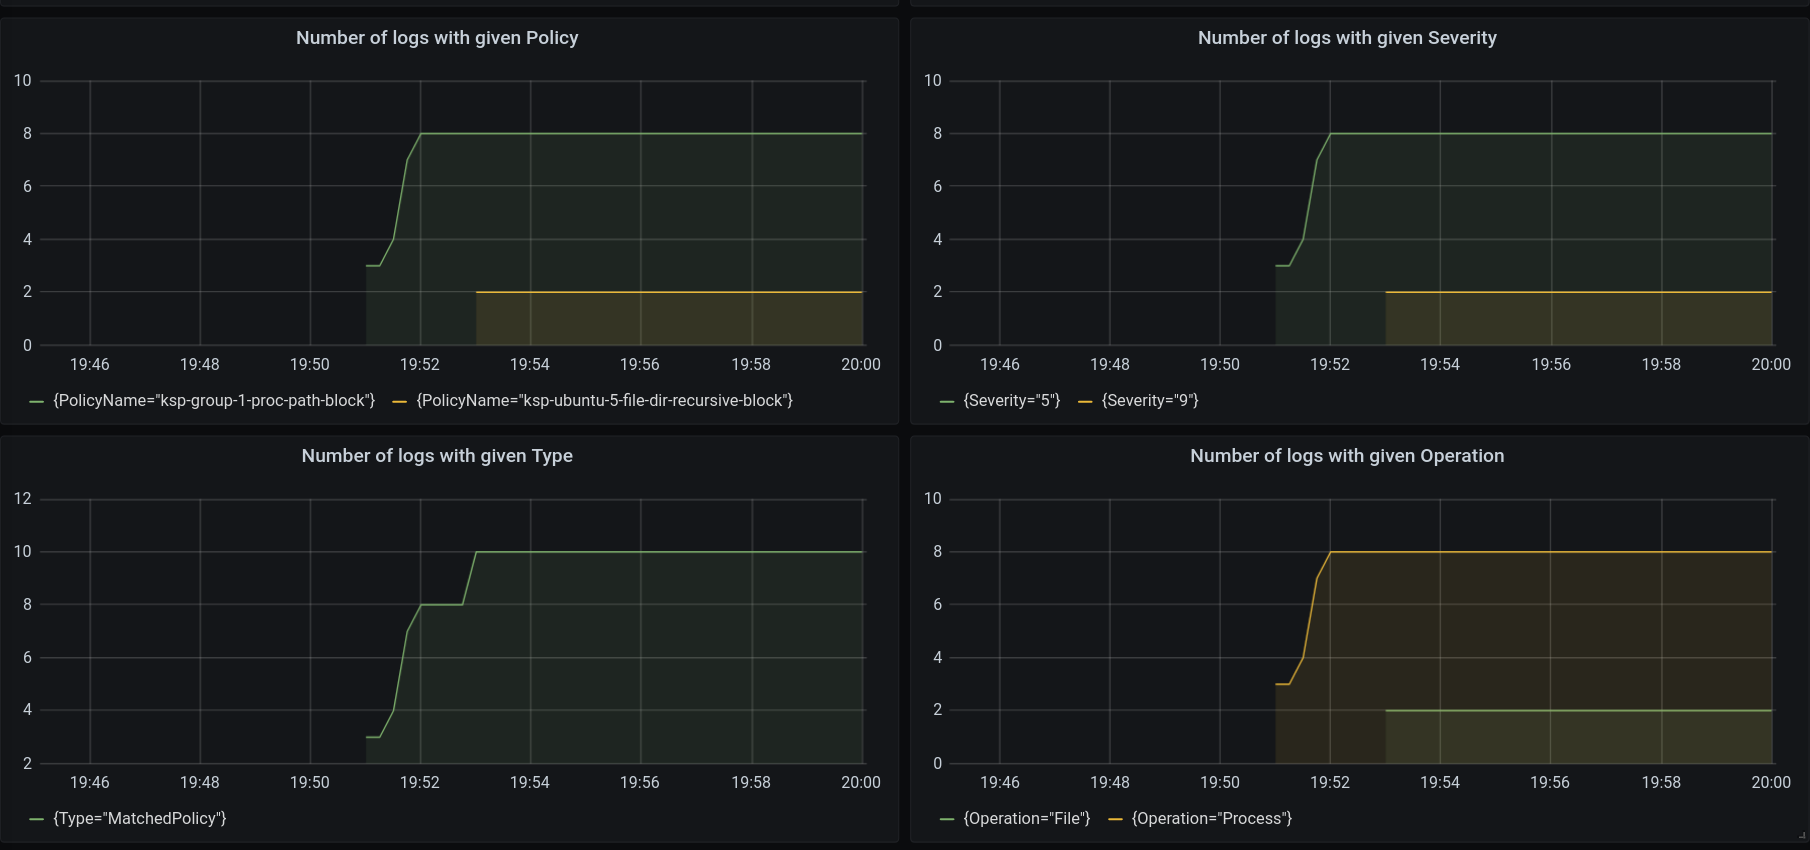
Prometheus Exporter calculates various metrics based on alerts generated by KubeArmor and provides the metrics to Prometheus.
Here, you can simply deploy the Prometheus exporter.
$ cd kubearmor-prometheus-exporter/deployments
~/kubearmor-prometheus-exporter/deployments$ kubectl apply -n [target namespace] -f exporter-deployment.yaml
If you do not have a Prometheus setup, you can quickly set up the Prometheus with Grafana.
$ cd kubearmor-prometheus-exporter/deployments/prometheus
.../deployments/prometheus$ kubectl create namespace kubearmor
.../deployments/prometheus$ kubectl apply -f prometheus-grafana-deployment.yaml
The prometheus-grafana-deployment.yaml is highly inspired from the Cilium's example deployment of Prometheus and Grafana (https://.../cilium/cilium/.../examples/kubernetes/.../prometheus/monitoring-example.yaml).
- Grafana: A visualization dashboard with Cilium Dashboard pre-loaded.
- Prometheus: a time series database and monitoring system.
Expose the port on your local machine
kubectl -n kubearmor port-forward service/prometheus --address 0.0.0.0 --address :: 9091:9090
Expose the port on your local machine
kubectl -n kubearmor port-forward service/grafana --address 0.0.0.0 --address :: 3000:3000
Note: In vagrant, you will need to configure port-forwarding to access the Prometheus and Grafana services.
For Prometheus
vagrant ssh -- -L 9090:127.0.0.1:9091
You should be able to see the following metrics on Prometheus UI at localhost:9090.
For Grafana
vagrant ssh -- -L 3000:127.0.0.1:3000
To view the Grafana Dashboard, head over to localhost:3000. You should be able to view the KubeArmor Dashboard.
| About Metrics | Label | Metric Name |
|---|---|---|
| Number of alerts per Host | HostName | kubearmor_alerts_in_host_total |
| Number of alerts per Namespace | NamespaceName | kubearmor_alerts_in_namespace_total |
| Number of alerts per Pod | PodName | kubearmor_alerts_in_pod_total |
| Number of alerts per Container | ContainerName | kubearmor_alerts_in_container_total |
| Number of alerts per Policy | PolicyName | kubearmor_alerts_with_policy_total |
| Number of alerts per severity | Severity | kubearmor_alerts_with_severity_total |
| Number of alerts per type (MatchedPolicy, MatchedHostPolicy, MatchedNativePolicy) | Type | kubearmor_alerts_with_type_total |
| Number of alerts per operation (Process, File, Network, Capabilities) | Operation | kubearmor_alerts_with_operation_total |
| Number of alerts per action (Allow, Audit, Block) | Action | kubearmor_alerts_with_action_total |


