Influence of ocean acidification on Eastern oyster (Crassostrea virginica) reproductive tissue
Background
Epigenetic modification, specifically DNA methylation, is one possible mechanism for transgenerational plasticity. Before inheritance of methylation patterns can be characterized we need a better understanding of how environmental change modifies the parental epigenome. Specifically, methylation patterns should be understood in reproductive tissue. Collaboarting with Dr. Kathleen Lotterhos' lab at Northeastern University, we examined the effect of ocean acidification on Eastern oyster (Crassostrea virginica) reproductive tissue.
The Lotterhos lab exposed twelve oysters to two different pCO2 for four weeks at 15ºC during the summer of 2017. Half of the oysters were exposed to 400 µatm (control), and the other half to 2800 µatm. The Lotterhos lab sent gonad samples for MBDSeq to identify if different pCO2 conditions drive differential methylation patterns. I prepared samples for bisulfite sequencing. Information about sample preparation and tangential analyses can be found in the broader project repository.
Question
Does acute exposure to elevated pCO2 conditions induce differential methylation in Crassostrea virginica reproductive tissue?
Objectives
My goal is to identify differentially methylated regions and loci between oysters exposed to ambient and elevated pCO2 conditions.
Methods
Overview
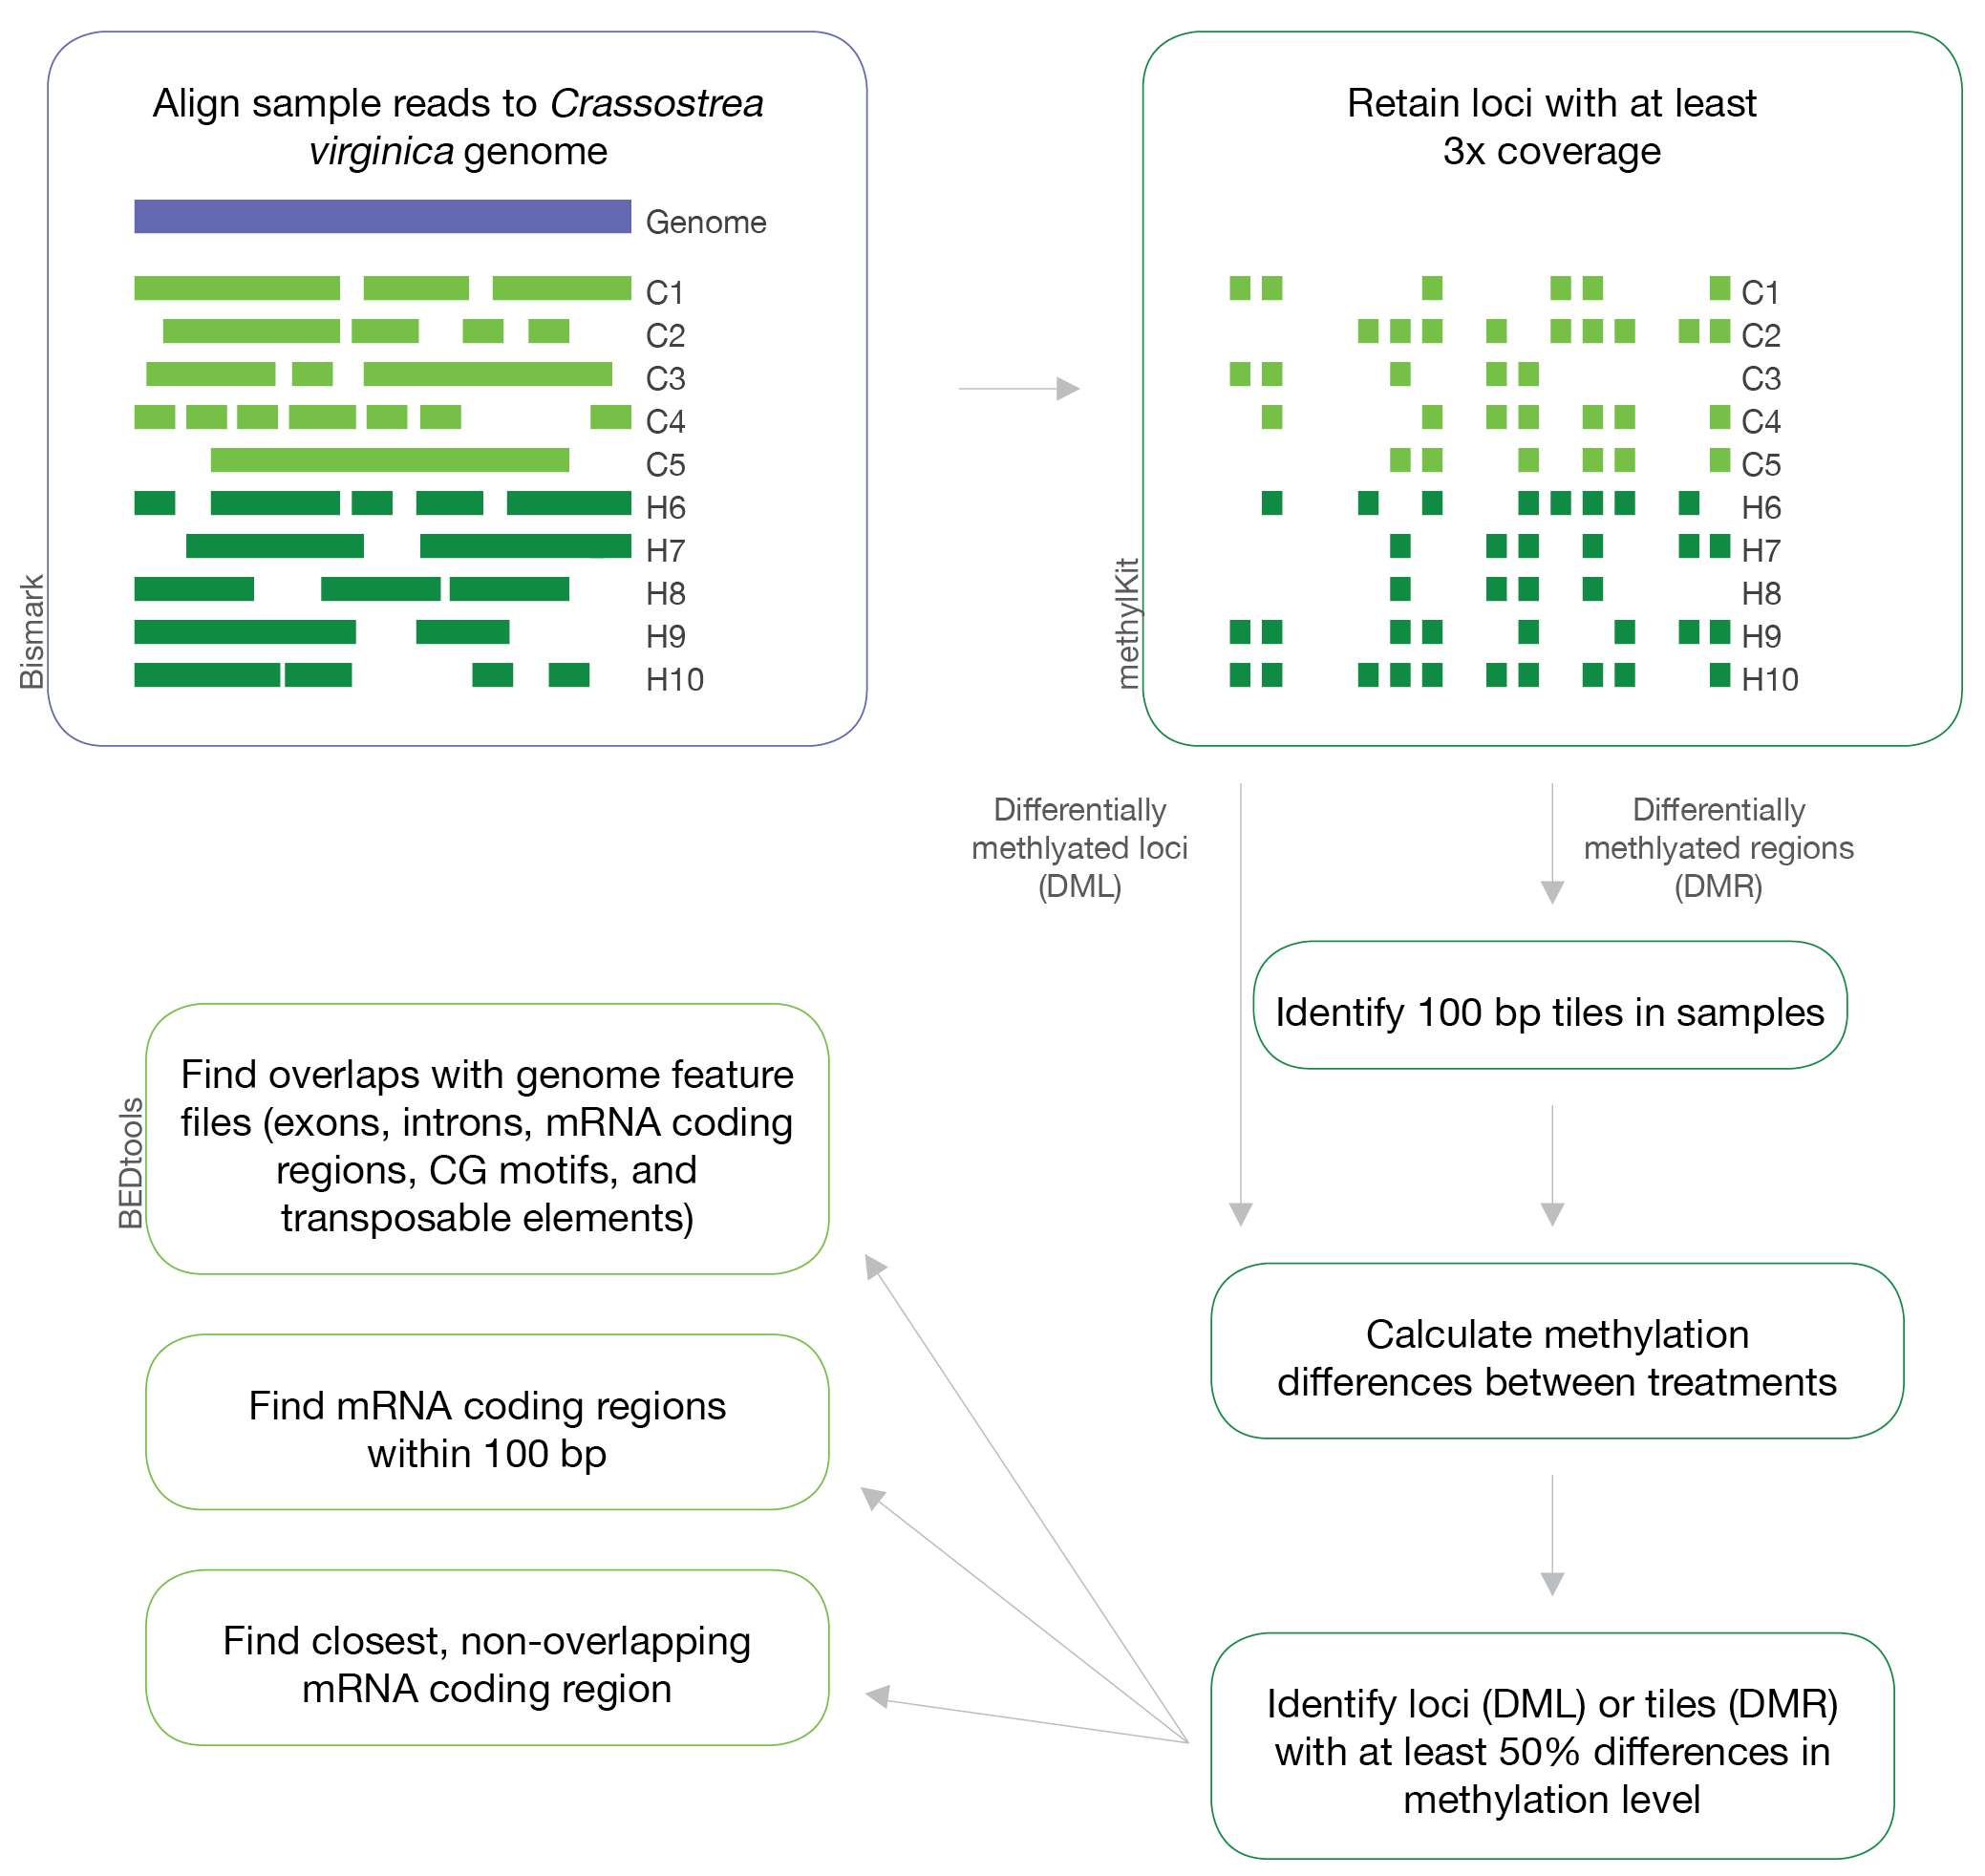
- Receive sequencing data and trim files as appropriate
- Align trimmed files to a reference bisulfite genome in
bismark - Isolate differentially methylated loci (DML) and regions (DMR) from alignments in
methylKit - Characterize DML and DMR with
bedtools
Figure 1. Overview of methods used in this project.
Project Timeline
Week 4:
- Start
bismarkalignment on Mox: Protocol can be found here - Use different samples to create working
methylKitprotocol. This work was done in a different Github repository.
Week 5:
- Added R Markdown file for
methylKitanalysis - Added Jupyter notebook for DML and DMR characterization
Week 6:
- Ran
methylKitto identify DML and DMR on samples from Mox with this R Markdown script - Characterized locations of DML and DMR in this Jupyter notebook
Week 7:
- Completed transposable elements analysis in this Jupyter notebook. Results can be found here.
- Conducted flanking analysis with
bedtools flankandbedtools closestin this Jupyter notebook. Results can be found here
Week 9:
- Visualize data and complete all remaining analyses
Results
Analysis parameter validation
A full descriiption of methylKit parameter validation can be found here, with a focus on methylKit tiling analysis here.
bismark
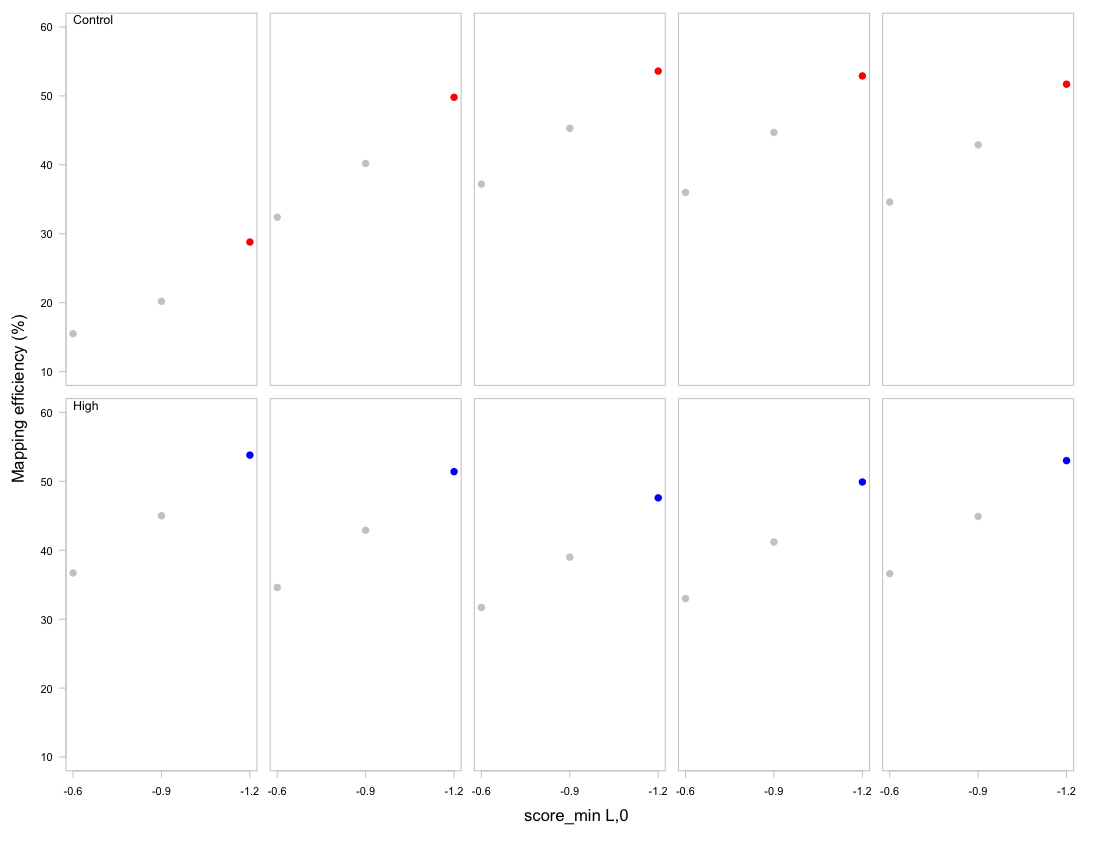
Table 1. Mapping efficiency (%) for Bismark v.19.0 and Bowtie 2-2.3.4 (Linux x84_64 version) alignment of trimmed sample sequences to the C. virginica bisulfite genome. Mapping efficiency (%) based on different -score_min settings. For final analyses, an alignment score function of f(x) = 0 - 1.2x, where x is the read length, was set using -score_min L,0,-1.2 to set define alignment stringency and optimize mapping efficiency for all samples.
| Treatment | Sample | L,0,-0.6 | L,0,-0.9 | L,0,-1.2 |
|---|---|---|---|---|
| Control | 1 | 15.5 | 20.2 | 28.8 |
| Control | 2 | 32.4 | 40.2 | 49.8 |
| Control | 3 | 37.2 | 45.3 | 53.6 |
| Control | 4 | 36.0 | 44.7 | 52.9 |
| Control | 5 | 34.6 | 42.9 | 51.7 |
| High | 6 | 36.7 | 45.0 | 53.8 |
| High | 7 | 34.6 | 42.9 | 51.4 |
| High | 8 | 31.7 | 39.0 | 47.6 |
| High | 9 | 33.0 | 41.2 | 49.9 |
| High | 10 | 36.6 | 44.9 | 53.0 |
Figure 2. Mapping efficiency (%) for Bismark v.19.0 and Bowtie 2-2.3.4 (Linux x84_64 version) alignment of trimmed sample sequences to the C. virginica bisulfite genome.
methylKit
DML:
Table 2. The mincov metric, total number of loci produced, and the number of DMLs that were at least 50% different between treatment andc control samples. More restrictive mincov metrics produced less significantly different DMLs. mincov = 3 was used in final analysis.
mincov |
Total Loci | Number of Significantly Different DMLs |
|---|---|---|
| 1 | 1112085 | 4904 |
| 3 | 670301 | 1398 |
| 5 | 503780 | 816 |
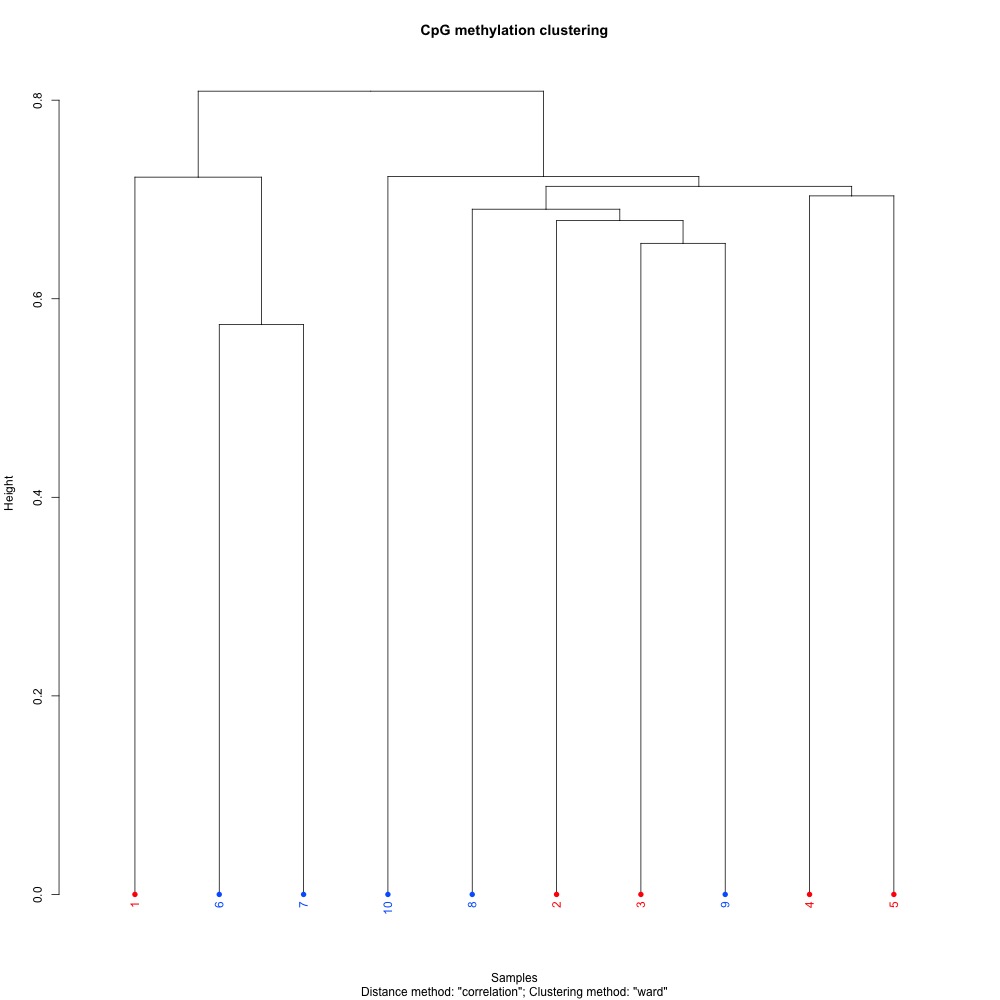
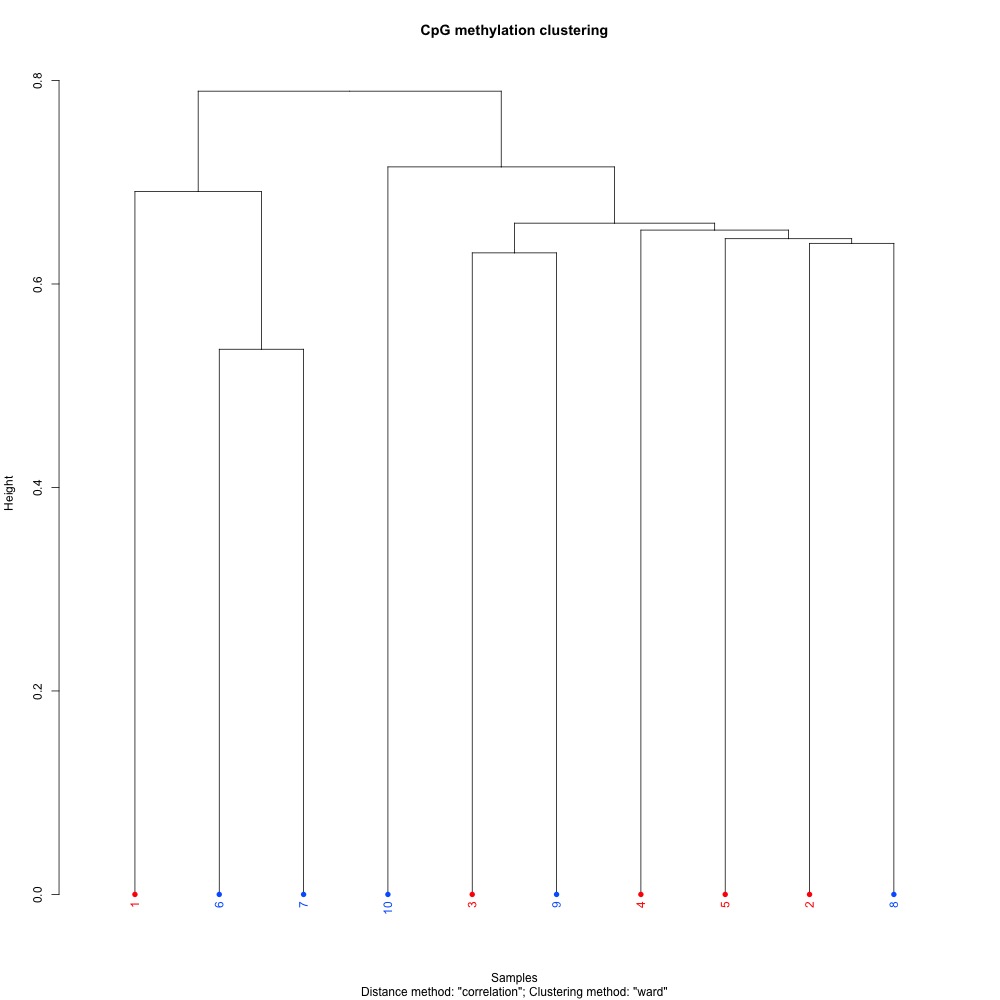
Figure 3. Dendogram for clustering of full sample methylation using mincov = 3 for DML.
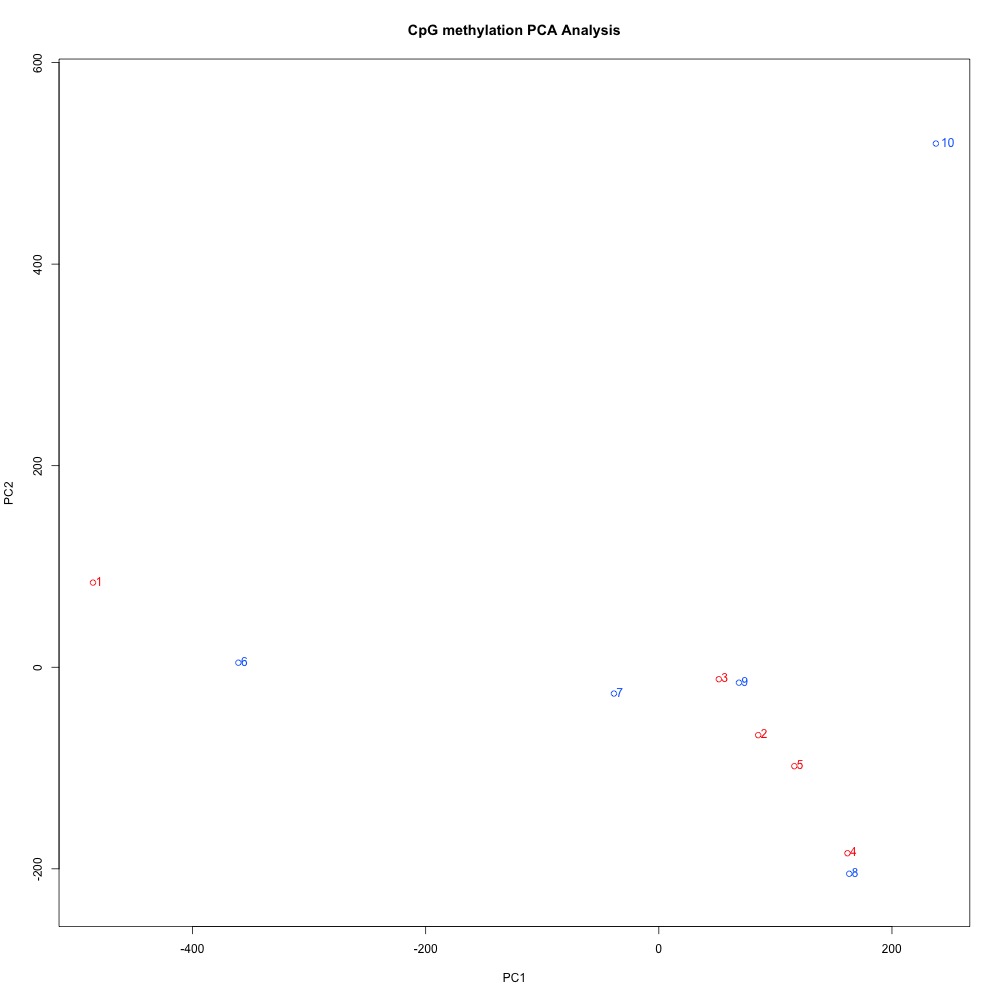
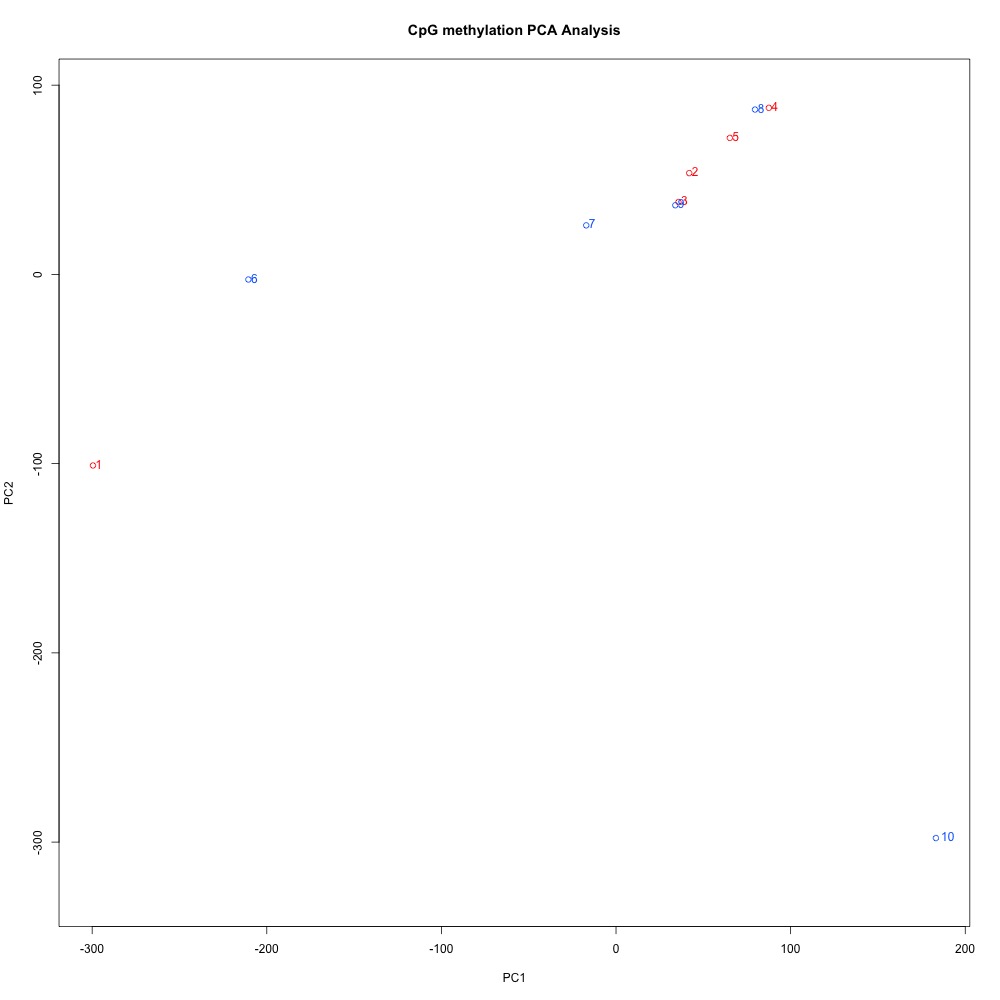
Figure 4. Principal Components Analysis of full sample methylation using mincov = 3 for DML.
DMR:
Table 3. Window size, step size, total number of regions produced, and the number of DMLs that were at least 50% different between treatment and control samples. The number of regions and siginificantly different DMRs seem to be dictated by the window size, and not the step size.
| Window Size (bp) | Step Size (bp) | Total Regions | Number of Significantly Different DMRs |
|---|---|---|---|
| 100 | 100 | 217538 | 162 |
| 1000 | 1000 | 104144 | 118 |
| 1000 | 100 | 104144 | 118 |
Figure 5. Dendogram for clustering of full sample methylation using mincov = 3 and 100 bp window and step sizes for DMR.
Figure 6. Principal Components Analysis of full sample methylation using mincov = 3 and 100 bp window and step sizes for DMR.
DML and DMR location characterization
A full description can be found here.
Figure 6. Full sample methylation viewed in Integrative Genome Viewer.
DML:
- DML-exon overlaps
- DML-intron ovleraps
- DML-mRNA overlaps
- Unique genes in DML-mRNA overlaps
- DML-TE overlaps
Table 4. Location of differentially methylated loci (DML) in various genomic features from BEDtools intersect v2.26.0. Genome feature files were downloaded from NCBI. The C. virginica genome has 60,201 genes total. For each locus, hypermethylated refers to significantly higher methylation in treatment samples, while hypomethylated indicates significantly lower methylation. Transposable elements refers to those identified using C. gigas as the species designation.
| Genomic Feature | Result |
|---|---|
| Total DML | 1398 |
| Hypomethylated DML | 747 |
| Hypermethylated DML | 651 |
| Total genes with DML | 2,683 |
| DML in mRNA coding regions | 1263 (90.34%) |
| DML in exons | 786 (56.22%) |
| DML in introns | 498 (35.62%) |
| DML in transposable elements | 91 (6.51%) |
DMR:
- DMR-exon overlaps
- DMR-intron ovleraps
- DMR-mRNA overlaps
- Unique genes in DMR-mRNA overlaps
- DMR-TE overlaps
Table 5. Location of differentially methylated regions (DMR) in various genomic features from BEDtools intersect v2.26.0. Regions were identified in a tiling window analysis in methylKit v.1.7.9 in R Genome feature files were downloaded from NCBI. The C. virginica genome has 60,201 genes total. For each 100 bp region, hypermethylated refers to significantly higher methylation in treatment samples, while hypomethylated indicates significantly lower methylation. Transposable elements refers to those identified using C. gigas as the species designation.
| Genomic Feature | Result |
|---|---|
| Total DMR | 162 |
| Hypomethylated DMR | 23 |
| Hypermethylated DMR | 139 |
| Total genes with DMR | 305 |
| DMR in mRNA coding regions | 139 (85.80%) |
| DMR in exons | 64 (39.51%) |
| DMR in introns | 112 (69.14%) |
| DMR in transposable elements | 23 (14.20%) |
Transposable elements:
Table 6. Percent overlap between transposable element and exons, introns, and mRNA coding regions. Transposable elements refers to those identified using C. gigas as the species designation.
| Genomic Feature | Overlap |
|---|---|
| mRNA Coding Regions | 7.79 |
| Exons | 6.00 |
| Introns | 14.2 |
Flanking analysis
A full description can be found here.
bedtools flank
1000 bp flanks for mRNA coding regions
DML:
DMR:
bedtools closest
DML:
Closest non-overlapping DML to mRNA coding regions
DMR:
Closest non-overlapping DMR to mRNA coding regions
Next Steps
- Determine if a formal gene enrichment is necessary
- If necessary, select the most appropriate gene enrichment method
- Describe functions of most interesting genes with DML and DMR
- Update draft manuscript
Repository Structure
analyses
R code and output from multiple analyses. Each analysis will be in its own subdirectory.
- 2018-10-25-MethylKit: R Markdown file and output from
methylKitidentification of DML and DMR. - 2018-11-01-DML-and-DMR-Analysis: Output from
bedtoolscharacterization of DML and DMR location in the C. virginica genome
data
Raw data used for project analyses, as well as links to data files.
images
Images generated outside of standard analyses.
notebooks
Jupyter notebooks that detail reproducible methods for data analysis.
- 2018-11-01-DML-and-DMR-Analysis.ipynb: Pipeline for
bedtoolsanalysis of DML and DMR locations in various genome feature tracks. Includes option to specify variable path names for easy reproducibility.
scripts
Scripts used for Mox.
- 2018-10-31-Revised-Bismark-Parameters-Samtools: Used to run
bismarkalignment on MBD-Seq data. This is an edited version of 2018-10-12-Revised-Bismark-Parameters that does not redirect standard error to a new file and includes an explicit path tobowtie2andsamtoolsin the alignment step.
tutorials
Data, notebooks, and analyses from class tutorials.
