A light version of the Hilbert-Huang Transform for Matlab. This version uses the Normalized Hilbert Transform to define and calculate the amplitude and phase.
There are two essential functions to the hht code. It is the emd(·) and the hilbertSpectrum(·). The emd(·) function decomposes a one-dimensional array down to the fewest monocomponents ci(t) and one monotonic function r(t) that is needed to describe it.
Lets considering the equation
v(t) = sin(ω0 t) + 0.5 cos(ω1 t2)
It is shown in the figure below
As shown in the example code, we can decompose the voltage waveform v(t) using
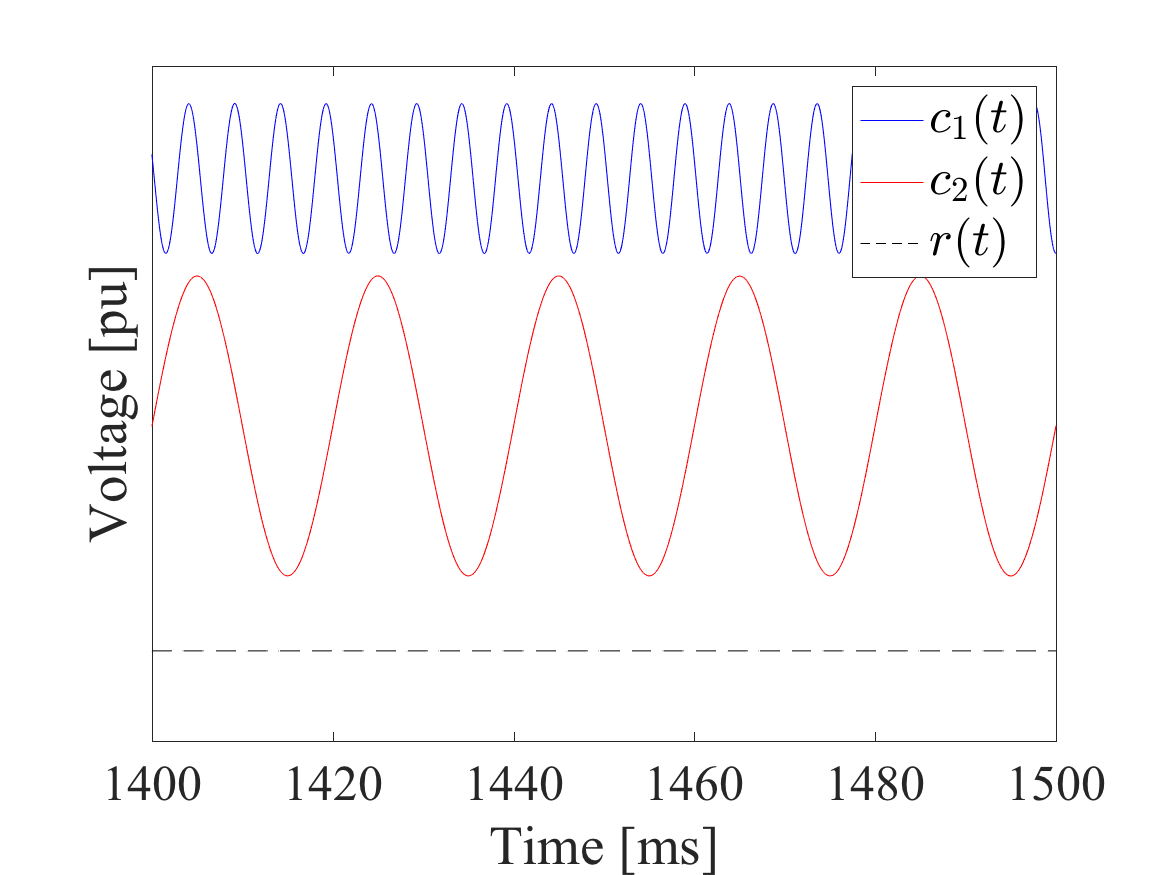
[intrinsicModeFunctions, res] = emd(voltageWaveform);This will decompose the voltage waveform v(t) down to two intrinsic mode functions (IMFs) and a residue so that
v(t) = Σ_ci(t)_ + r(t)
where ci(t) is IMF number i and r(t) is the residue. The IMFs and residue of the example waveform are shown in the figure below.
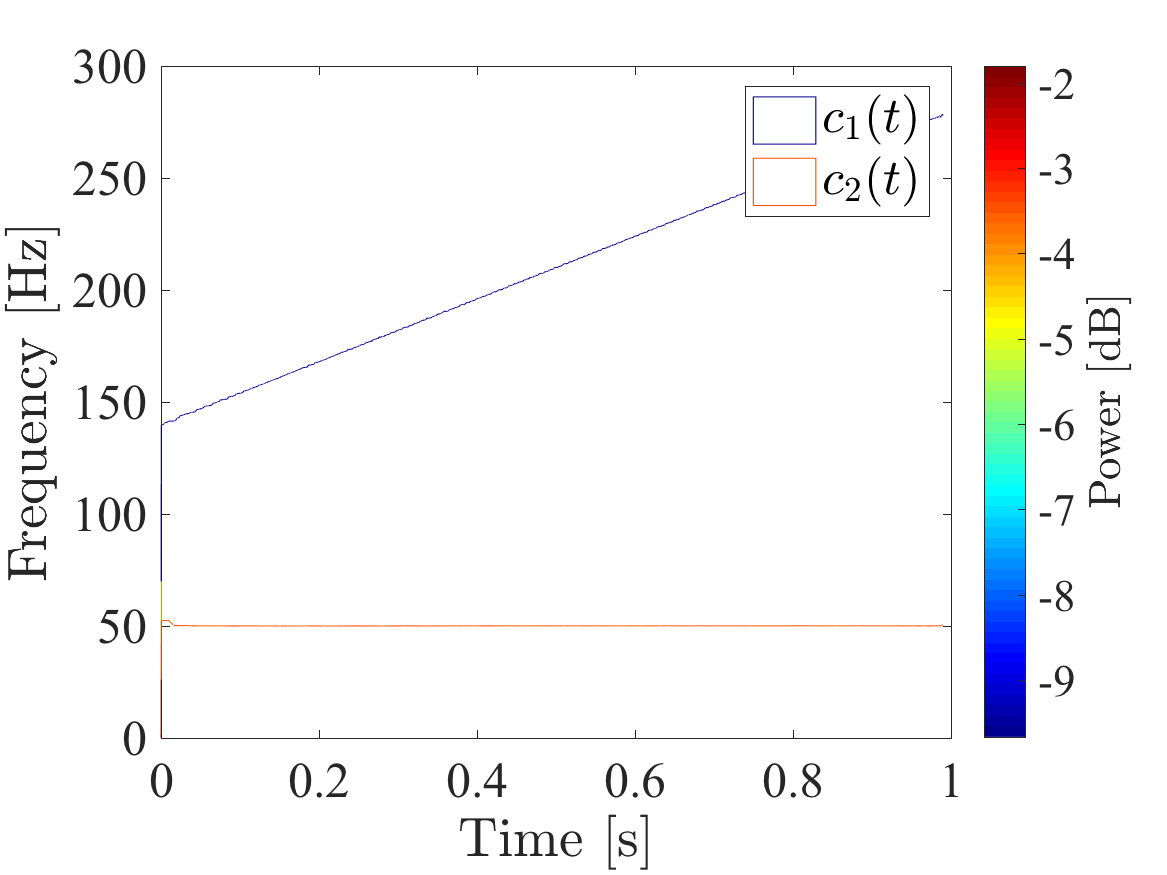
The IMFs can be visualized using a Hilbert Spectrum. In the Hilbert Spectrum shows the instantaneous frequency f(t) the frequency components power (amplitude squared) as a function of time. To use the Hilbert Spectrum function write
medianFilterLength = 0.02 * samplingFrequency;
hilbertSpectrum(intrinsicModeFunctions, samplingFrequency, medianFilterLength)
where the medianFilterLength is the length of a median filter used to remove artifacts. In this example, the filter length is 2 % of the sampling rate. The figure below shows the Hilbert Spectrum of the example waveform v(t).
- Argument for fixed EMD
- Ensure that residue output is correct


