In this exercise we'll look at introducing service level indicators within the Provenance codebase.
Capture Provenance metrics!
- create a Prometheus job
- using Grafana, create a Prometheus data source
- create a Grafana dashboard
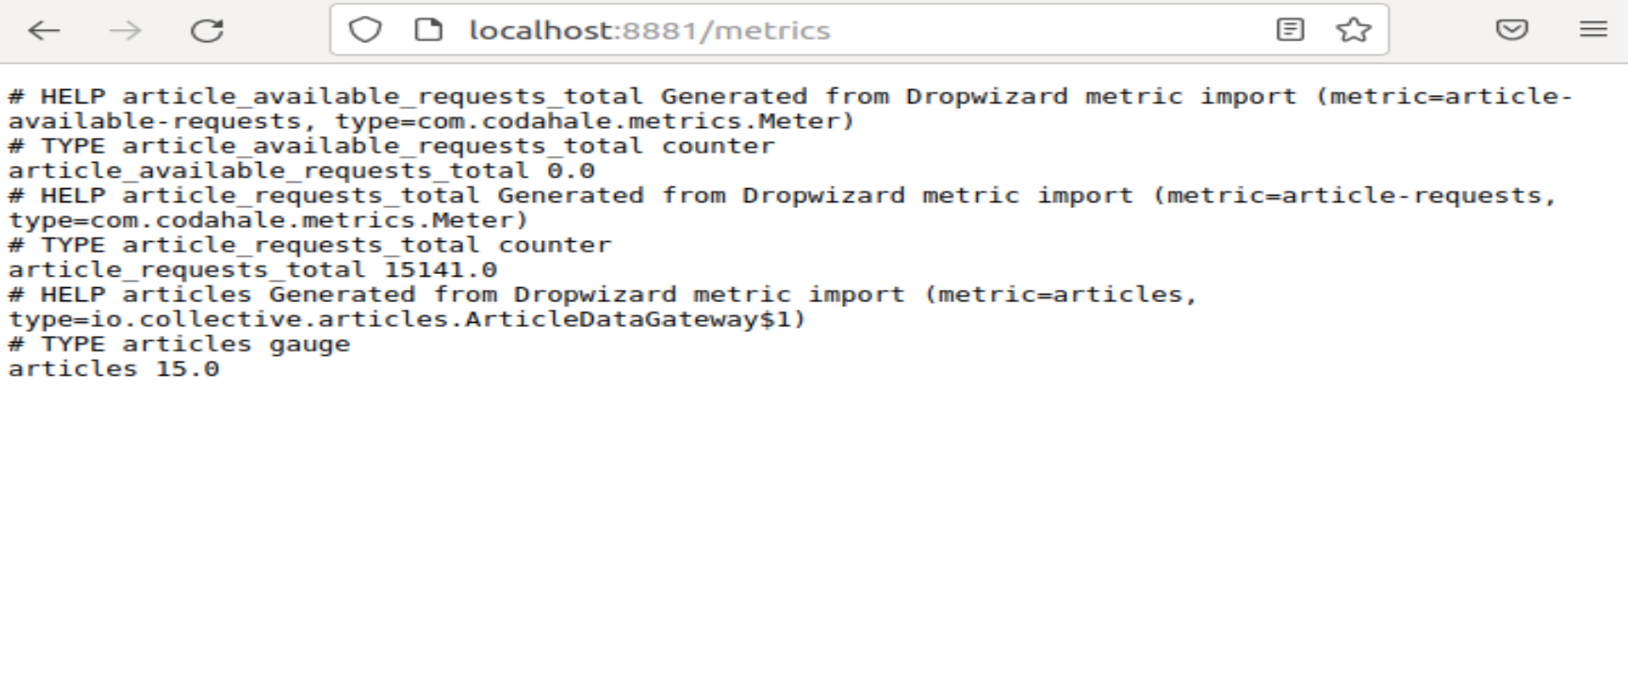
After downloading the codebase, you'll notice that the provenance-metrics project includes a few example metrics.
Search for article-requests to review the Meter metric.
Then review the Dropwizard metrics Getting Started page to gain a general understanding of the new code. Dropwizard Metrics is a Java framework for developing ops-friendly, high-performance, RESTful web services built by Coda Hale and the engineering crew at Yammer.
Build the provenance-metrics project.
./gradlew clean buildRun the server using the below command.
java -jar applications/provenance-server/build/libs/provenance-server-1.0-SNAPSHOT.jarWe'll be using Prometheus to store our metrics data. Prometheus is an open-source monitoring application built by the engineers at SoundCloud.
Install Prometheus and ensure that Prometheus is configured with our new metrics endpoint.
brew install prometheusModify /usr/local/etc/prometheus.yml to match the example below. For homebrew modify /opt/homebrew/etc/prometheus.yml.
  - job_name: 'dropwizard'
    metrics_path: '/metrics'
    scrape_interval: 5s
    scheme: http
    static_configs:
      - targets: [ 'localhost:8881' ]
Restart prometheus.
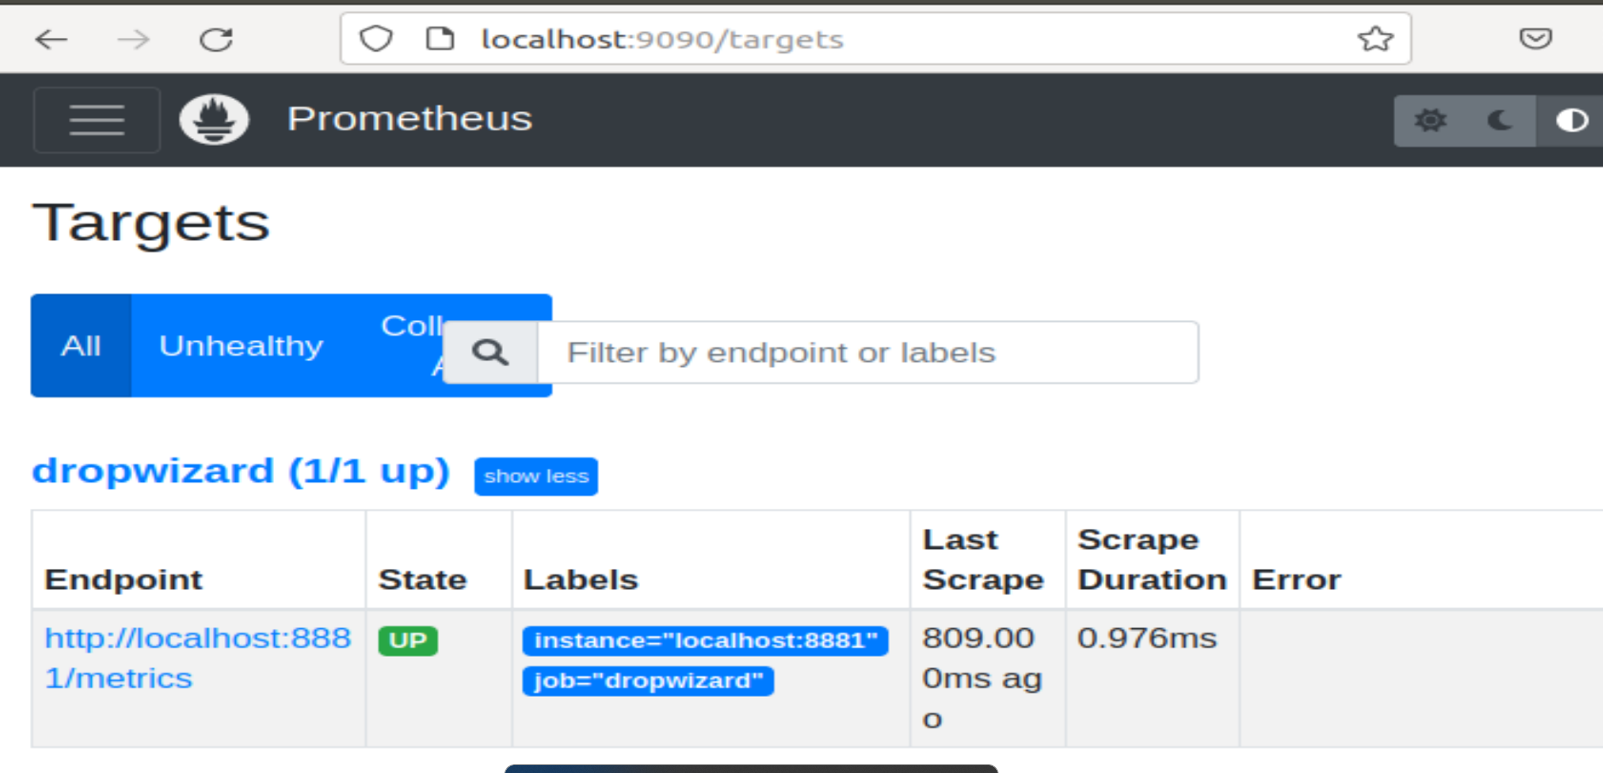
brew services restart prometheusUpon success, you should see our Dropwizard endpoint http://localhost:8881/metrics UP on the
Prometheus Status Targets page.
Grafana allows you to query, visualize and alert on metrics from a variety of data sources. We'll be using Grafana to display our metrics data stored in Prometheus.
First, install and run Grafana.
brew install grafana
brew services restart grafana
Then use the web application provided by Grafana to set up and configure our Prometheus data source.
Add your newly created prometheus data source http://localhost:3000/datasources/new. Use http://localhost:9090 for your grafana data source http url.
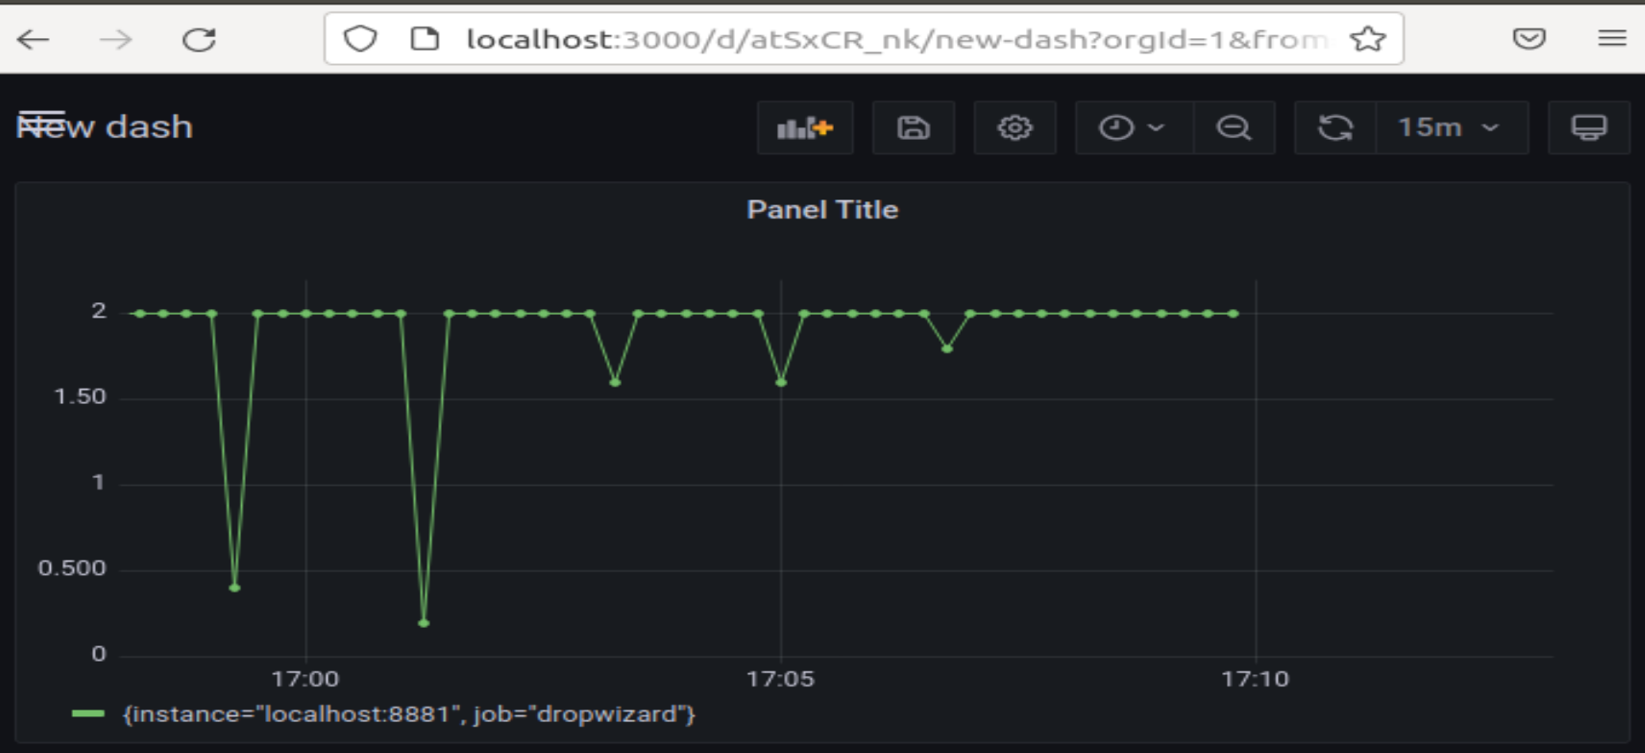
Next, create a new dashboard and graph our article_requests_total data.
Use the query below to display requests per second.
irate(article_requests_total[5m])
Curl the provenance articles endpoint to start tracking metrics. User a bash script similar to the example below to drive multiple requests per second.
while [ true ]; do for i in {1..10}; do curl -v -H "Accept: application/json" http://localhost:8881/articles; done; sleep 5; doneYour dashboard should start recording data.
Capture a screenshot of your Prometheus targets page and Grafana dashboard to complete the exercise.
Hope you enjoy the exercise!
Thanks,
The IC Team
© 2022 by Initial Capacity, Inc. All rights reserved.


