A self-sufficient interactive map visualizer integrated with charting and graphing tools for depicting geolocational data.
- Zoom Controls: Zoom in and out to any level of detail, and set zoom limits for user interaction.
- Layer Controls: Manage and toggle between multiple layers within the same map simultaneously.
- Search: Automatically locate and pan to a requisite region.
- Data Visualization: View charts, graphs, and tabular data pertaining to a select region by clicking over it.
- Choropleths: Regions shaded with color scales based on requisite statistics.
- Alter Metadata: Dynamically change map properties using the right click menu.
- Heatmaps: Depict highly dense geospatial data.
- Range Slider: Depict time-bound data over requisite periods, which can be customized using sliders.
Leaflet is the leading open-source JavaScript library for mobile-friendly interactive maps. Used as the parent library for all map based interactions. Since it is exclusively a map API and not a full-fledged engine like Google Maps, it requires sourcing map images from third-party tile repositories such as OpenStreetMaps.
| Leaflet | Cesium | Mapbox-GL | OpenLayers | |
|---|---|---|---|---|
| Github Stars | 31,135 | 7,273 | 7,679 | 8,225 |
| Github Issues | 695 | 1,165 | 835 | 118 |
| Documentation | Extensive | Limited | Extensive | Extensive |
| Community Support | Highly Active | Active | Fairly Active | Fairly Active |
| Ease of implementation | Fast and extremely simple | Fairly easy | APIKey-Based Access | High Complexity |
| Feature Richness | Moderate, major use-cases only | Moderate | High, Freemium model | High |
| Resource Size | Light (39.9 kB) | Heavy (867.9 kB) | Heavy (218.9 kB) | Medium (151.7 kB) |
Leaflet supports a large number of third-party plugins, the ones included in the project are mentioned below along with their use cases.
- Leaflet-choropleth: Color Scaled Maps for stastically varied regions
- Leaflet.heat: Heatmaps
- Leaflet-search: Multi-layer Region Finder
- Leaflet-omnivore: Dataset conversion (CSV/KML/TopoJSON - GeoJSON)
- Leaflet.EasyButton: Interactive map buttons
- Leaflet.contextmenu: On-click interactive menus
- LeafletSlider: Time-bound data representation
Leaflet accepts a specific data format - GeoJSON for generating layers, which in turn allows two kinds of geometries - Points(for location-specific data) and Polygons (for region-specific data). Any dataset needs to converted to the GeoJSON format for enable parsing.
A great resource for all kinds of tools and libraries built around GeoJSON is awesome-geojson on Github.
These represent singular instances which signify the occurence of an event at a given location. Data of this kind is usually available in the CSV format, with Latitude and *Longitude being mandatory attributes. Any such file can easily be converted to a GeoJSON format using open-sourced tools like CSV2GEOJSON.
    {
        "type": "Feature",
        "properties": {
            "name": "Coors Field",
            "amenity": "Baseball Stadium",
            "popupContent": "This is where the Rockies play!"
        },
        "geometry": {
            "type": "Point",
            "coordinates": [-104.99404, 39.75621]
        }
    };
Example sources - Any CSV file with the given format, i.e., possessing 2 mandatory geolocational columns (Longitude and Latitude) in addition to other required properties.
These represent the boundaries of a certain geographical region such as a county/borough, city, state, or a country. This data is either available readily in the GeoJSON format, or needs to be converted from TopoJSON, or a combination of .SHP (shapefile) and .DBF (database) files. While TopoJSON files can easily be converted leaflet-omnivore, SHP and DBF files need to be feeded into a tool like mapshaper to generate the resultant GeoJSON.
    {
        "type" : "FeatureCollection",
        "features": [
            {
                "type" : "Feature",
                "geometry" : {
                    "type" : "Polygon",
                    "coordinates" : [[[0.16654926225612599,51.50627250259322],[0.16654926225612599,51.51588053174041],
                    ......................
                    ,[0.16654926225612599,51.50627250259322]]]
                },
                "properties" : {
                    "ISO" : "GBR",
                    "NAME_0" : "United Kingdom",
                    .............................
                    "ENGTYPE_2":"London Borough",
                    "VARNAME_2":""
                }
            },
        ],
        ..........................
    }
Example sources -
- DIVA-GIS
- Natural Earth
- Administrative government maintained repositories such as New York City's website and Statistics Canada
- Github Repositories such as David Eldersveld's TopoJSON collective, TopoJSON maintained us-atlas, and world-atlas
- geojson.xyz
Leaflet requires sourcing tiles(map images) from external tile repositories like OpenStreetMap, which in turn requires communication over the internet. The request url is of the format - https://tile.openstreetmap.org/{z}/{x}/{y}.png which takes 3 arguments, that are fed to it by the Leaflet API after each interaction with the map. However, for creating self-sufficient maps which can work offline, we need to download all required tiles (images) to the local repository which is achieved using the Offline Map Maker software.
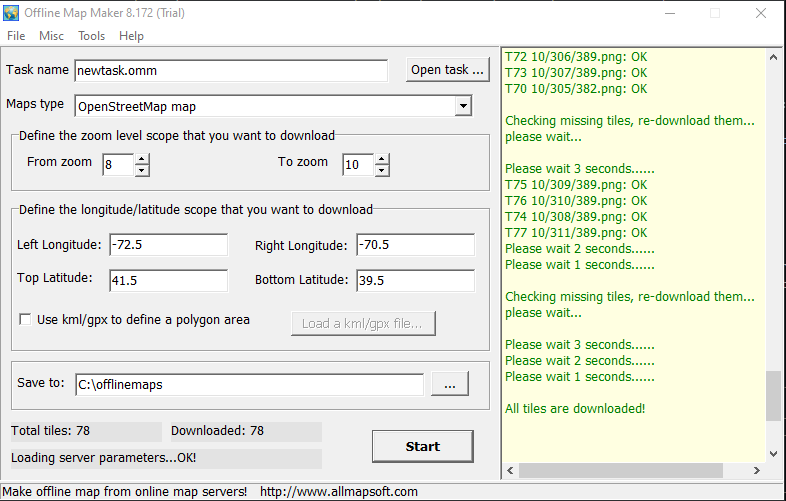
Since the number of such tiles (images) can be pretty large, we limit our zoom and bounding box pan levels to appropriate and requisite values. This creates a folder with the requisite substructure, which can then be accessed using a similar url (/{z}/{x}/{y}.png).
Heatmaps are required for visualizing dense data in a region, and can be generated using Point-based geometries, where Latitude and Longitude are mandatory arguments in addition to an optional Intensity argument, which describes the sphere of influence of a particular data-point. Heatmaps in Leaflet can take some additional metadata such as default radius for each item, blur and opacity values to tone down the density of visualization.
The dataset required for creating heatmaps are sets of JSON arrays, which can easily be generated using CSV files using online tools, or manual scripts.
{
  "values": [
    ["2018-09-02 13:00:00","42.35779134","-71.13937053"  ],
    ["2018-08-21 00:00:00","42.30682138","-71.06030035"  ],
    ["2018-09-03 19:27:00","42.34658879","-71.07242943"  ],
    .................
    ["2016-05-31 19:35:00","42.30233307","-71.11156487"  ],
    ["2015-06-22 00:12:00","42.33383935","-71.08029038"  ]
  ]
}
The Range Slider displays the markers pertaining to the duration between a given time-period, and this time needs to be added in the DATETIME or epoch format. The data required for this is a Point-based Geometry as well, which can be converted using CSV2GEOJSON with ease.
    {
        "type": "FeatureCollection",
        "features": [
            {
                "type": "Feature",
                "properties": {
                    "ACCIDENT DATE": "2019-08-05T00:00:00.000",
                    "ACCIDENT TIME": "16:30",
                    "LATITUDE": "40.676052",
                    "LONGITUDE": "-73.790184"
                },
                "geometry": {
                    "type": "Point",
                    "coordinates": [
                        -73.790184,
                        40.676052
                    ]
                }
            },
            .....................
        ]
    }
Data pertaining to a specific region or location can be directly accessed on the modal that pops up when an item is clicked. This data can either be stored in the properties key of the GeoJSON object, or can also be derived from external JSON sources by comparing the geolocational Names/IDs.
Example of data being stored inside the properties key
    "properties": {
        "geo_id" : "0400000US04",
        "fips_state":"04",
        "name":"Arizona",
        "iso_3166_2":"AZ",
        "census":6392017,
        "pop_estimataes_base":6392310,
        "pop_2010":6411999,
        "pop_2011":6472867,
        "pop_2012":6556236,
        "pop_2013":6634997,
        "pop_2014":6731484
    }
Example of external data source
    {
       "Bronx": {
          "CensusTract": 12205703290444,
          "TotalPop": 1428357,
          "Men": 672447,
          "Women": 755910,
          "Hispanic": "17626.400000000016",
          "White": "4340.000000000001",
          "Black": "9735.599999999995",
          "Native": "68.89999999999999",
          "Asian": "1270.2000000000005",
          ......................
          "Citizen": 820317,
        },
        ............................
    }