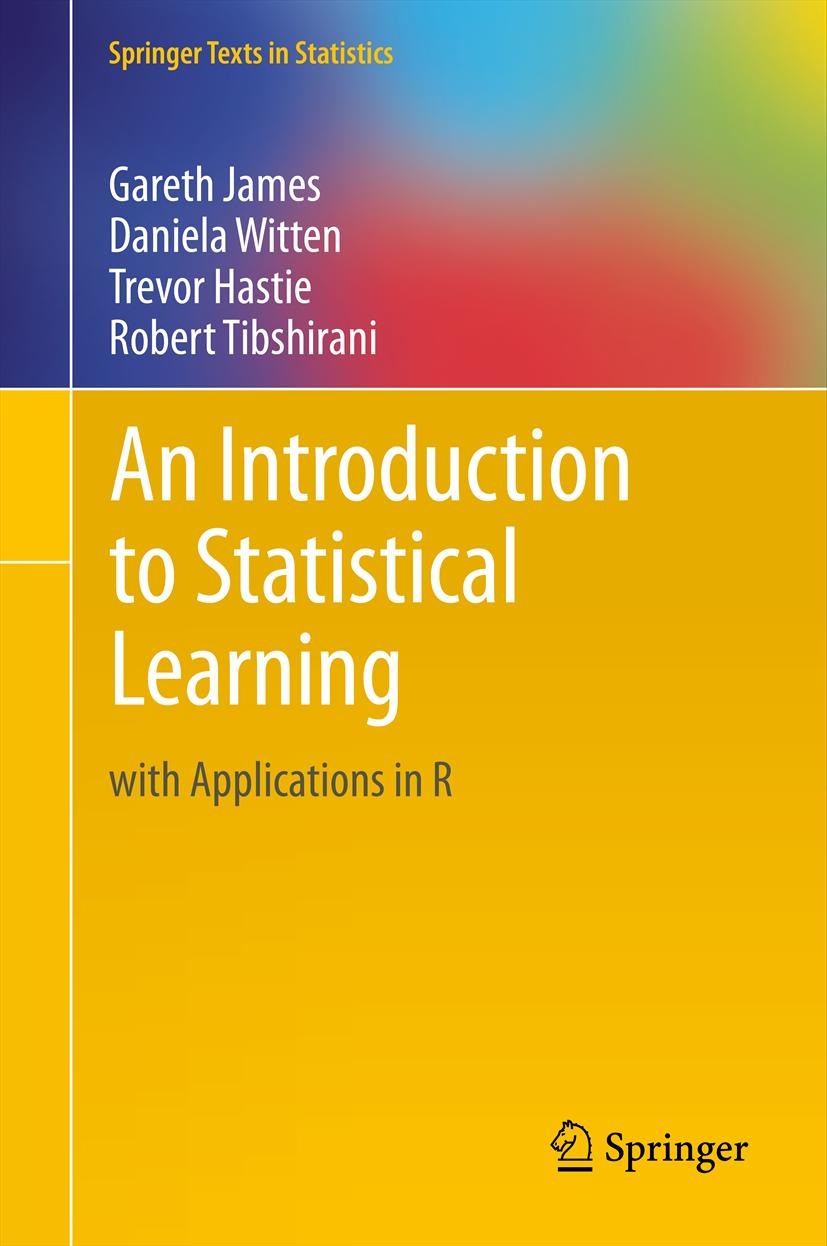
This repository contains Python code for a selection of tables, figures and LAB sections from the first edition of the book 'An Introduction to Statistical Learning with Applications in R' by James, Witten, Hastie, Tibshirani (2013).
For Bayesian data analysis using PyMC3, take a look at this repository.
2018-01-15:
Minor updates to the repository due to changes/deprecations in several packages. The notebooks have been tested with these package versions. Thanks @lincolnfrias and @telescopeuser.
2016-08-30:
Chapter 6: I included Ridge/Lasso regression code using the new python-glmnet library. This is a python wrapper for the Fortran library used in the R package glmnet.
Chapter 3 - Linear Regression
Chapter 4 - Classification
Chapter 5 - Resampling Methods
Chapter 6 - Linear Model Selection and Regularization
Chapter 7 - Moving Beyond Linearity
Chapter 8 - Tree-Based Methods
Chapter 9 - Support Vector Machines
Chapter 10 - Unsupervised Learning
Extra: Misclassification rate simulation - SVM and Logistic Regression
This great book gives a thorough introduction to the field of Statistical/Machine Learning. The book is available for download (see link below), but I think this is one of those books that is definitely worth buying. The book contains sections with applications in R based on public datasets available for download or which are part of the R-package ISLR. Furthermore, there is a Stanford University online course based on this book and taught by the authors (See course catalogue for current schedule).
Since Python is my language of choice for data analysis, I decided to try and do some of the calculations and plots in Jupyter Notebooks using:
- pandas
- numpy
- scipy
- scikit-learn
- python-glmnet
- statsmodels
- patsy
- matplotlib
- seaborn
It was a good way to learn more about Machine Learning in Python by creating these notebooks. I created some of the figures/tables of the chapters and worked through some LAB sections. At certain points I realize that it may look like I tried too hard to make the output identical to the tables and R-plots in the book. But I did this to explore some details of the libraries mentioned above (mostly matplotlib and seaborn). Note that this repository is not a standalone tutorial and that you probably should have a copy of the book to follow along. Suggestions for improvement and help with unsolved issues are welcome! See Hastie et al. (2009) for an advanced treatment of these topics.
James, G., Witten, D., Hastie, T., Tibshirani, R. (2013). An Introduction to Statistical Learning with Applications in R, Springer Science+Business Media, New York. https://www.statlearning.com/
James, G., Witten, D., Hastie, T., Tibshirani, R. (2021). An Introduction to Statistical Learning with Applications in R, Second Edition, Springer Science+Business Media, New York. https://www.statlearning.com/
Hastie, T., Tibshirani, R., Friedman, J. (2009). Elements of Statistical Learning, Second Edition, Springer Science+Business Media, New York. http://statweb.stanford.edu/~tibs/ElemStatLearn/
