Authored By: Kyle Dufrane
Our stakeholder is the NHLPA (National Hockey League Players Association). Over the long history of the NHL there have been a total of five "lockouts" or player strikes regarding pay. The purpose for this project is to devolop a machine learning model that will predict players salaries, excluding goalies (as this will require another model due to stats), based on prior performance. The NHLPA will be able to use to model, moving forward, to negotiate player contract prices against the NHL.
This dataset comes from two sources being:
- NHL API - player stats by season
- Spotrac.com Webscraping - player salaries by season
From the NHL API we collected player stats from the 2013-14 season to the 2019-2020 season. Through a number of API pulls I was able to gather key features such as total time on ice, power play time on ice, shots, hits, player names, position, etc. Below are the columns and descriptions from the NHL API prior to adding in seasonal stats.
- id - NHL player id
- fullName - full name of NHL player
- link - suffix of URL to access specific players API
- jerseyNumber - team number of player
- code - abbreviation of position (I.E. D = Defenseman)
- name - full position name
- type - position type (Forward, Defensement, Goalie)
- abbreviation - full abbreviation of the name column (I.E. Left Wing = LW)
- Team_Number - NHL team number
- birthDate - year/month/day a player was born
- currentAge - age of player
- birthCity - city a player was born
- birthStateProvince - city/province a player was born
- birthCountry - country a player was born
- nationality - nationality of player
- height - height of player
- weight - weight of player
- active - if the player is active or not (True/False)
- alternateCaptain - if the player is an alternative captain (True/False)
- captain - if the player is a captain (True/False)
- rookie - if the player is a rookie or not (True/False)
- shootsCatches - handedness of the player
- rosterStatus - if the player is on the roster or injury reserve
The seasonal stats include the folowing:
Player Stats
- season - denotes season year
- assists - total assists
- goals - total goals
- pim - total penalty minutes
- shots - total shots
- games - total games
- hits - total hits
- powerPlayGoals - goals scored by player during a power play
- powerPlayPoints - total points by a player during a power play
- powerPlayTimeOnIce - total duration a player was on the ice during a power play
- evenTimeOnIce - total duration a plyaer was on the ice during even strength play
- penaltyMinutes - total penalty minues
- faceOffPct - faceoff win percentage
- shotPct - total shot percentage
- gameWinningGoals - total game winning goals
- overTimeGoals - total over time goals
- shortHandedGoals - total goals scored while a man down
- shortHandedPoints - total points scored while short handed
- shortHandedTimeOnIce - total time on ice while being a man down
- blocked - total shots blocked
- plusMinus - over/under
- points - total points
- shifts - total shifts
- timeOnIcePerGame - avgerage total time on ice per game
- evenTimeOnIcePerGame - average even stregnth time on ice per game
- shortHandedTimeOnIcePerGame - average man down time on ice a game
- powerPlayTimeOnIcePerGame - average power play time on ice per game
Goalie Stats
- ot - total overtime games
- shutouts - total shutouts
- wins - total wins
- losses - total losses
- saves - total saves
- powerPlaySaves - total power play saves
- shortHandedSaves - total short handed saves
- evenSaves - total even strength saves
- shortHandedShots - total short handed shots faces
- evenShots - total even strength shots faced
- powerPlayShots - total shots faced when on a power play
- savePercentage - save percentage
- goalAgainstAverage - average goals against
- gamesStarted - games started
- shotsAgainst - total shots against
- goalsAgainst - total goals against
- powerPlaySavePercentage - power play save percentage
- shortHandedSavePercentage - short handed save percentage
- evenStrengthSavePercentage - even strength save percentage
- ties - total ties
Since we pulled the stats by season the suffix of each column is the season number to avoid identical columns in our dataframe (I.E. ot20 denotes ot time games from the 2019-20 season)
Through webscraping I was able to gather salary information from Spotrac.com. The final dataframe was comprised of salary information from the 2010-2011 season until the present season (2020-21). I completed two webscraping collections for team players and for free agents. Once collected the raw data was converted to a dataframe and joined to make one full dataframe.
Note: All API requests and webscraping data have been stored in pickled objects and are located in the json_files folder of this repo.
Once I had the two final dataframes from the collection process I joined the tables based on player names due to this being the only common feature between the dataframes.
To start the data cleaning process, I eliminated all players categorized as a goalie since we're only concerned with players for our model and elinated all columns associated to strictly goalies (columns shown above). I then manually reviewed the dataframe and dropped all generic columns that would not be of use in the model building process. These columns are shown below:
- fullName
- id
- jerseyNumber
- code
- name
- abbreviation
- Team_Number
- season{'year'}
Next I began reviewing the NaN values in the dataframe. Below are the modifications made to the dataframe:
- birthStateProvince - total NaN's: 140 - NaN's replaced with: 'unknown'
- 2008-09 - total NaN's: 307 - columns dropped
- 2009-10 - total NaN's: 307 - columns dropped
- season stats from 2013-14 - 2015-16 - total NaN's: >50% of dataframe - columns dropped
We have a total of eight columns per season that are in a time format (mm:ss) which cannot be interpretted by our models. Moving forward, I converted all of these values to floats. The columns effected are below:
- timeOnIce
- powerPlayTimeOnIce
- evenTimeOnIce
- timeOnIcePerGame
- evenTimeOnIcePerGame
- shortHandedTimeOnIce
- powerPlayTimeOnIcePerGame
- shortHandedTimeOnIcePerGame
For our final step in our data preparation process, the heigh column is denoted by a player being 6'2" tall which, again, is not interpretable by our models. These values have been converted into inches.
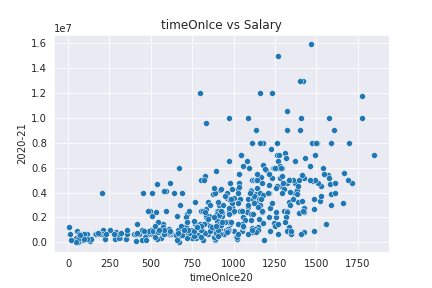
Through visualization I identified a few interesting insights and a few that comfirmed my assumptions. My assumptions were that performance is going to effect your salary. I.E. if a player has more total playing time, goals, points, or assits they would be more of an asset to their team. This assumption proved true and can be seen below.
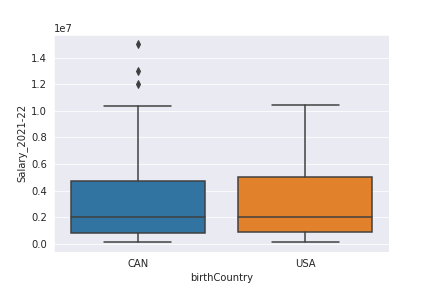
Two insights that I wouldn't have been able to identify are that the Sweedish have the highest average pay in the league followed by Finland. They do have substantially less players than US and Canada but, nevertheless, it's still surprising. Below you can see a boxplot showing the top six nationalities which are chosen by total players. These six teams make up 459 total players with the lowest nation (Czech) only having a total of 14 players.
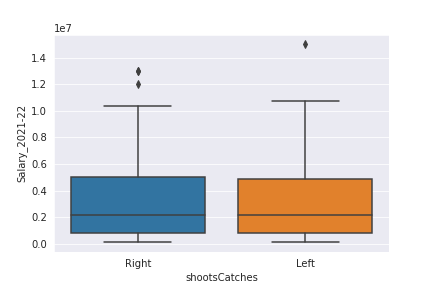
The second surpising insight is that left handed shooters have a higher average pay than right handed shooters as seen below.
The first simple model was complete by using OLS Regression and used one feature (goals19). The model didn't perform well and reached an R-squared score of 0.365.
Numerical
Next we moved into a baseline linear regression model. We started with all numerical columns and reached achieved an overfit model. Next we moved into reviewing multicolinearity within our dataframe and drop all values above .70. Once dropped we modeled another linear regression model and saw a drastic increase in our R-squared score of >.6.
Numericals with categoricals
Now I added in the categorical columns by creating a list of all possible combinations, iterating through the list creating a linear regression model per iteration, and storing the model results in a dictionary. Below are the results of the iterations:
Next I used Lazy Regressor to identify the top four best models to move forward with. Below are the baseline scores for each model:
| Model | R-Squared | RMSE |
|---|---|---|
| ExtraTreesRegressor | 0.74 | 1,310,100 |
| XGBRegressor | 0.73 | 1,300,747 |
| RandomForestRegressor | 0.71 | 1,315,713 |
After identifying these models I performed a grid search for hyper parameter tuning. Below are the results:
| Model | R-Squared | RMSE |
|---|---|---|
| ExtraTreesRegressor | 0.75 | 1,287,182 |
| XGBRegressor | 0.73 | 1,333,394 |
| RandomForestRegressor | 0.75 | 1,270,232 |
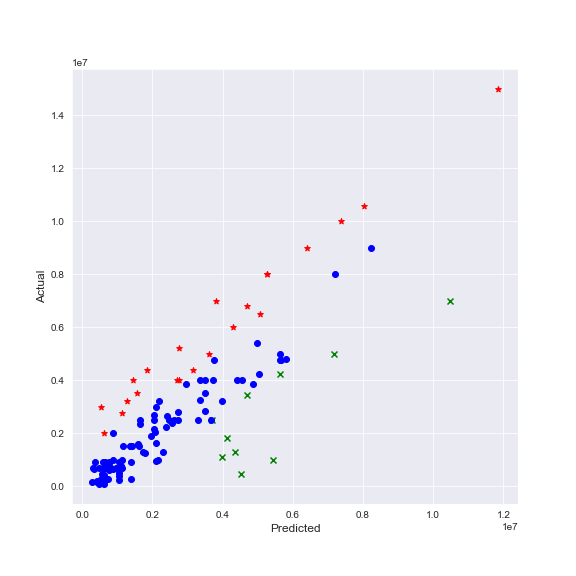
We can see an increase in our models performance with RandomForestRegressor showcasing is ability to be the final model. Below we can see our models performance vs the actual results:
Above we see our final models predeicted values vs actual values. The red stars denote players our model under predicted on while the green x's denote players we over predicted on. I filtered the dataframes based on these values and found the performance of these outliers to follow how our model predicted. Since our stakeholder is negotiating player contracts these values should be honored due to past player performance. To review these dataframes, please navigate to the jupyter notebook (link in the 'For More Information' section of this readme)
The top ten features our model identified are listed below.
- Salary - Season 2019-2020
- Time On Ice - Season 2018-2019
- Time On Ice - Season 2019-2020
- Goals - Season 2019-2020
- Hits - Season 2017-2018
- Salary - Season 2018-2019
- Short Handed Time On Ice - Season 2019-2020
- Shot Percentage - Season 2016-2017
- Plus Minus - Season 2018-2019
- Hits - Season 2019-2020
This project has been deployed using Flask. For deployment details please clone this repo.
Moving forward, I would like to further breakdown the model to account for the players contracts and durations. Also, gather data on past players and player injuries to see if these features have any effect on the model. Lastly, develop a dashboard that allows the end user to see player performance across their career.
Please review our full analysis in jupyter_notebook or our presentation.
If you have any additional questions please contact me at:
Kyle Dufrane

    Email: kyle.dufrane@gmail.com
    Github: kyledufrane
    LinkedIn: https://www.linkedin.com/in/kyle-dufrane-8131086b/
├── README.md
├── technical_notebook.ipynb
├── presentation.pdf
├── data
└── images


