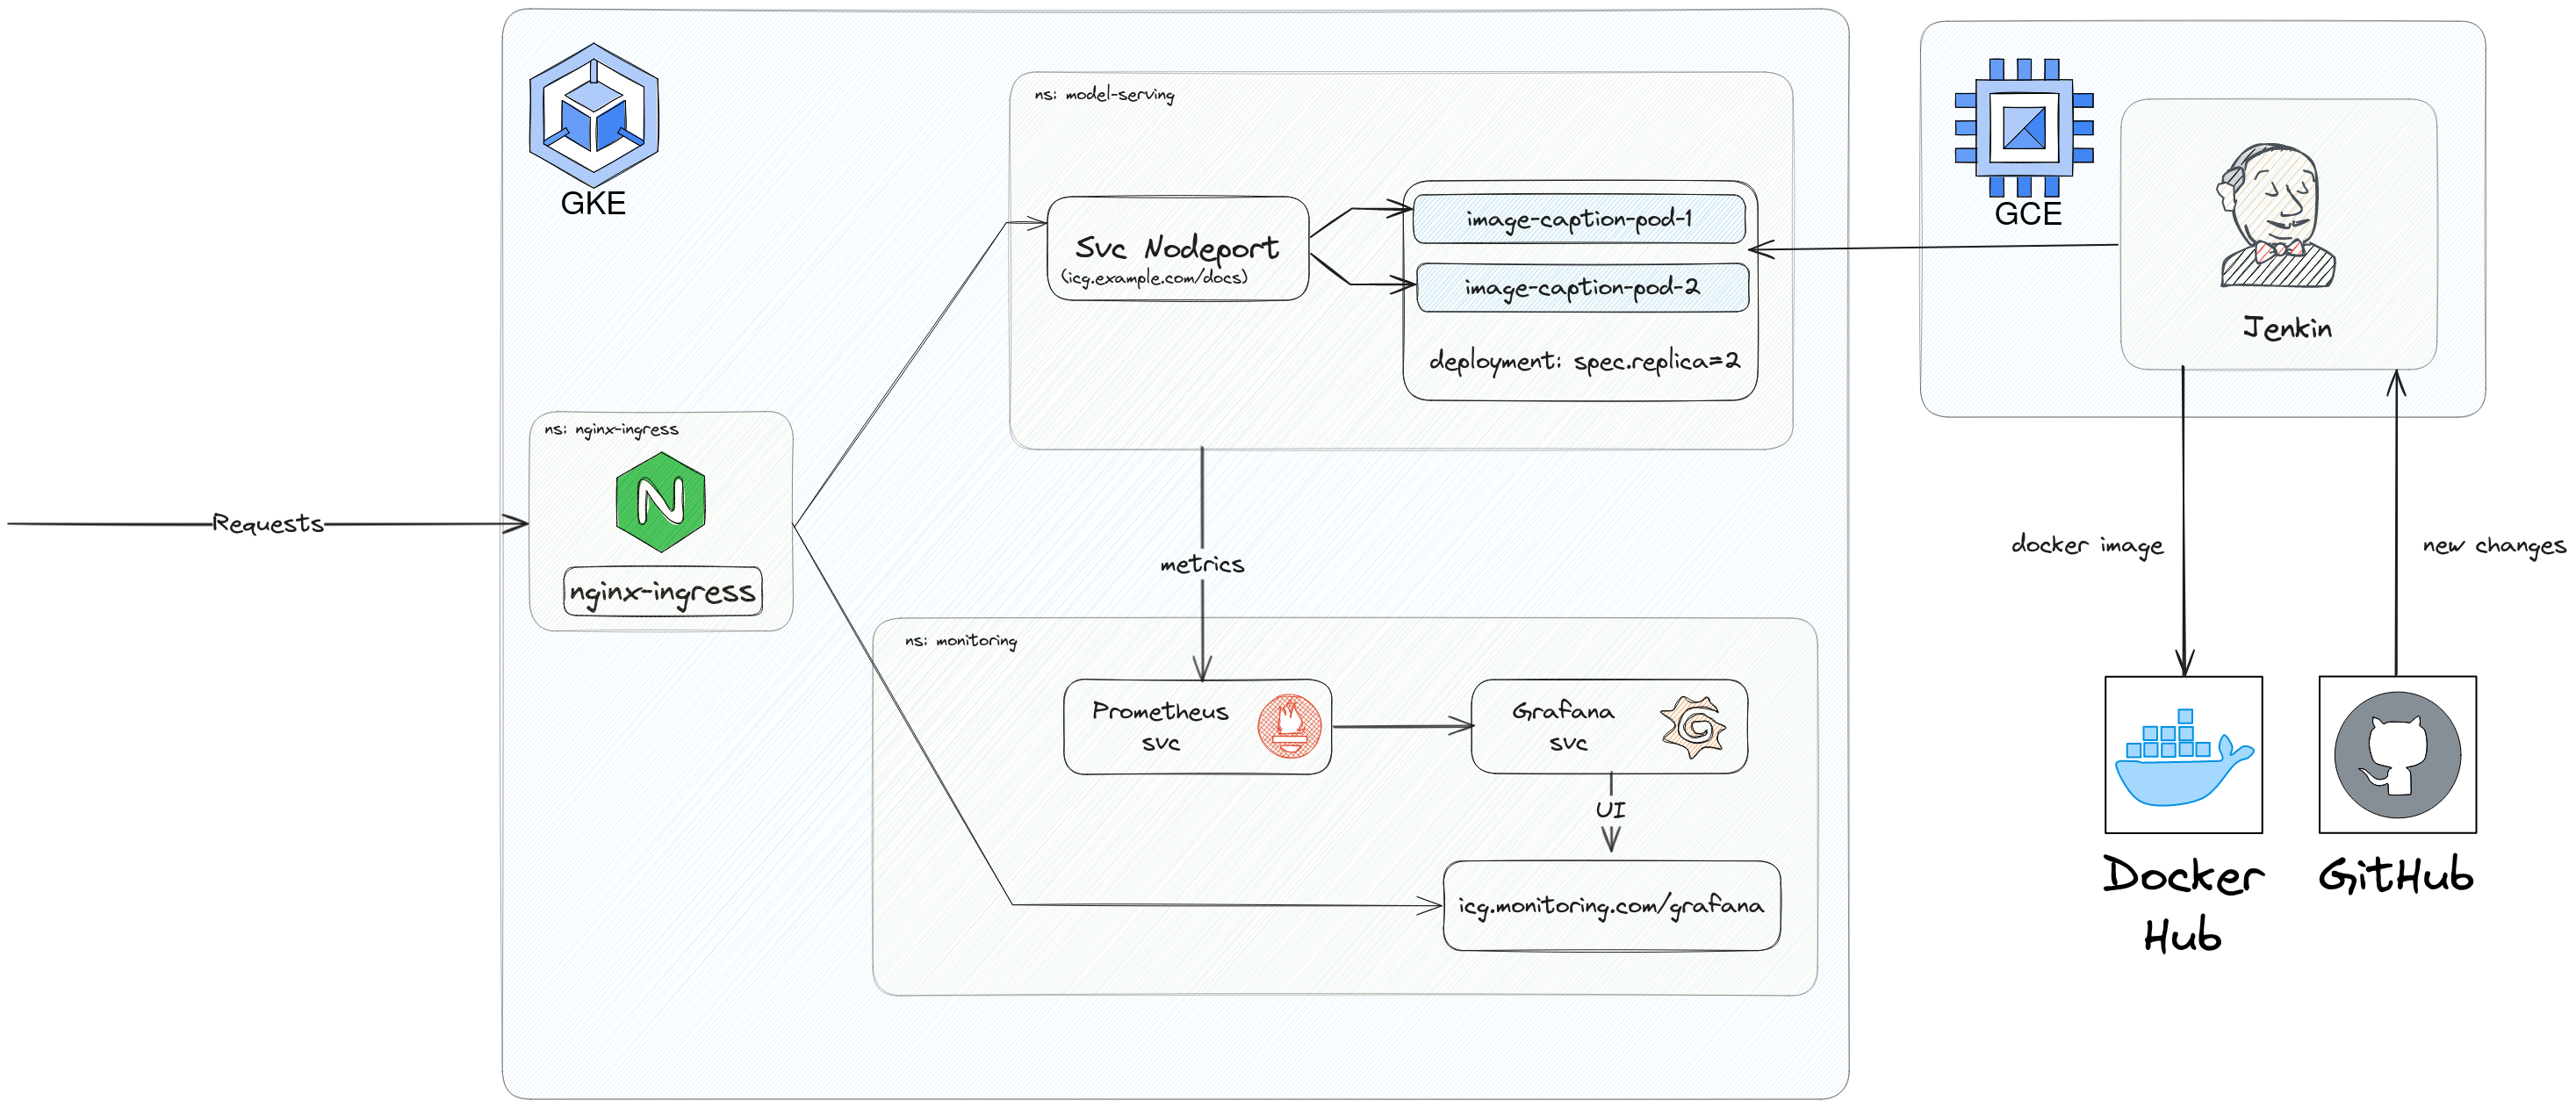
- Image captioning generator using Hugging Face’s Vision Transformer ViT and Vision Encoder Decoder Models, integrating API endpoints via FastAPI, and containerized the applicaton using Docker.
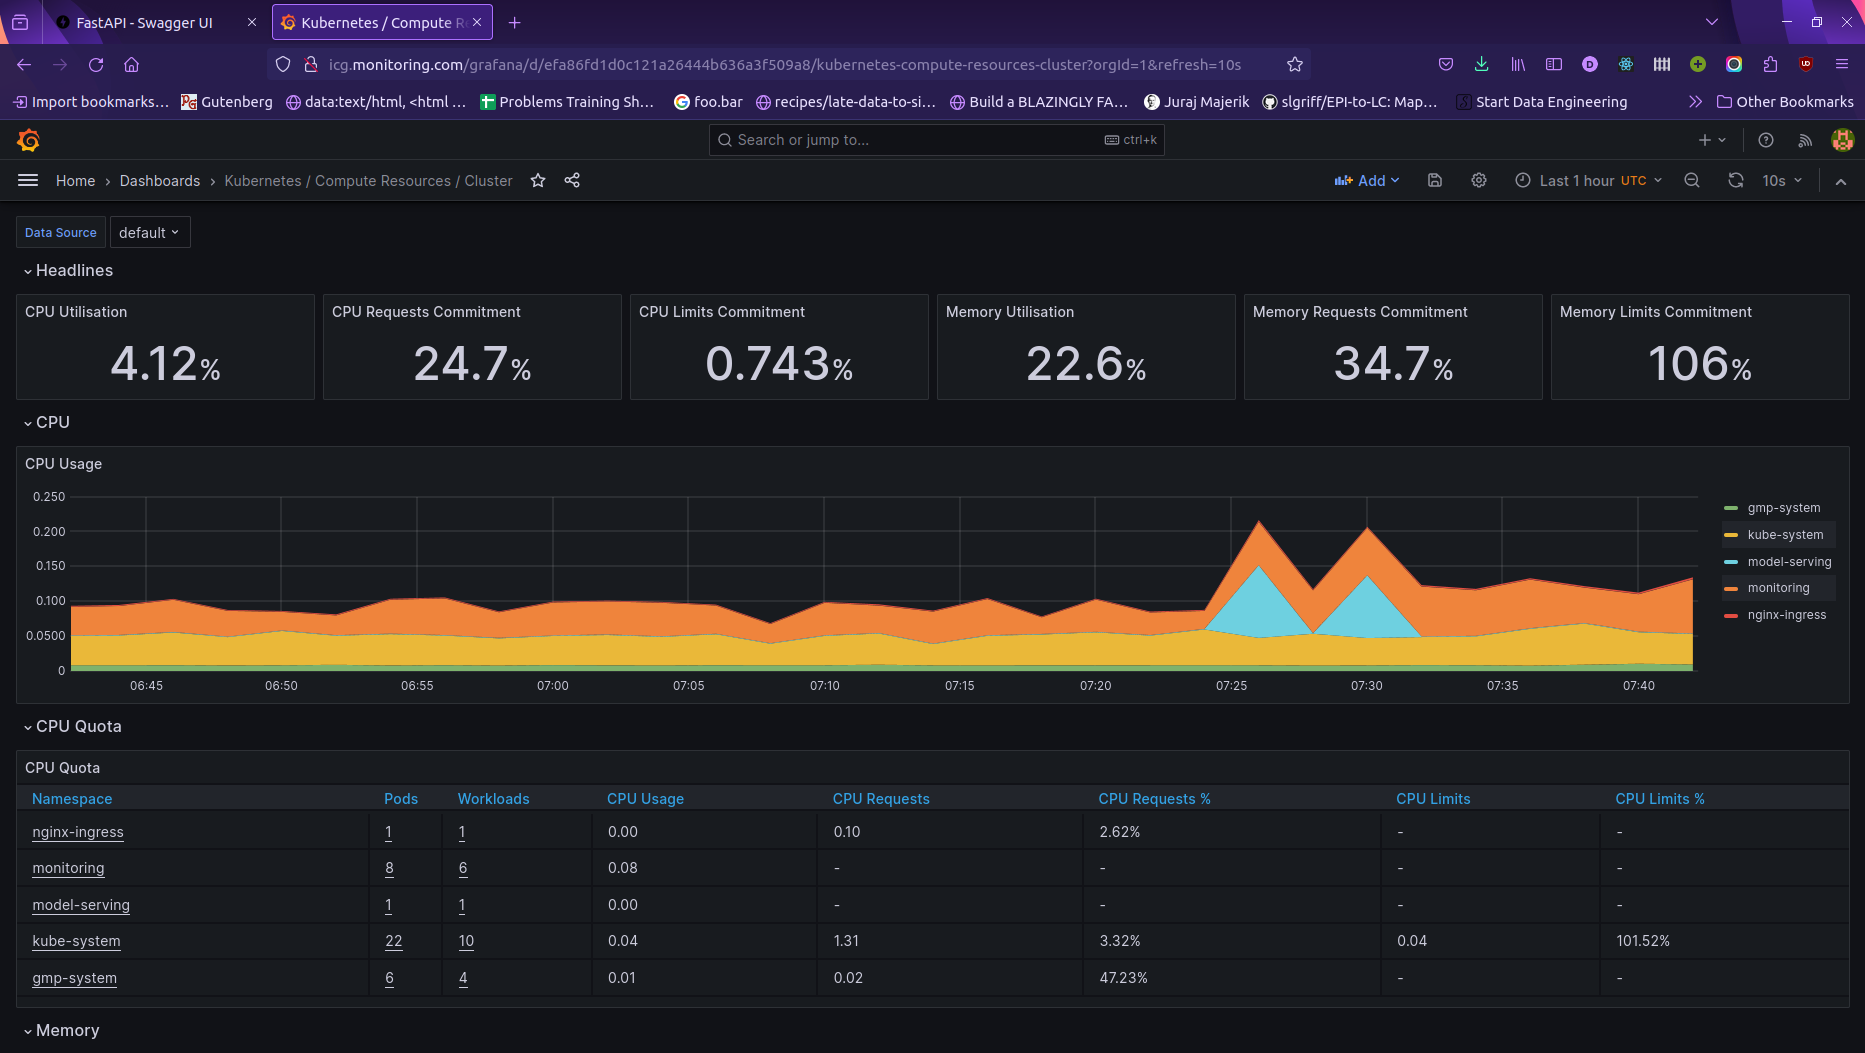
- The Model is deployed on Google Kubernetes Engine (GKE), and monitored using Prometheus and Grafana.
- CI/CD pipeline: Jenkin is installed on GCE through Ansible to automate image pushes to Docker Hub and model deployment on GKE.
Screencast.from.2023-11-14.11.22.46.PM.webm
Screencast.from.2023-11-14.11.31.09.PM.webm
- python 3.10
pip install -r requirements.txtuvicorn main:app --host 0.0.0.0 --port 30000
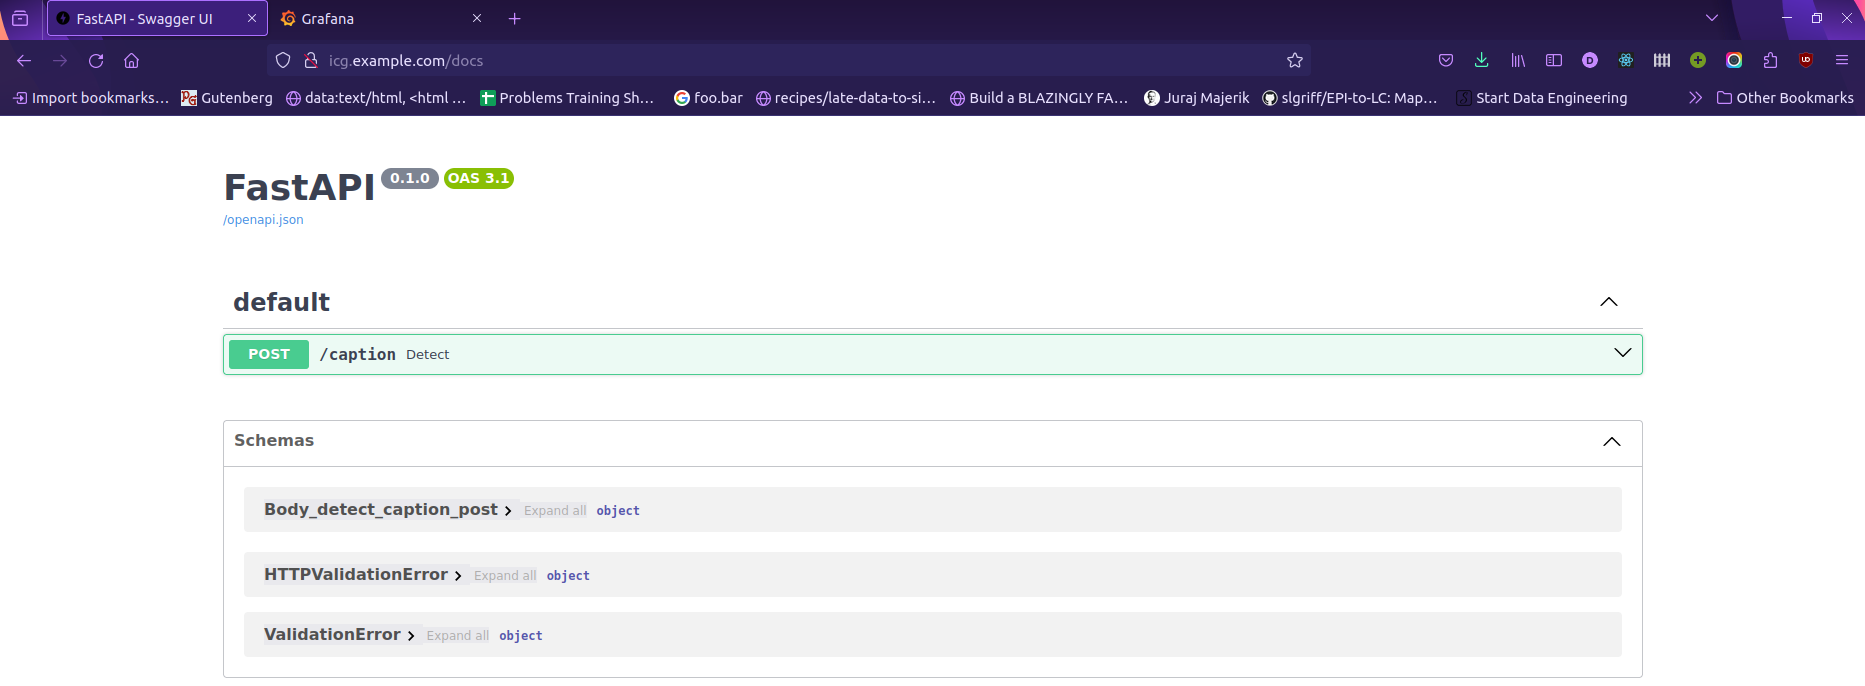
Then, you can try the API at localhost:30000/docs.
-
Install gke-gcloud-auth-plugin
sudo apt-get install google-cloud-cli-gke-gcloud-auth-plugin -
Setup Gcloud Project
- Authorizes gcloud and other SDK tools to access Google Cloud and setup configuration
gcloud init- Login to GCP
gcloud auth application-default login
-
Create GKE Cluster with Terraform
cd terraform terraform apply -
Switch to GKE context
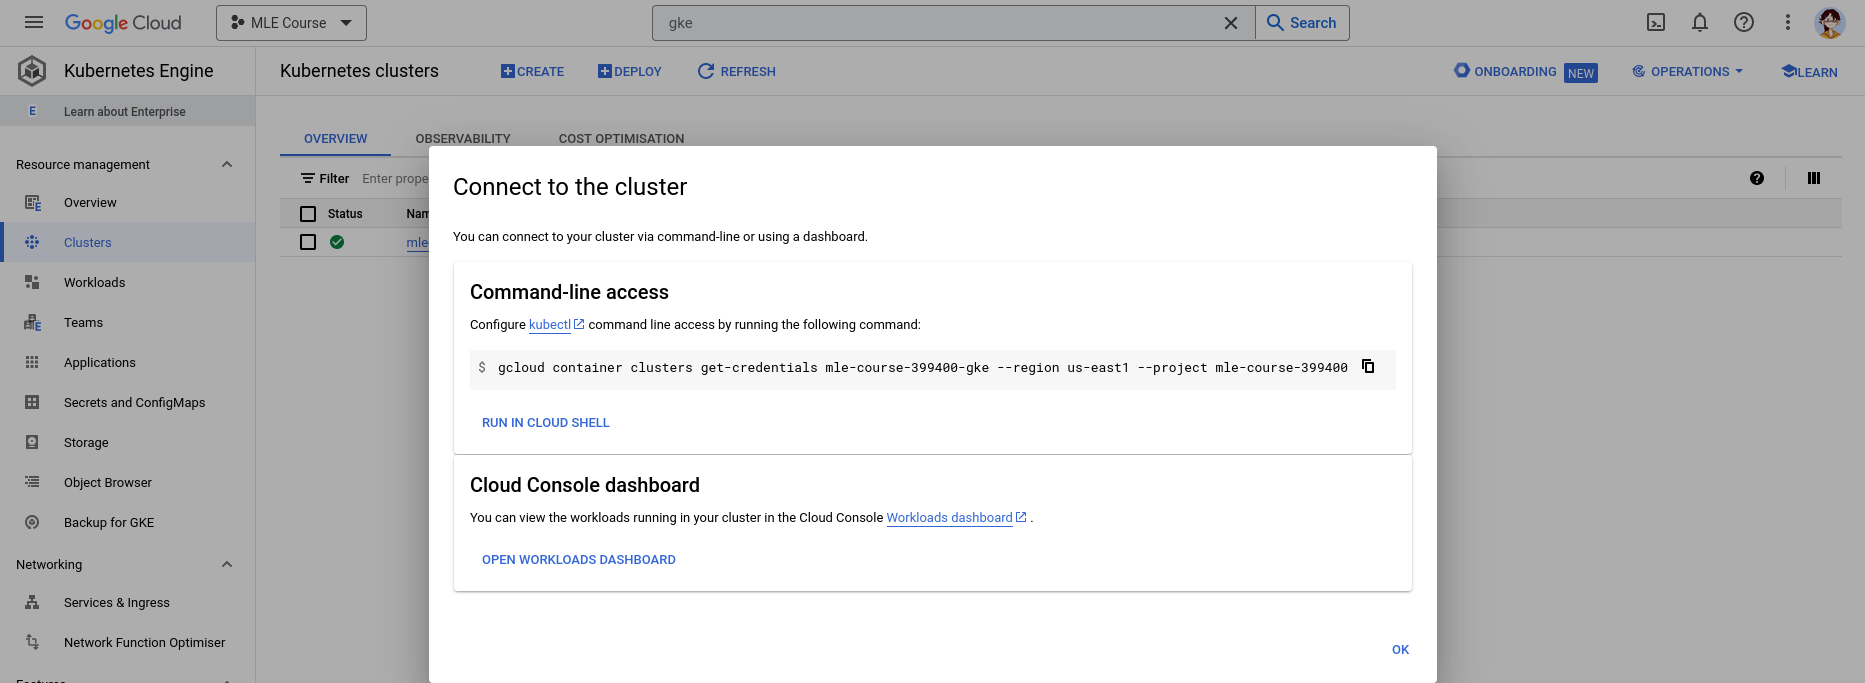
kubectx gke_mle-course-399400_us-east1_mle-course-399400-gke -
Create namespaces
k create ns nginx-ingress k create ns model-serving k create ns monitoring -
Deploy nginx ingress controller
helm upgrade --install nginx-ingress helm_charts/nginx-ingress -n nginx-ingress -
Deploy application to GKE cluster manually
helm upgrade --install image-caption-deployment helm_charts/model-deployment/image-caption -n model-serving -
Update Domain Name to
/ect/hostssudo vim /ect/hosts35.185.64.174 icg.example.com
Install kube-prometheus-stack
- Switch to
monitoringnamespacekubens monitoring
-
kube-premetheus-stackis downloaded fromprometheus-community(link).- Get Helm Repository Info (Optional)
helm repo add prometheus-community https://prometheus-community.github.io/helm-charts
helm repo update
-
Exposing monitoring applications at web context
- To expose Prometheus, AlertManager, and Grafana at the same domain with different web contexts, we need to overwrite the default
values.yamlwith our custom filekube-prometheus-stack.expanded.yaml(source).
  grafana:
    env:
      GF_SERVER_ROOT_URL: http://icg.monitoring.com/grafana
      GF_SERVER_SERVE_FROM_SUB_PATH: 'true'
    # username is 'admin'
    adminPassword: prom-operator
    ingress:
      enabled: true
      annotations:
        kubernetes.io/ingress.class: nginx
        nginx.ingress.kubernetes.io/rewrite-target: /$2
      hosts: ['icg.monitoring.com']
      path: "/grafana"
- To expose Prometheus, AlertManager, and Grafana at the same domain with different web contexts, we need to overwrite the default
-
Install Helm Chart
- Install
kube-prometheus-stackand overwrite with our custom file:helm upgrade --install -f helm/k8s-monitoring/kube-prometheus-stack.expanded.yaml kube-prometheus-stack helm_charts/k8s-monitoring/kube-prometheus-stack -n monitoring- Or if we use helm charts from
prometheus-community
helm install -f helm/k8s-monitoring/kube-prometheus-stack.expanded.yaml kube-prometheus-stack prometheus-community/kube-prometheus-stack -n monitoring
- Or if we use helm charts from
- Install
-
Add Domain Name of the Cluster IP to
/etc/hosts
-
Create Service Account with Compute Admin Role
- Create a new service account with Compute Admin role.
- Create new key of the created service account and download it as json file.

- Save it in
ansible/secrets. Update the service_account_file inansible/playbook/create_compute_instance.yamlwith the secret json file.
-
Create the Compute Engine
ansible-playbook ansible/playbooks/create_compute_instance.yaml
-
Update the ssh key
- Generate a new SSH key
ssh-keygen - Add the SSH key to Setting/Metadata/SSH KEYS

- Update the inventory file with the External IP address of the compute instance created in the previous step and the path to the ssh key file.

- Generate a new SSH key
-
Install Jenkin on GCE
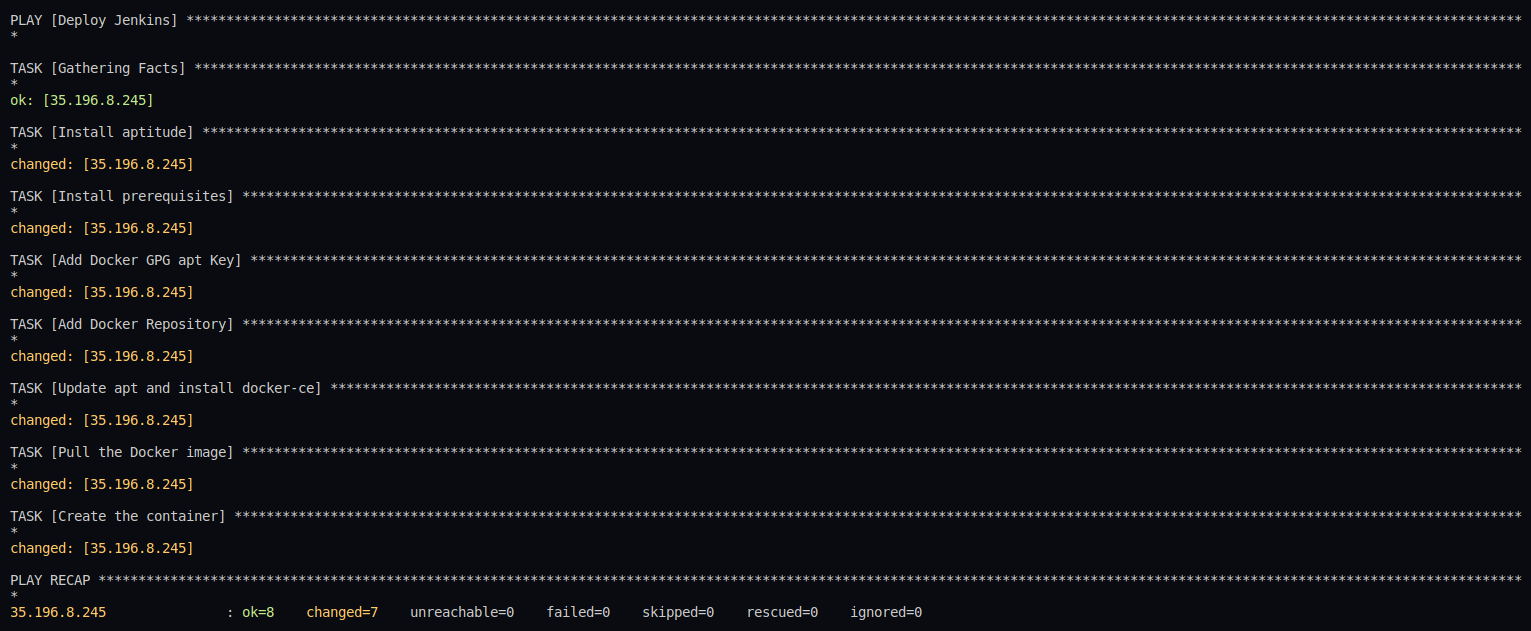
ansible-playbook -i ansible/inventory ansible/playbooks/deploy_jenkins.yaml
-
Connect to Jenkins UI
- Checking Jenkins installed successfully on GCE
- Access the GCE instance
ssh -i ~/.ssh/id_rsa YOUR_USERNAME@INSTANCE_EXTERNAL_IP - Verify if Jenkins is running in the Compute Engine instance
sudo docker ps
- Access the GCE instance
- Access Jenkins UI via
INSTANCE_EXTERNAL_IP:8081. - Follow the instruction to log in into Jenkins.
- The password can be retrieved by
# inside GCE instance
sudo docker exec -ti jenkins bash
cat /var/jenkins_home/secrets/initialAdminPassword
- Checking Jenkins installed successfully on GCE
-
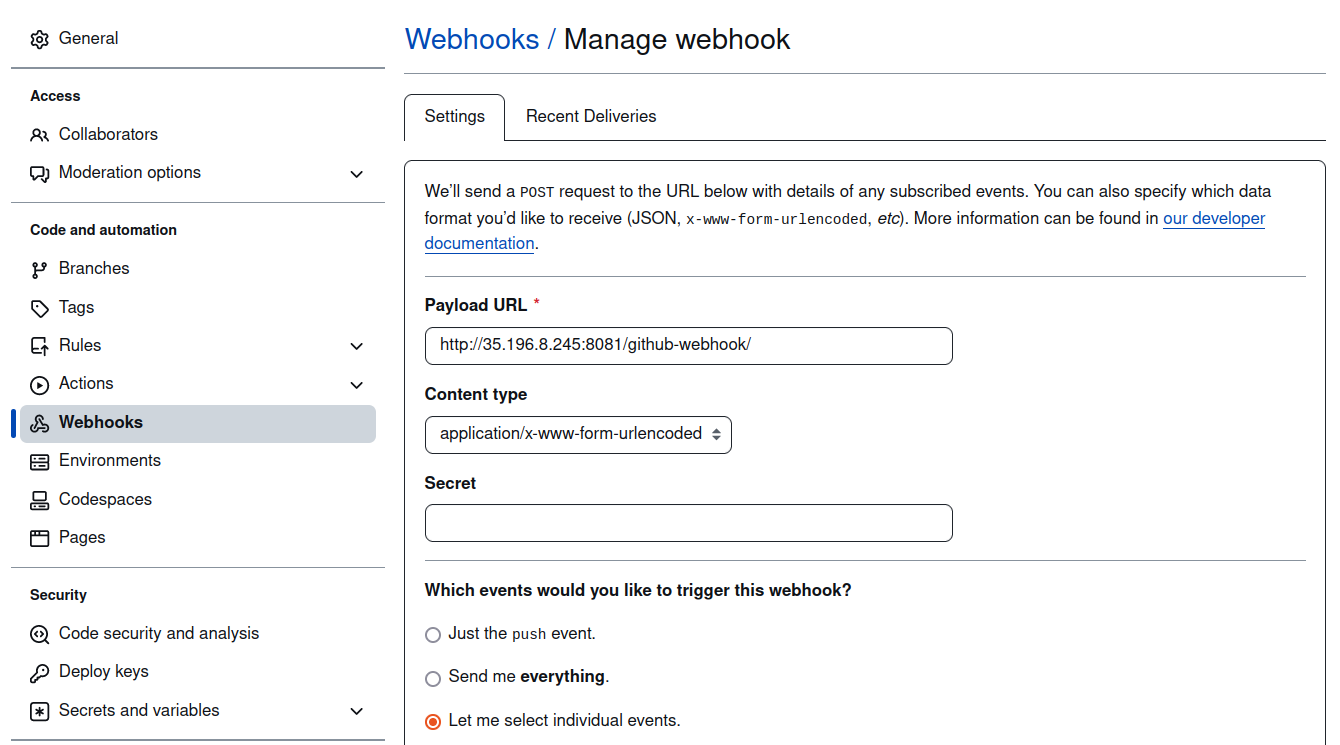
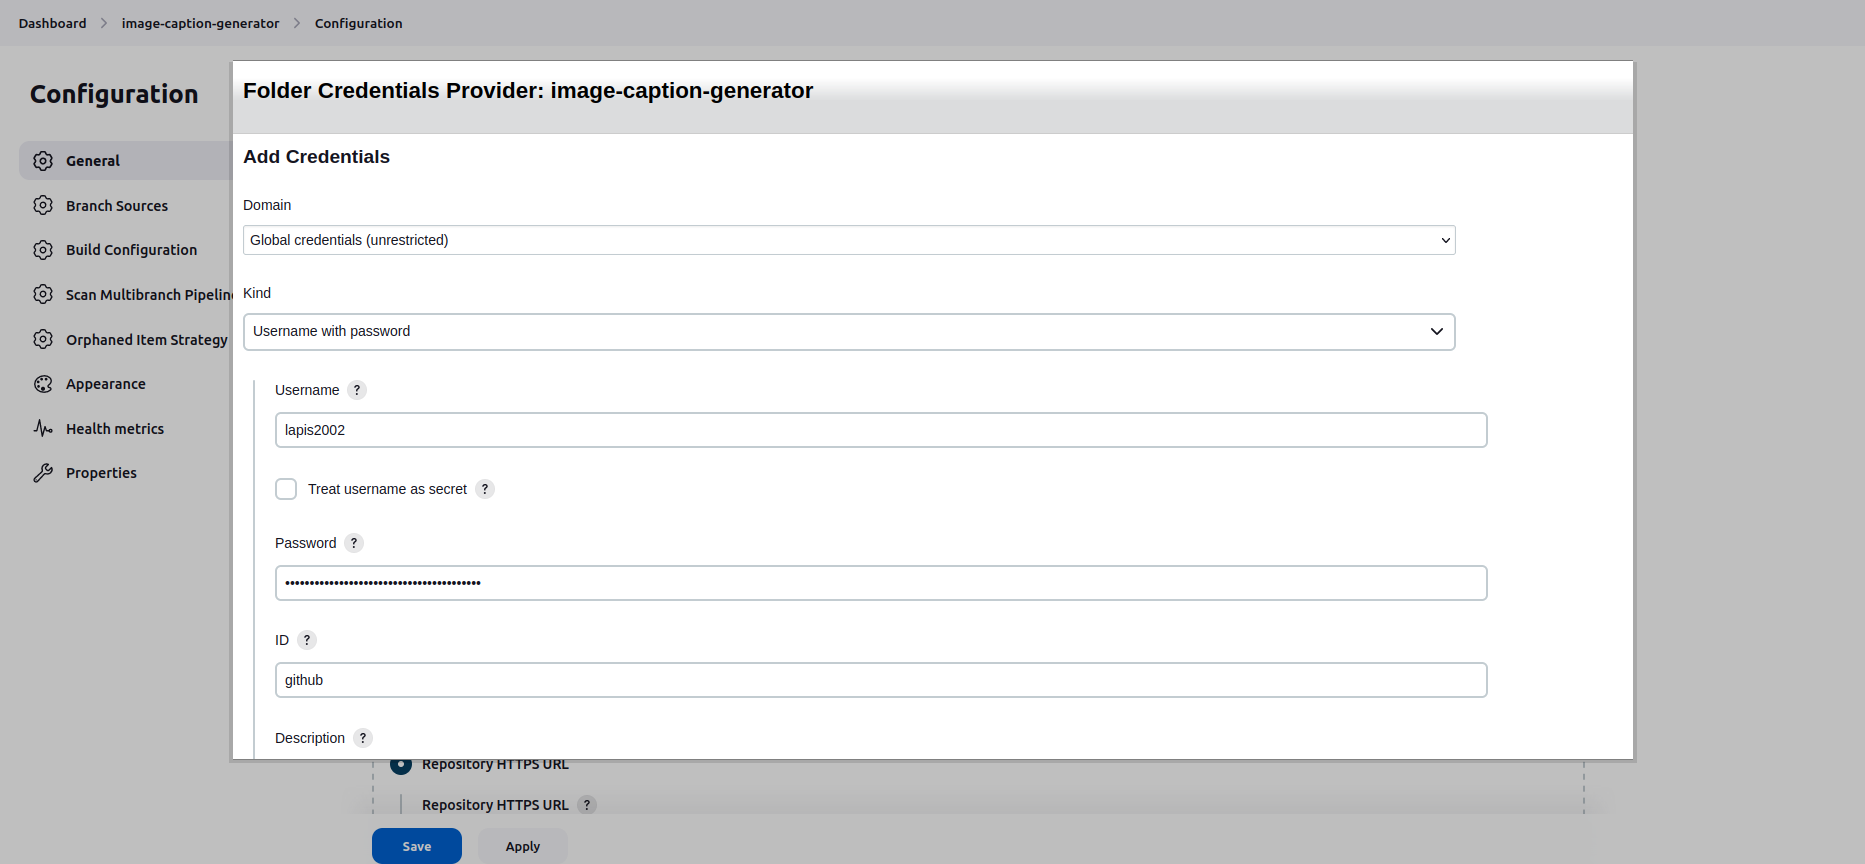
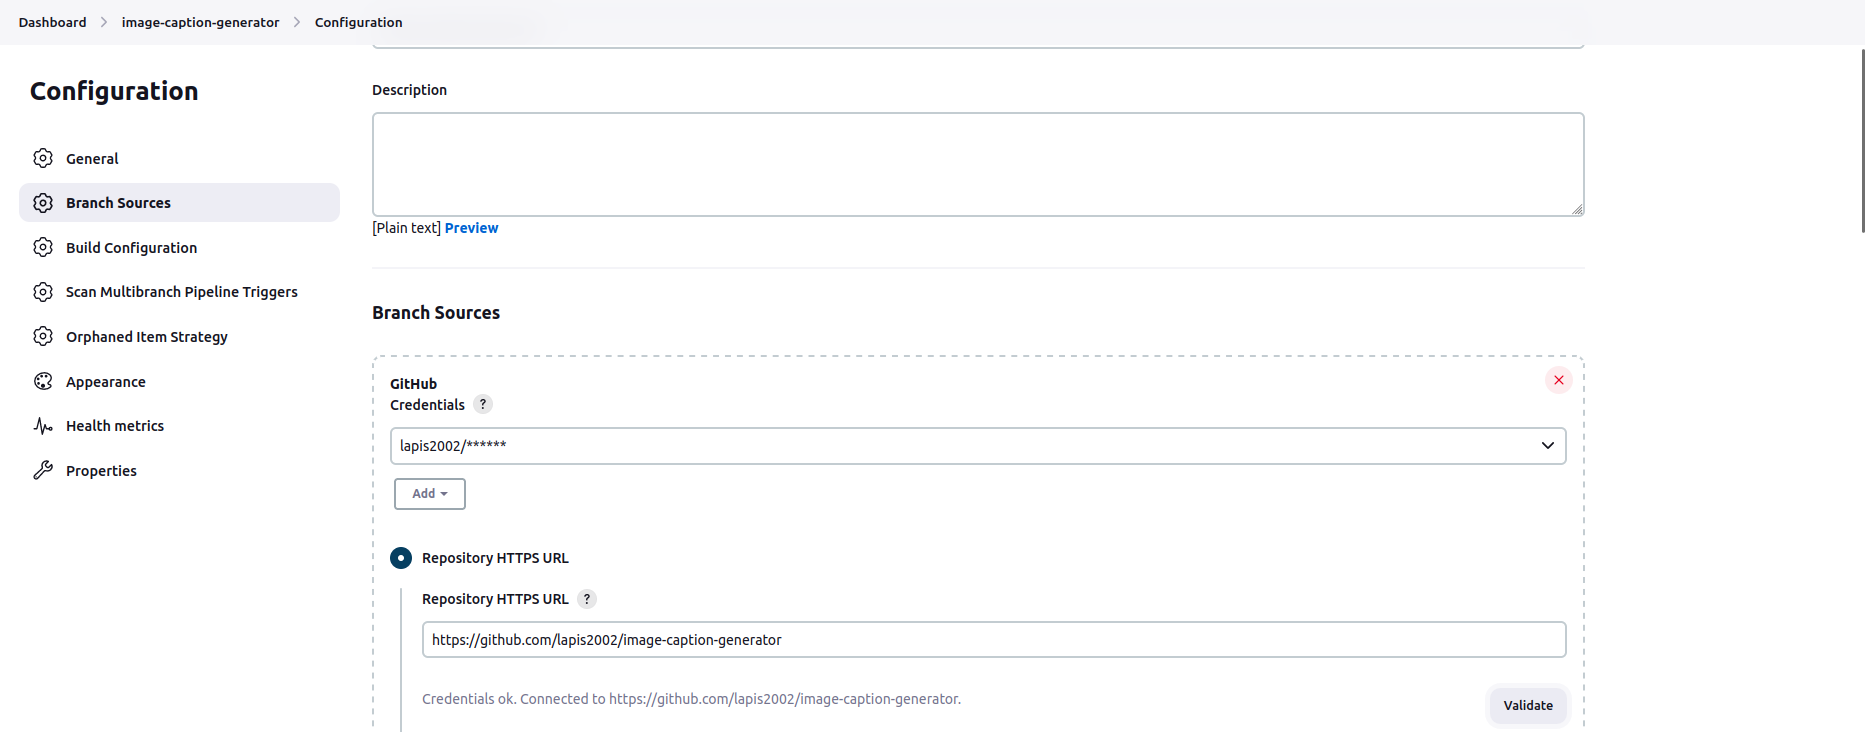
Connect Jenkins to GitHub Repo
-
Add DockerHub Token to Jenkins Credential
- Create a new DockerHub Token
- Add the token to Jenkins' Credentials
- Note: ID must be
dockerhubto match theregistryCredentialin Jenkinsfile.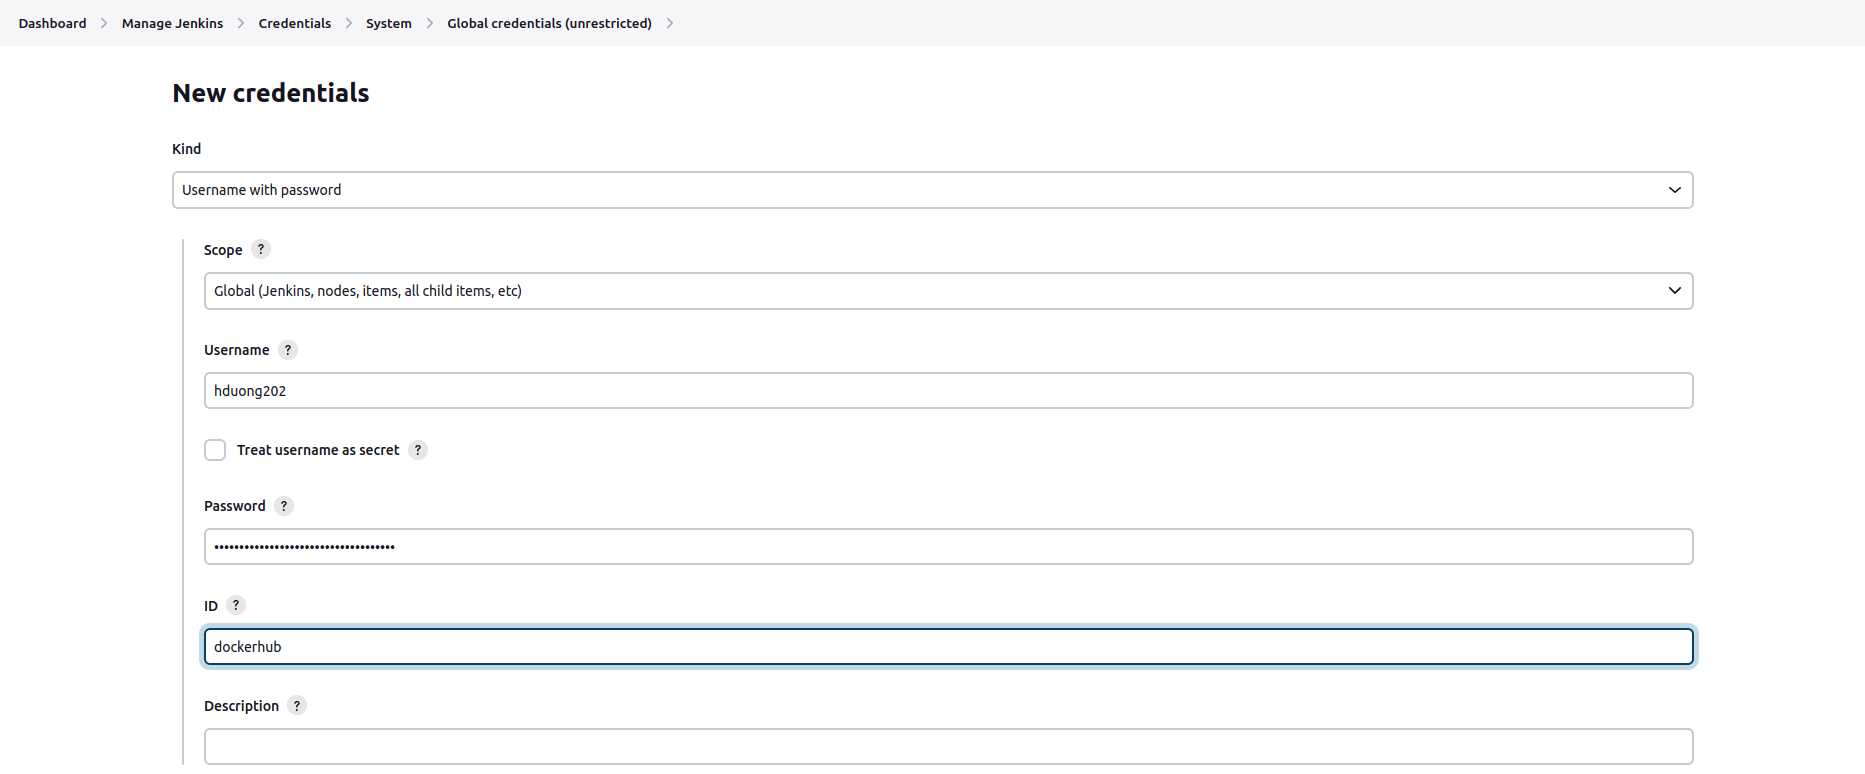
- Note: ID must be
-
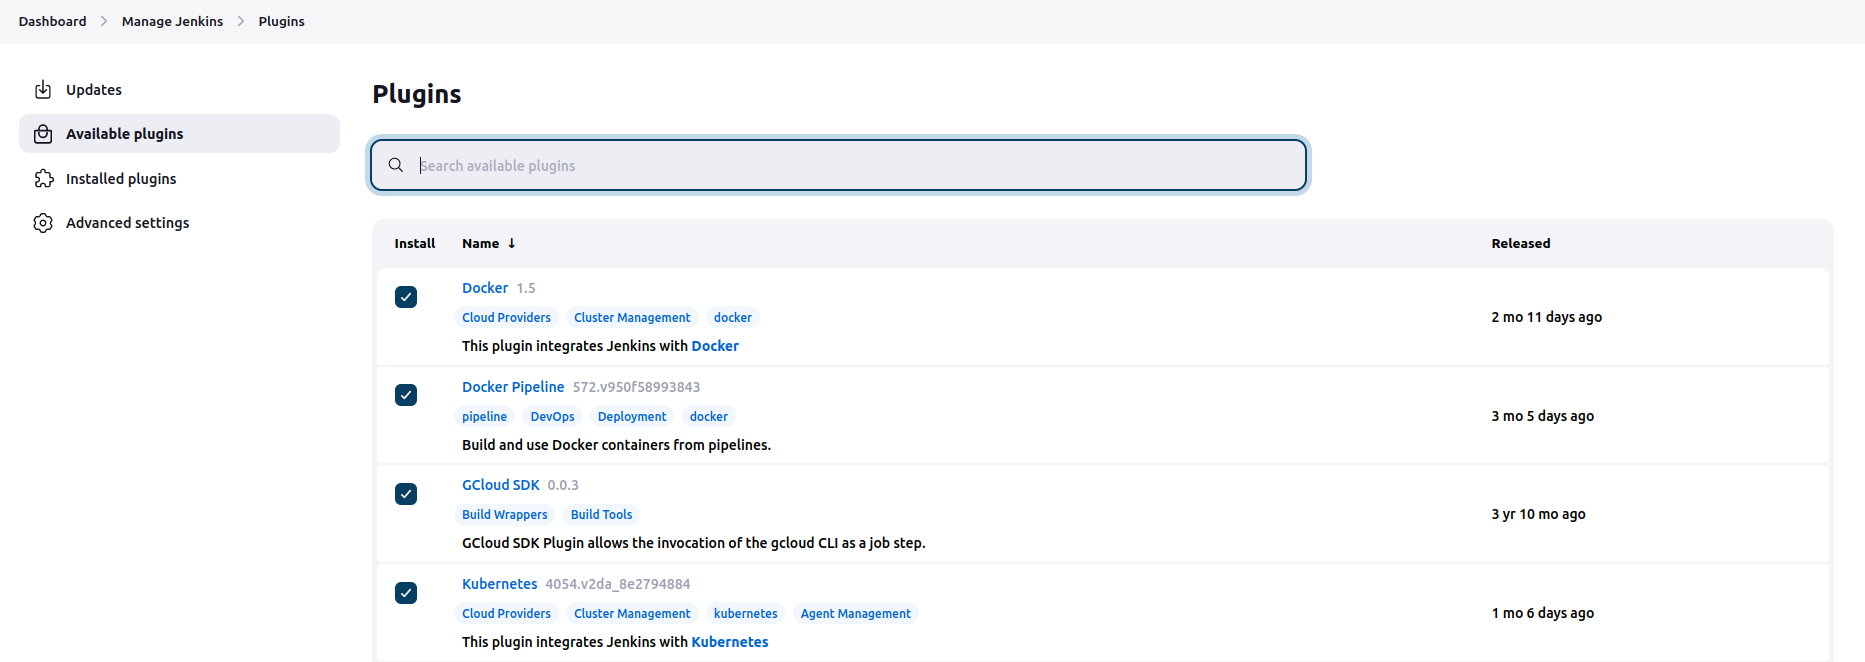
Install the Kubernetes, Docker, Docker Pineline, GCloud SDK Plugins at
Manage Jenkins/Pluginssudo docker restart jenkins -
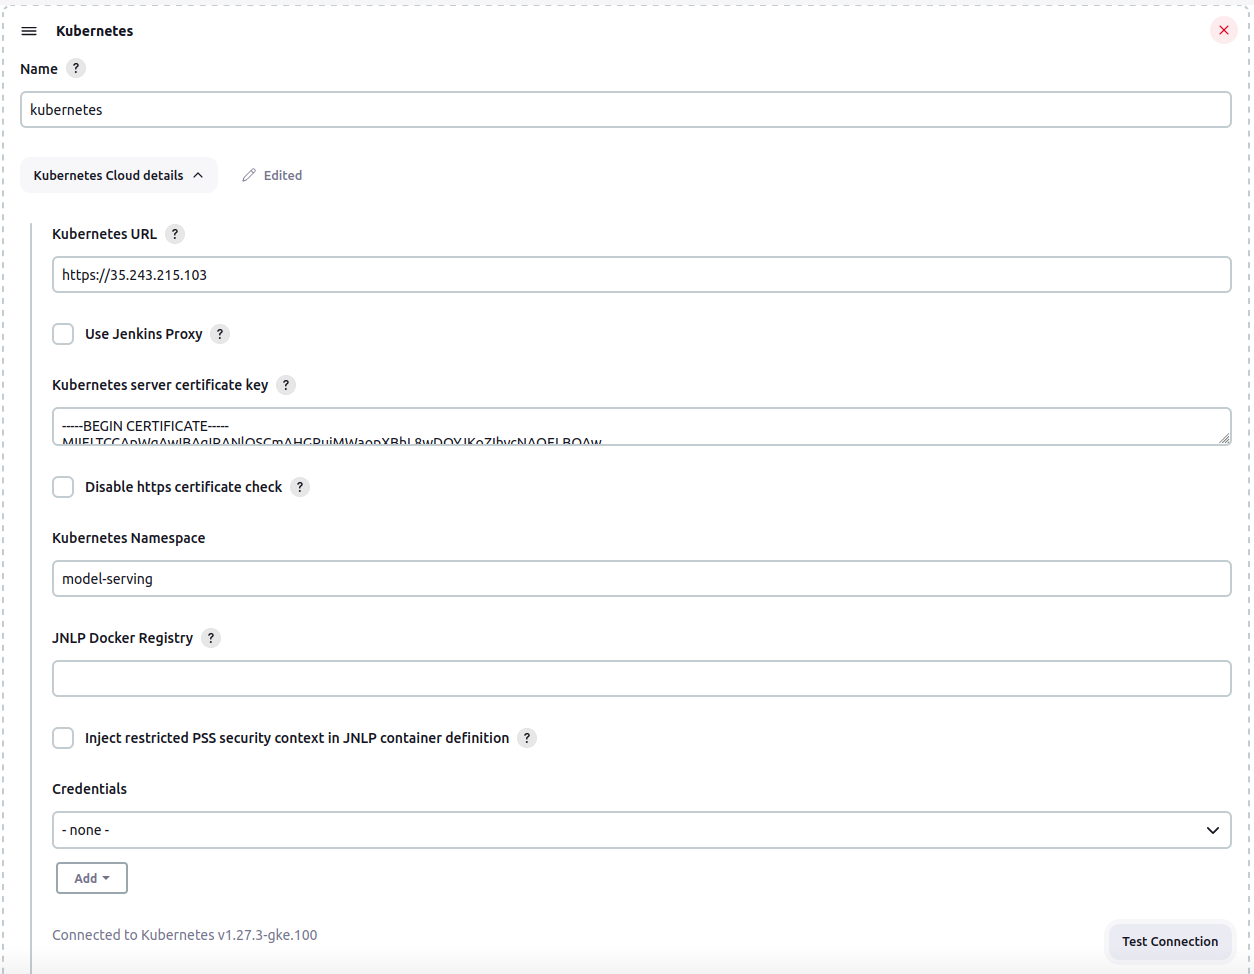
Setup Cloud Connection
- Create
clusterrolebinding
kubectl create clusterrolebinding cluster-admin-binding --clusterrole=cluster-admin --user=system:anonymous kubectl create clusterrolebinding cluster-admin-default-binding --clusterrole=cluster-admin --user=system:serviceaccount:model-serving:default - Create
-
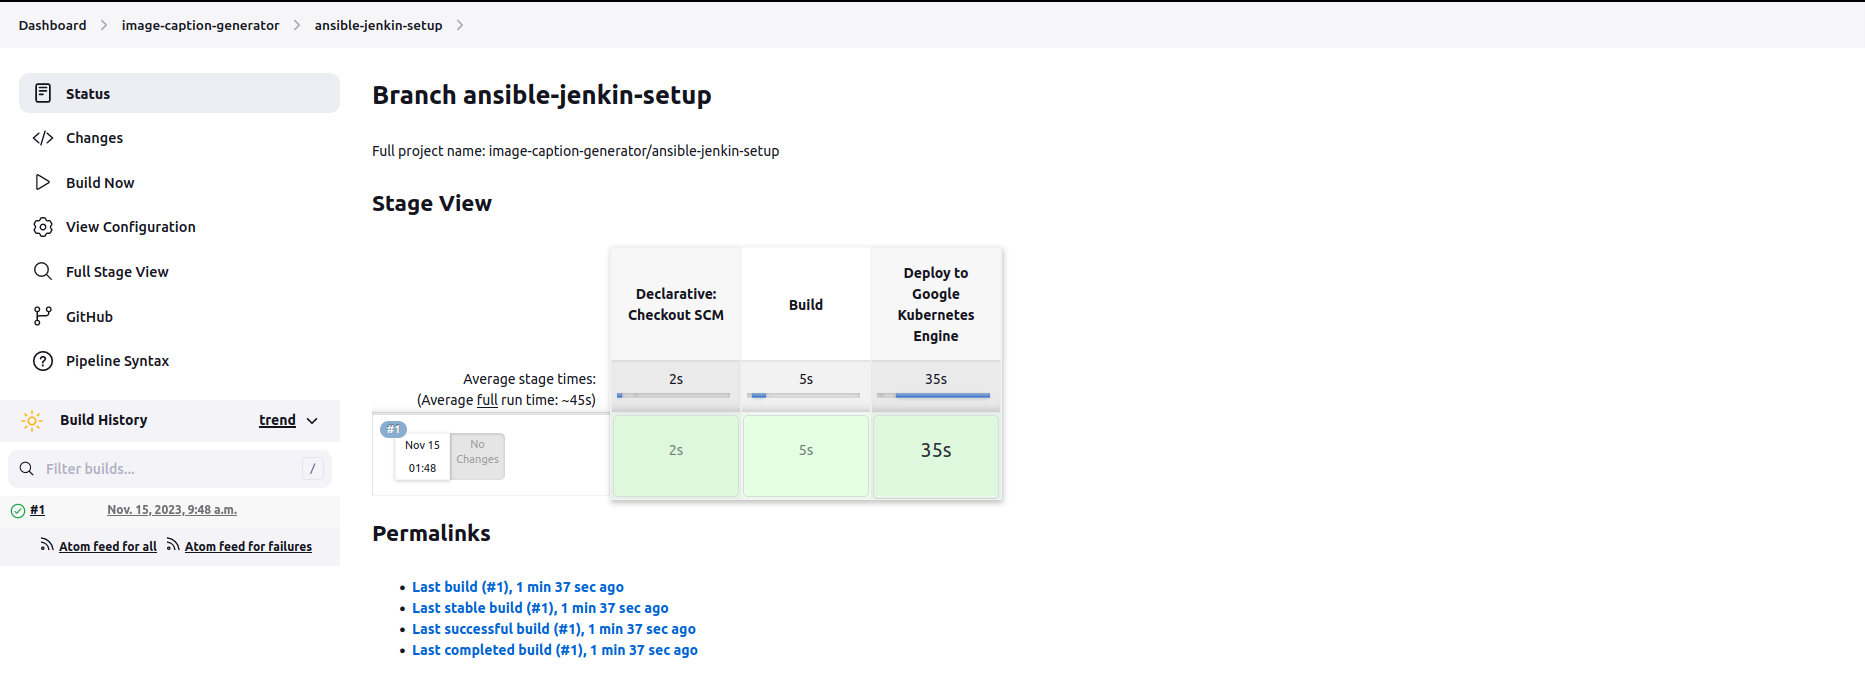
Build
