Machine Learning Project for Traffic Prediction.
Predict It! An Engineer’s Journey into Data Science
- Install R (I used homebrew for that).
brew tap homebrew/science brew install R - Install RStudio Desktop
- Open the R script traffic-forcast.R file.
- Run (Select all, press Command + Enter).
- To analyze the data run R script analysis.R.
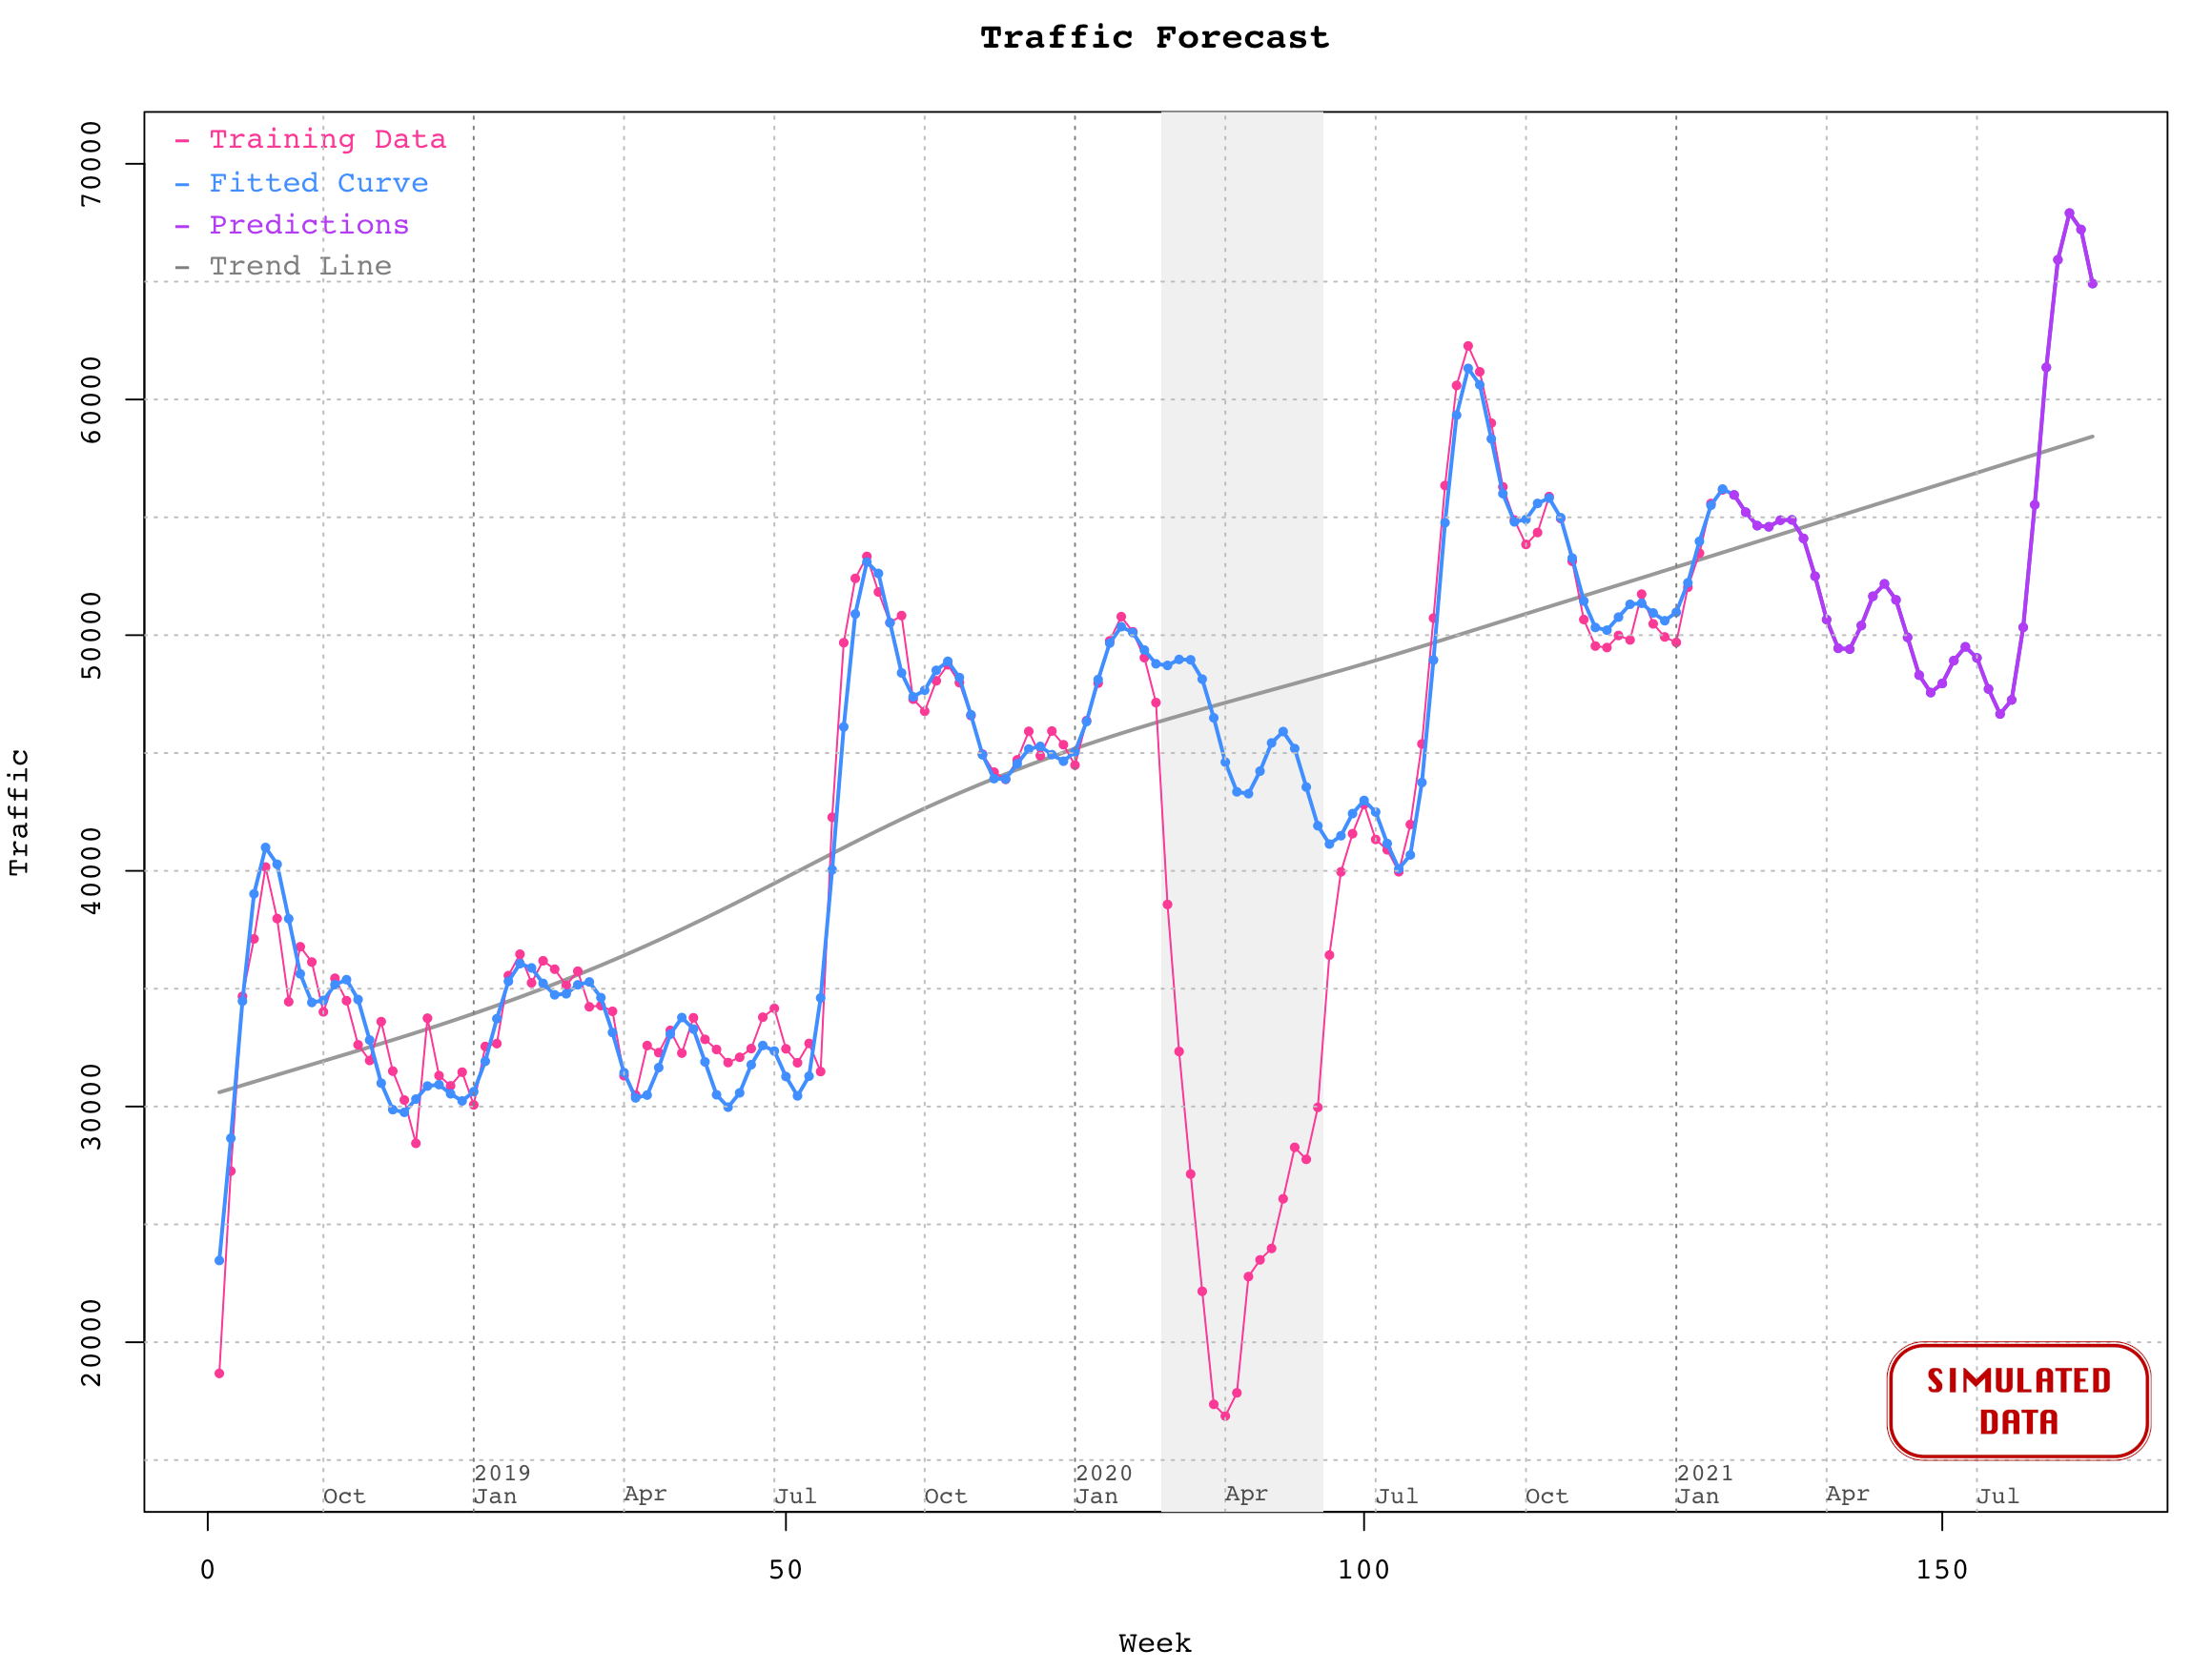
This is a linear regression model using sample traffic data as a time series dataset. Seasonality of the data is modeled using the Fourier series. And the trending of the data is calculated using a smooth spline. The predicted value is the total traffic expected. The source data set is simulated data for the weekly peak traffic.
- This approach supports multivariate (multiple variables) models compared to FaceBook's Prophet which supports univariate (single variable) models.
- We have excluded Covid shutdown period (Mar/Apr/May in 2020).
- We are using 80-20 split for training and testing.
year month week value   w         t    trend predicted
2018    10    3 34491  12  1.449966 32226.63  35383.63
2018    10    4 32619  13  1.570796 32374.66  34541.35
2018    12    2 33748  19  2.295779 33290.90  30870.00
2019     1    3 32670  25  3.020762 34288.30  33726.69
2019     2    1 36464  27  3.262423 34644.02  36061.64
All the datasets you see in this github repository are using simulated data. These datasets are used for education purposes only.
