This script generates a CSV report based on VM statistics in the V1 API, which is accessed via Prism Element. It creates a report with the following columns:
- Name
- Cluster Name
- Provisioned vCPUs
- Memory Capacity
- Disk Capacity
- CPU Usage (%) (Max)
- CPU Usage (%) (Average)
- Memory Consumed (GiB) (Max)
- Memory Consumed (GiB) (Average)
- Memory Usage (%) (Max)
- Memory Usage (%) (Average)
- Guest File System Utilization (%) (Max)
- Guest File System Utilization (%) (Average)
- Network - Data Receive Rate (KBps) (Max)
- Network - Data Receive Rate (KBps) (Average)
- Network - Data Transmit Rate (KBps) (Max)
- Network - Data Transmit Rate (KBps) (Average)
It has the following features:
- Includes both the max and average for each metric
- Displays the metric name in a human readable format (e.g. controller_user_bytes becomes Guest File System Utilization (%))
- Converts metric values into specific units (i.e. storage/memory in GiB, network traffic in KBps)
- Ability to pass in a custom duration (last x days), default is 30 days
By default, it will generate a report based on the last 30 days. The -d flag can be used to specify a duration in days (which can be 0 if you want a current point-in-time report) (see the Usage section)
- Recommend Python version 3.7 or later. Testing for this script was done with Python 3.7.11 on Mac OS X Catalina.
- Create an activate a virtual environment:
python3 -m venv venv
. venv/bin/activate
- Install dependencies
pip3 install -r requirements.txt
usage: vm_report.py [-h] [-u USERNAME] [-p PASSWORD] [-d DURATION]
                    [-f FILENAME]
                    pe_ip

positional arguments:
  pe_ip                 Prism Element IP address

optional arguments:
  -h, --help            show this help message and exit
  -u USERNAME, --username USERNAME
                        Prism Element username
  -p PASSWORD, --password PASSWORD
                        Prism Element password
  -d DURATION, --duration DURATION
                        Number of days to report on
  -f FILENAME, --filename FILENAME
                        Desired report filename
python3 ./vm_report.py <Prism_Element_IP> -u <username> -p <password>
The Prism Element IP is the only required parameter, however you will be prompted for the username and password if they are not passed.
Without any additional flags, the default duration will be 30 days and the default report filename will be <cluster_name>-vm-report-<date>.csv
python3 ./vm_report.py <Prism_Element_IP> -u <username> -p <password> -d 60 -f myreport.csv
The above will gather data for the last 60 days and write to file myreport.csv
By default, this script does not require a verified SSL connection to Prism Element. If you have configured Prism Element with a valid SSL certificate and require SSL certificate verification in your environment, please comment the following line:
urllib3.disable_warnings(urllib3.exceptions.InsecureRequestWarning)
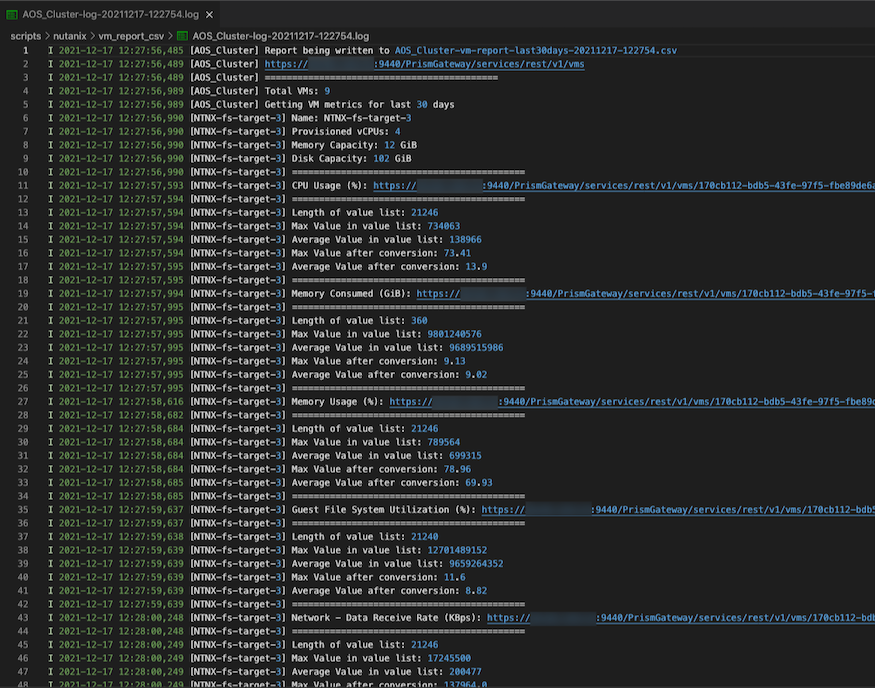
Everything is logged to <cluster_name>-log-<date>.log
The following API calls are used in this script:
GET https://{pe_ip}:9440/PrismGateway/services/rest/v1/clusters
GET https://{pe_ip}:9440/PrismGateway/services/rest/v1/vms
GET https://{pe_ip}:9440/PrismGateway/services/rest/v1/vms/stats/?metrics={vm_metric}&startTimeInUsecs={startTimeInUsecs}
For more information, take a look at this blog post: https://www.nutanix.dev/2019/09/23/getting-vm-performance-metrics-via-api/
The defined attributes and metrics are found in config.json, and mapped to a desired display name.
For additional attributes and metrics, please use https://{pe_ip}:9440/PrismGateway/services/rest/v1/vms to see a full list of attributes and metrics that can be queried.
This script was tested and verified working against:
- AOS 5.10.3.2
- AOS 5.20.1.1
- AOS 6.0.2
Sample Log File
Sample Report Output
On a 14-node cluster with 375 total VMs the script took ~16 minutes to run.
This script is unofficial and is not supported or actively maintained by Nutanix in any way.
In addition, please also be advised that this script may contain code that may not follow best practices. Please check through each script to ensure the configuration suits your requirements.
Changes may be required before this script can be used in production environments.
Please see the .disclaimer file distributed with this repository.

