2018 US Senate Election Data-Exploration is a project done as part of the UIC's CS418 Coursework under Professor Dr. Gonzalo Bello.
'election_train.csv' and 'demographics_train.csv' are the datasets based on which this project has been built. These csv files can be found in the 'data' directory of this repository.
Report and PDF file of the IPython notebook are available in the 'report' directory.
| Name | UIN | NetID |
|---|---|---|
| Lakshmanan Meiyappan | 671997054 | lmeiya2 |
| Sriman Cherukuru | 659640984 | scheru4 |
| Gnanamanickam Arumugaperumal | 670991279 | garumu3 |
Note: Setting up Anaconda distribution is highly recommended to run this project.
- Download or clone this repository into your workspace.
- Naviagte to the Downloaded\Cloned directory: 2018Election-Data-Visualization/.
- Install the required libraries using the command
pip install requirements.txt - Open IPython Notebook: EDA-2018SenateElections.ipynb with Jupyter Notebook.
- Run the cells sequentially to see the execution results.
Legend:
- 0 represents Republican party &
- 1 represents Democrat party.
-
Counties and Winners Visualization:
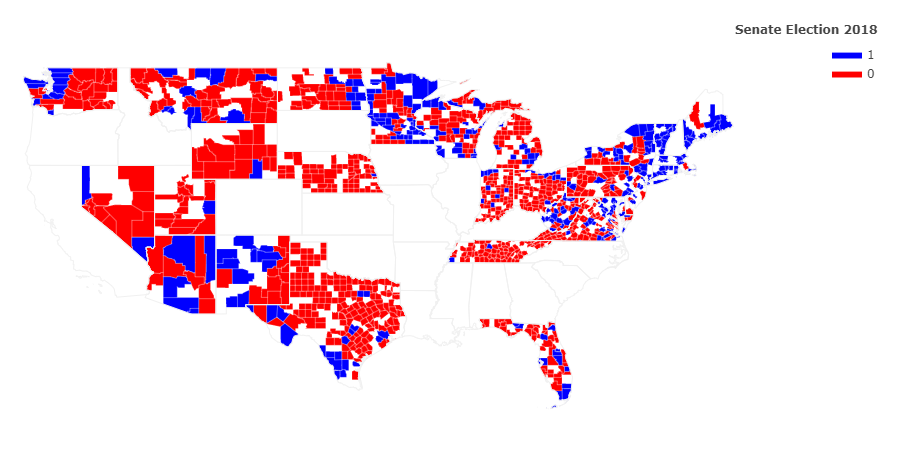
-
Age groups and their voting patterns
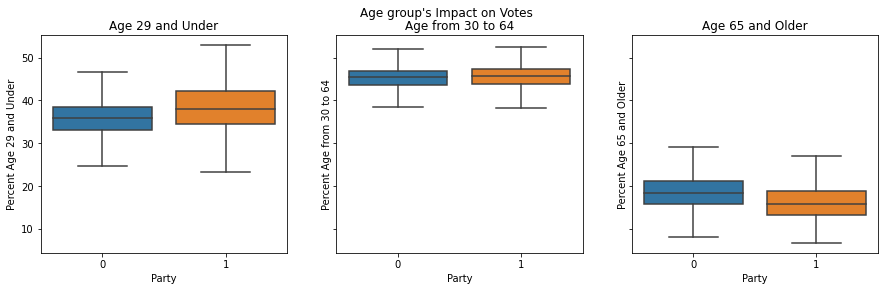
-
Education Level and its impact on voting patterns
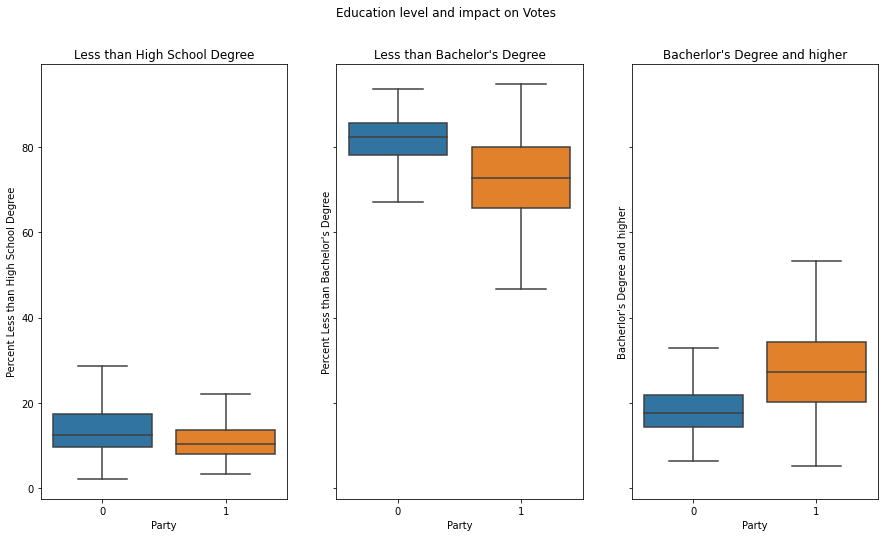
-
Ethnicity and its impact on voting patterns


-
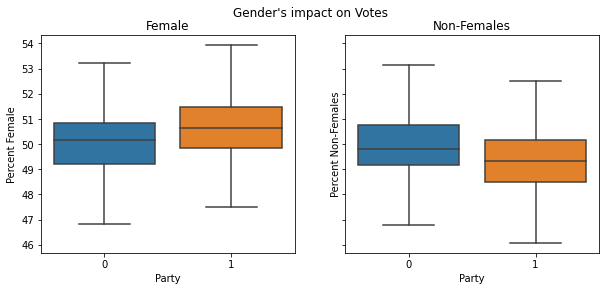
Gender and its impact on voting patterns