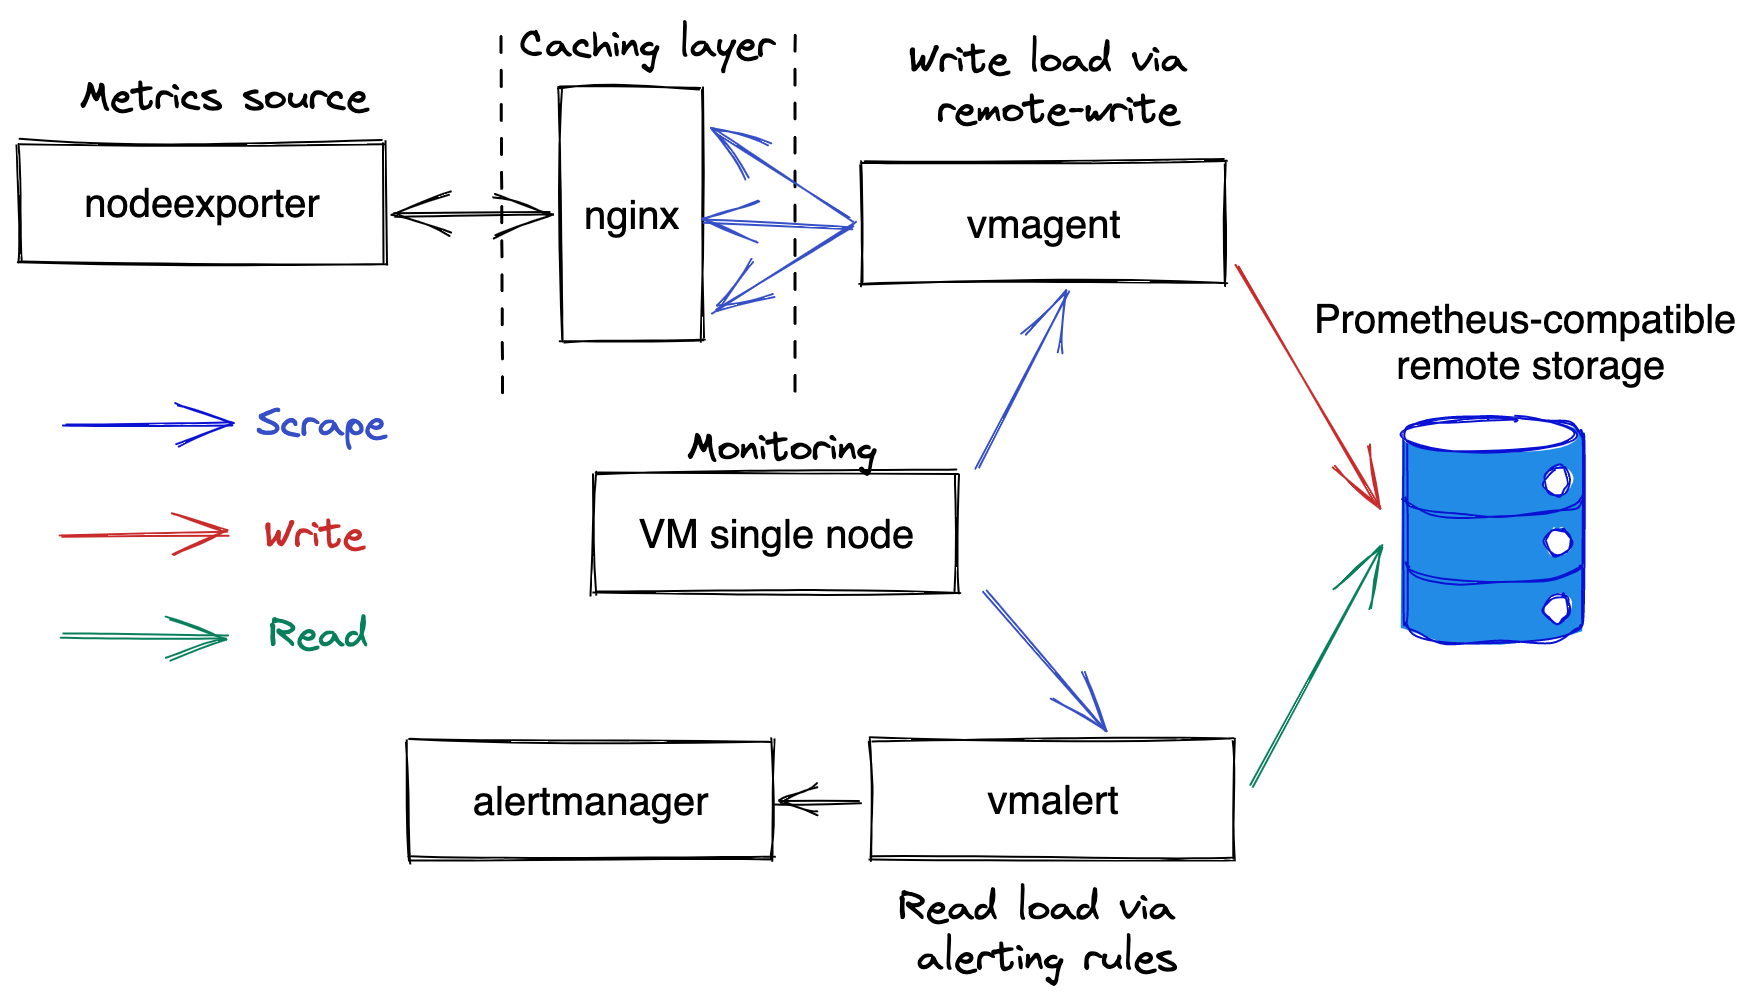
Prometheus-benchmark allows testing data ingestion and querying performance for Prometheus-compatible systems on production-like workload.
Prometheus-benchmark provides the following features:
- It generates production-like workload for both data ingestion and querying paths:
- It generates write workload from real node_exporter metrics. This is the most frequently used exporter for Prometheus metrics.
- It generates read workload from typical alerting rules for
node_exportermetrics - see chart/files/alerts.yaml.
- It allows generating time series churn rate via scrapeConfigUpdatePercent and scrapeConfigUpdateInterval options. The churn rate is typical for Kubernetes monitoring.
- Multiple systems can be tested simultaneously - just add multiple named entries
under
remoteStoragessection at chart/values.yaml.
The following systems can be tested with prometheus-benchmark:
- Single-node version of VictoriaMetrics:
- Cluster version of VictoriaMetrics:
- Grafana Mimir:
- Cortex:
- Thanos:
The prometheus-benchmark scrapes metrics from node_exporter and pushes the scraped metrics to the configured Prometheus-compatible remote storage systems. These systems must support Prometheus remote_write API for measuring data ingestion performance. Optionally these systems may support Prometheus querying API for measuring query performance.
The helm chart deploys the following pods:
vmagentwith the following containers:- nodeexporter - collects real metrics from Kubernetes node where it runs.
- nginx - caches responses from
nodeexporterfor 1 second in order to reduce load on it when scraping big number of targets. - vmagent-config-updater - generates config for target scraping. It is also responsible for generating time series churn rate via periodic updating of the generated targets.
- vmagent - scrapes
nodeexportermetrics vianginxfor targets generated byvmagent-config-updater.
vmalertwith the following containers:- vmalert - periodically executes these alerting rules (aka read queries) against the testes remote storage.
- alertmanager - receives notifications from
vmalert. It is configured as a blackhole for the received notifications.vmalertpod is optional - it is used for generating read query load.
vmsingle- this pod runs a single-node VictoriaMetrics, which collects metrics fromvmagentandvmalertpods, so they could be analyzed during benchmark execution.
- Benchmarking Prometheus-compatible time series databases
- Monitoring benchmark: how to generate 100 million samples/s of production-like data
- Grafana Mimir and VictoriaMetrics: performance tests
It is expected that Helm3 is already installed and configured to communicate with Kubernetes cluster where the prometheus-benchmark should run.
Check out the prometheus-benchmark sources:
git clone https://github.com/VictoriaMetrics/prometheus-benchmark
cd prometheus-benchmark
Then edit the chart/values.yaml with the desired config params. Then optionally edit the chart/files/alerts.yaml with the desired queries to execute at remote storage systems. Then run the following command in order to install the prometheus-benchmark components in Kubernetes and start the benchmark:
make installRun the following command in order to inspect the metrics collected by the benchmark:
make monitorAfter that go to http://localhost:8428/targets in order to see which metrics are collected by the benchmark.
See monitoring docs for details.
After the benchmark is complete, run the following command for removing prometheus-benchmark components from Kubernetes:
make deleteBy default the prometheus-benchmark is deployed in vm-benchmark Kubernetes namespace.
The namespace can be overridden via NAMESPACE environment variable.
For example, the following command starts the prometheus-benchmark chart in foobar k8s namespace:
NAMESPACE=foobar make installSee the Makefile for more details on available make commands.
The benchmark collects various metrics from its components. These metrics
are available for querying at http://localhost:8428/vmui after running make monitor command.
The following metrics might be interesting to look at during the benchmark:
- Data ingestion rate:
sum(rate(vm_promscrape_scraped_samples_sum{job="vmagent"})) by (remote_storage_name)
- 99th percentile for the duration to execute queries at chart/files/alerts.yaml:
max(vmalert_iteration_duration_seconds{quantile="0.99",job="vmalert"}) by (remote_storage_name)
- 99th percentile for the duration to push the collected data to the configured remote storage systems at chart/values.yaml:
histogram_quantile(0.99,
  sum(increase(vmagent_remotewrite_duration_seconds_bucket{job="vmagent"}[5m])) by (vmrange,remote_storage_name)
)
It is recommended also to check the following metrics in order to verify whether the configured remote storage is capable to handle the configured workload:
- The number of dropped data packets when sending them to the configured remote storage. If the value is bigger than zero, then the remote storage refuses to accept incoming data. It is recommended inspecting remote storage logs and vmagent logs in this case.
sum(rate(vmagent_remotewrite_packets_dropped_total{job="vmagent"})) by (remote_storage_name)
- The number of retries when sending data to remote storage. If the value is bigger than zero, then this is a sign that the remote storage cannot handle the workload. It is recommended inspecting remote storage logs and vmagent logs in this case.
sum(rate(vmagent_remotewrite_retries_count_total{job="vmagent"})) by (remote_storage_name)
- The amounts of pending data at vmagent side, which isn't sent to remote storage yet.
If the graph grows, then the remote storage cannot keep up with the given data ingestion rate.
Sometimes increasing the
writeConcurrencyat chart/values.yaml may help if there is a high network latency between vmagent at prometheus-benchmark and the remote storage.
sum(vm_persistentqueue_bytes_pending{job="vmagent"}) by (remote_storage_name)
- The number of errors when executing queries from chart/files/alerts.yaml. If the value is bigger than zero, then the remote storage cannot handle the query workload. It is recommended inspection remote storage logs and vmalert logs in this case.
sum(rate(vmalert_execution_errors_total{job="vmalert"})) by (remote_storage_name)
The prometheus-benchmark doesn't collect metrics from the tested remote storage systems.
It is expected that a separate monitoring is set up for whitebox monitoring
of the tested remote storage systems.
