Code in support of using Amazon Sustainability Data Initiative (ASDI) data, specifically Sentinal-2) for analyzing deforestation in Brazil.
This repo provides scripts that download and process the satellite imagery for a given month and spatial location. From this imagery, the forest cover is calculated and stored. Using the API, a user can optain the forest cover values to make temporal comparisons.
-
Sentinal-2 imagery is pulled using the SentinalHub API tool, due to its simplicity. However, we did experiment with https://github.com/RemotePixel/aws-sat-api-py, but found its data tile retrieval ability inferior to Sentinel Hub's implementation.
-
Imagery is stored in Amazon S3 for each time stamp, including
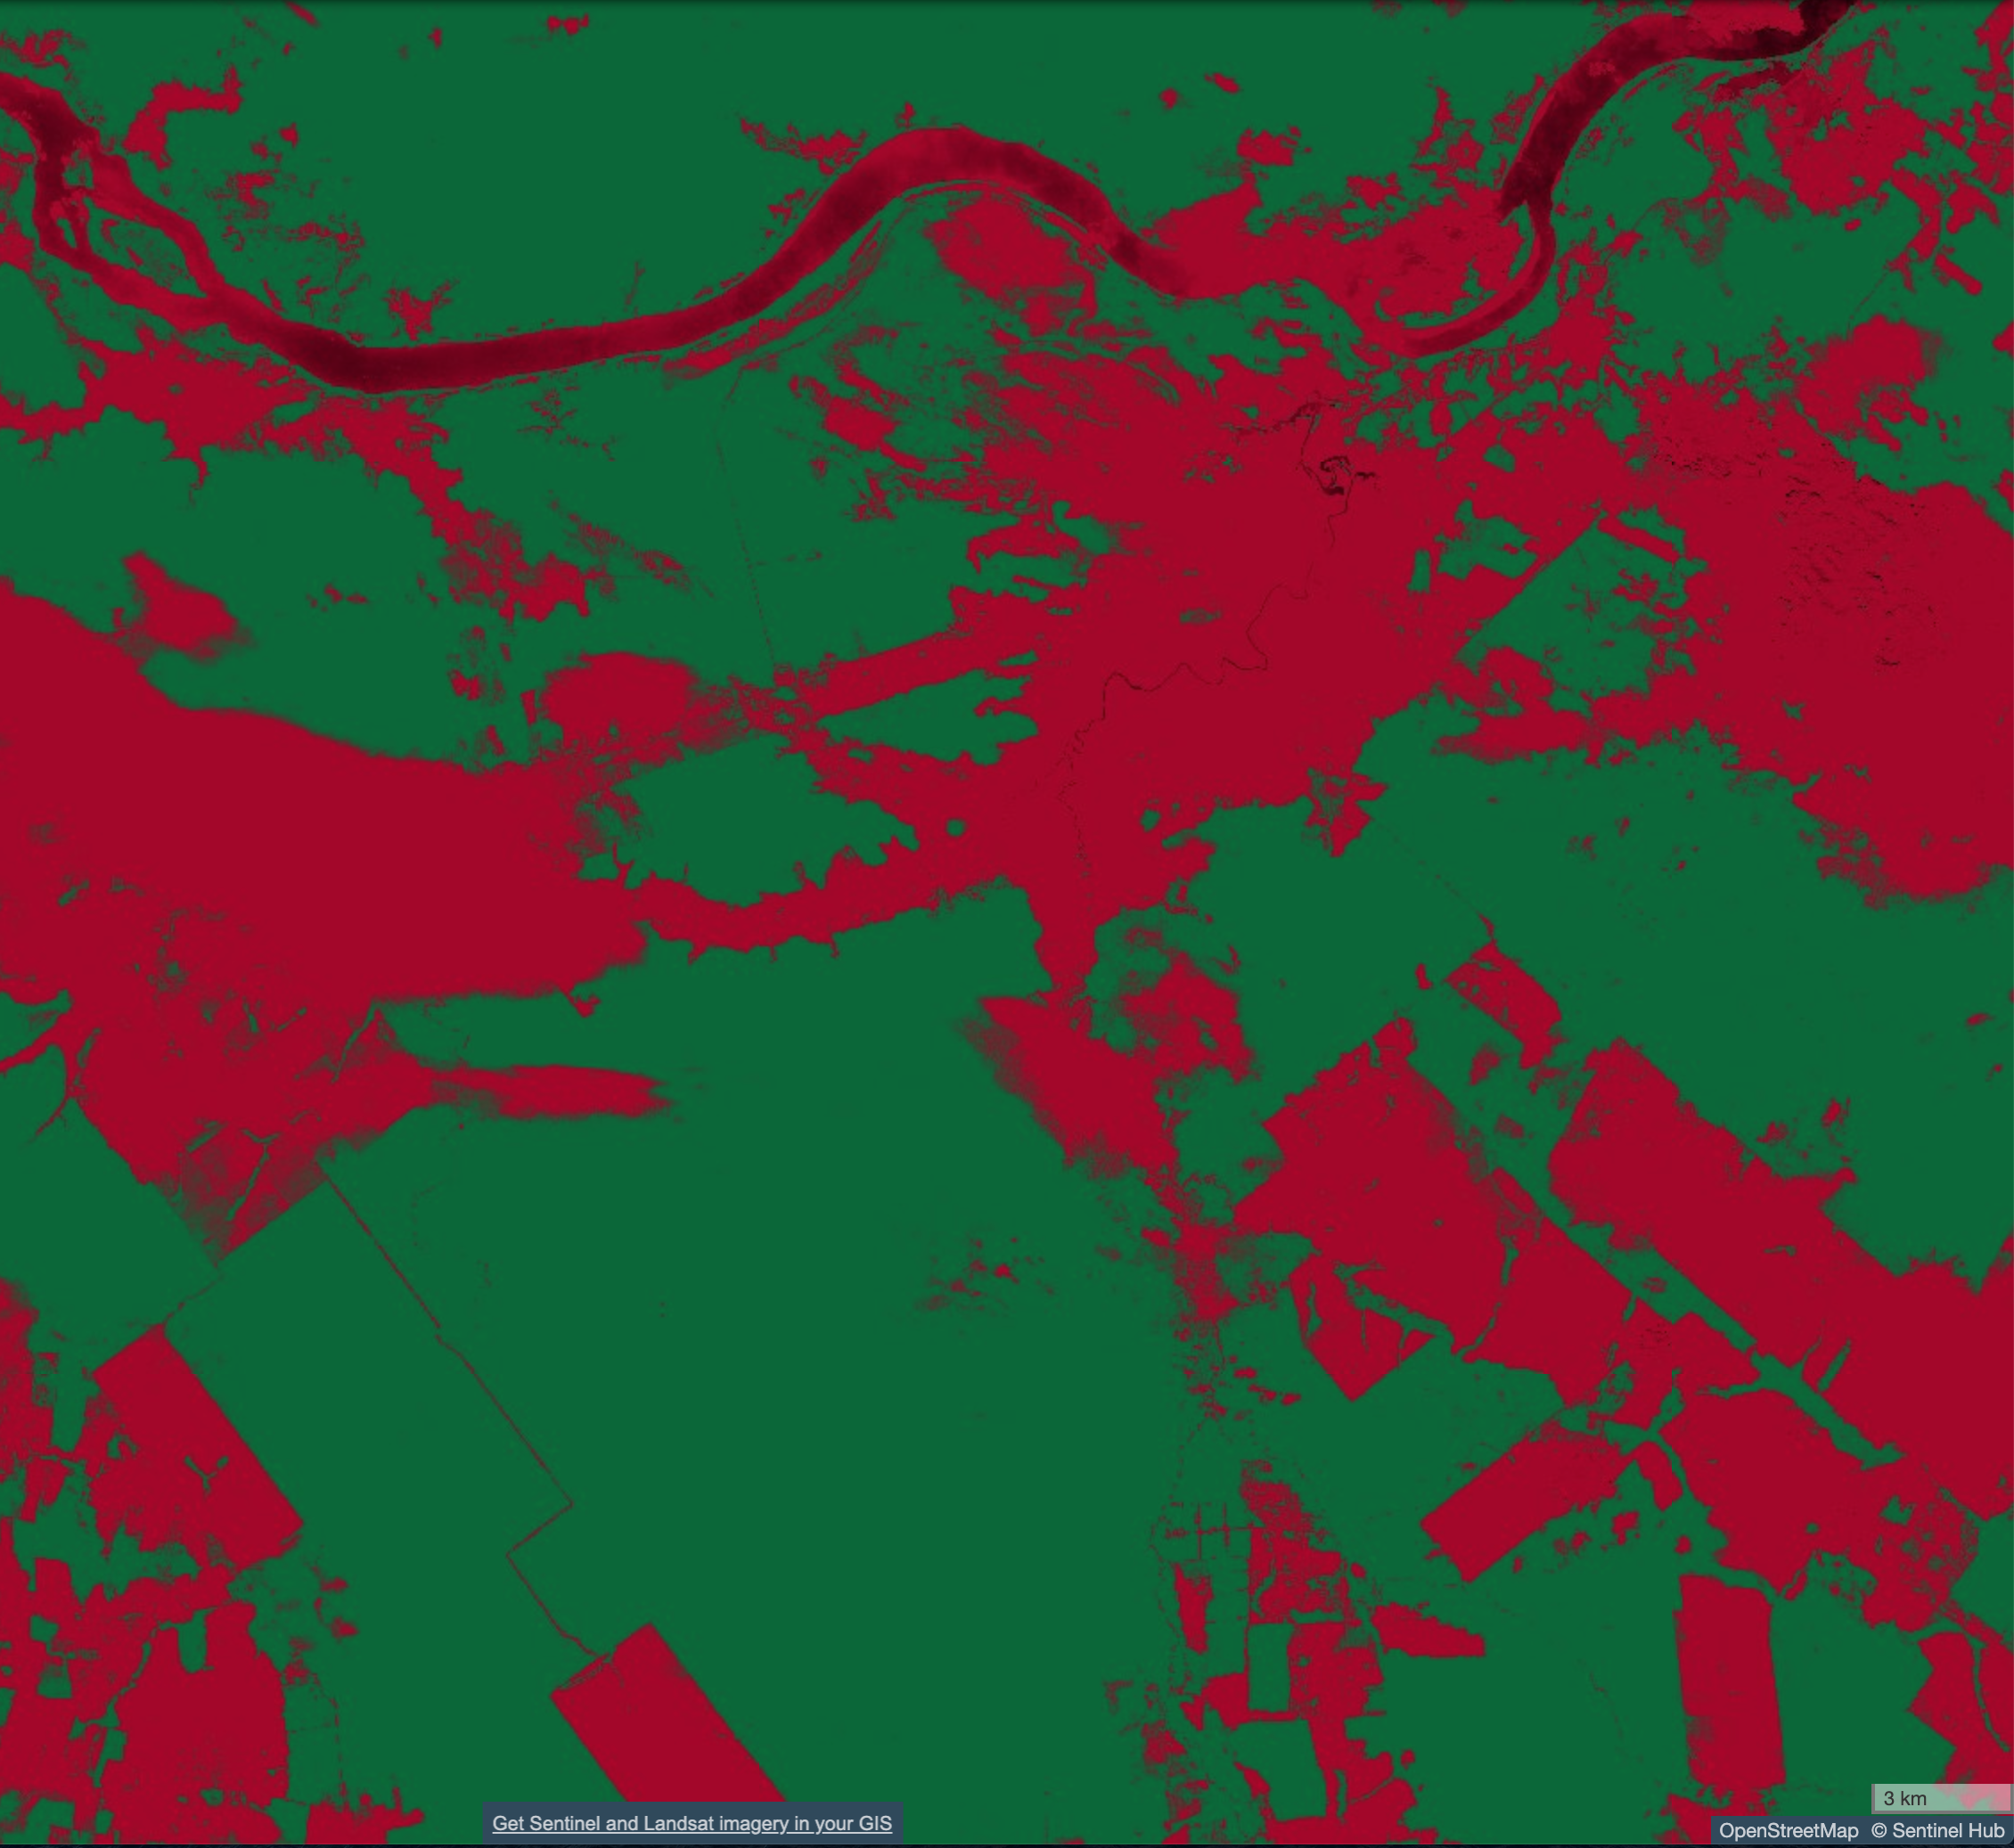
- Normalized difference vegetation index (NDVI) image, which is the a RGB image, where green indicates forest cover.
- NVDI Porto Velho, Brazil 09/25/2019:
- NVDI Porto Velho, three years ago Brazil 09/30/2016:
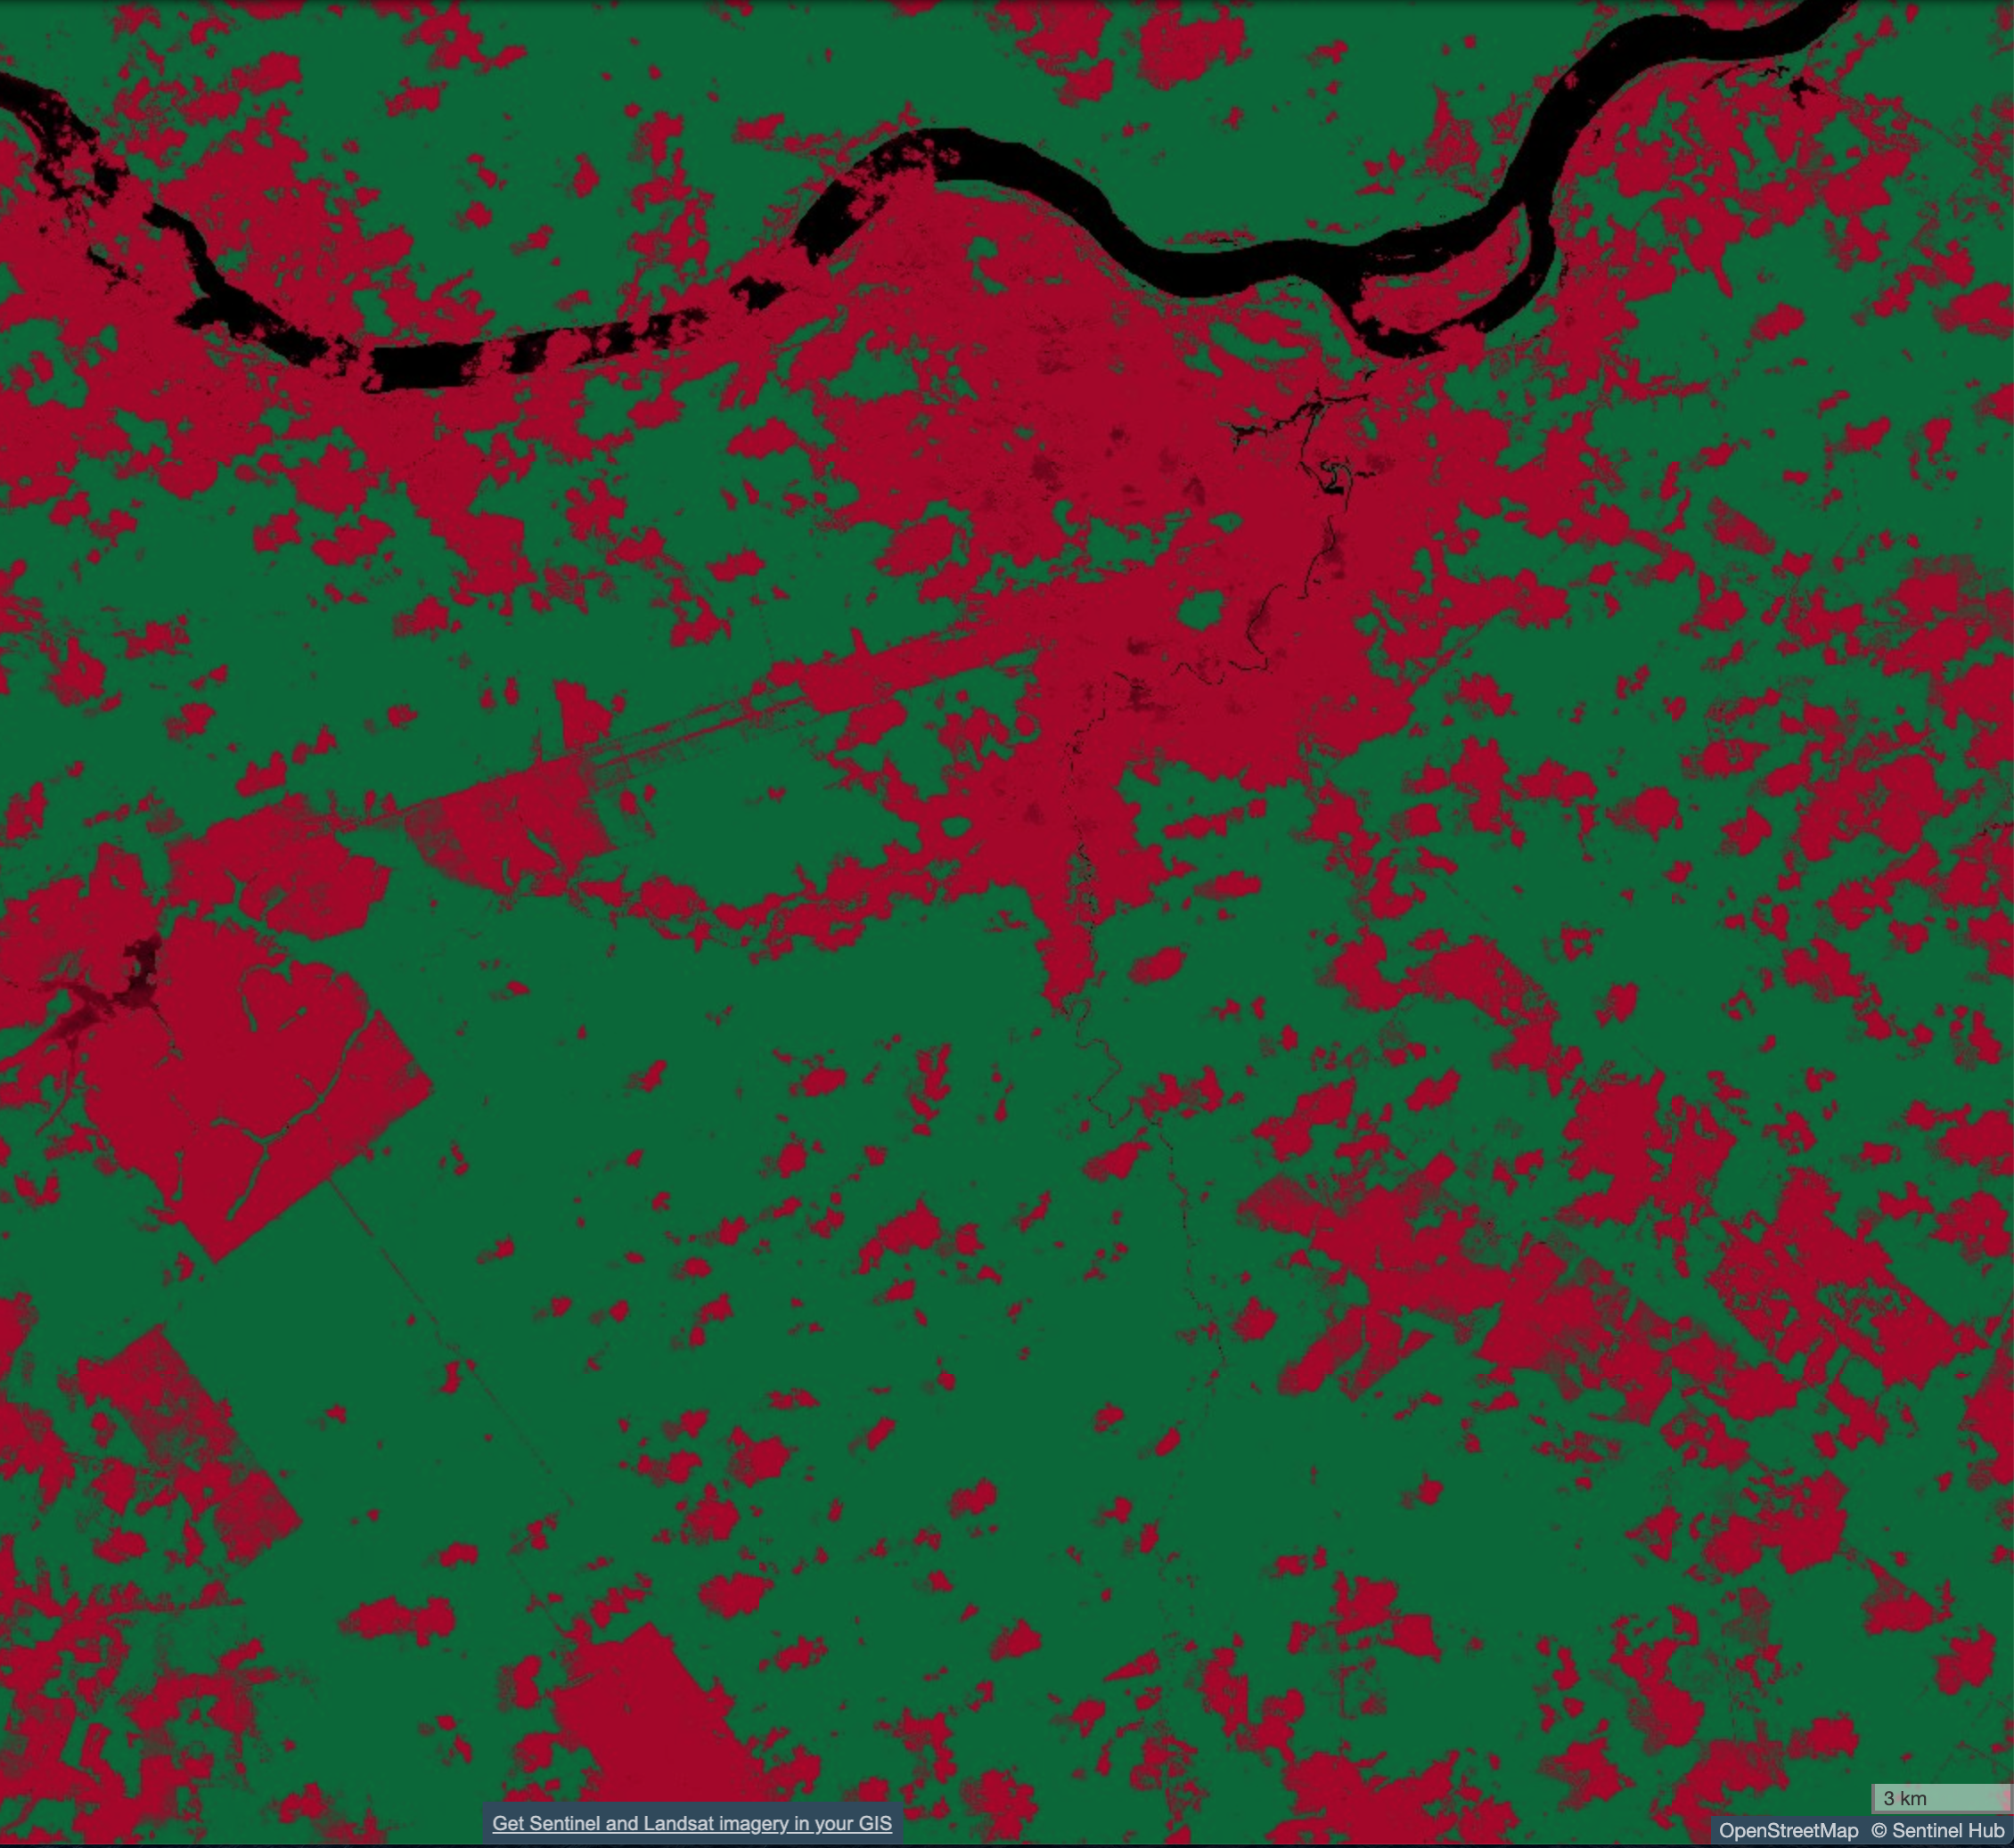 . The amount of green is observable forest canopy, with which we can estimated loss of tree cover
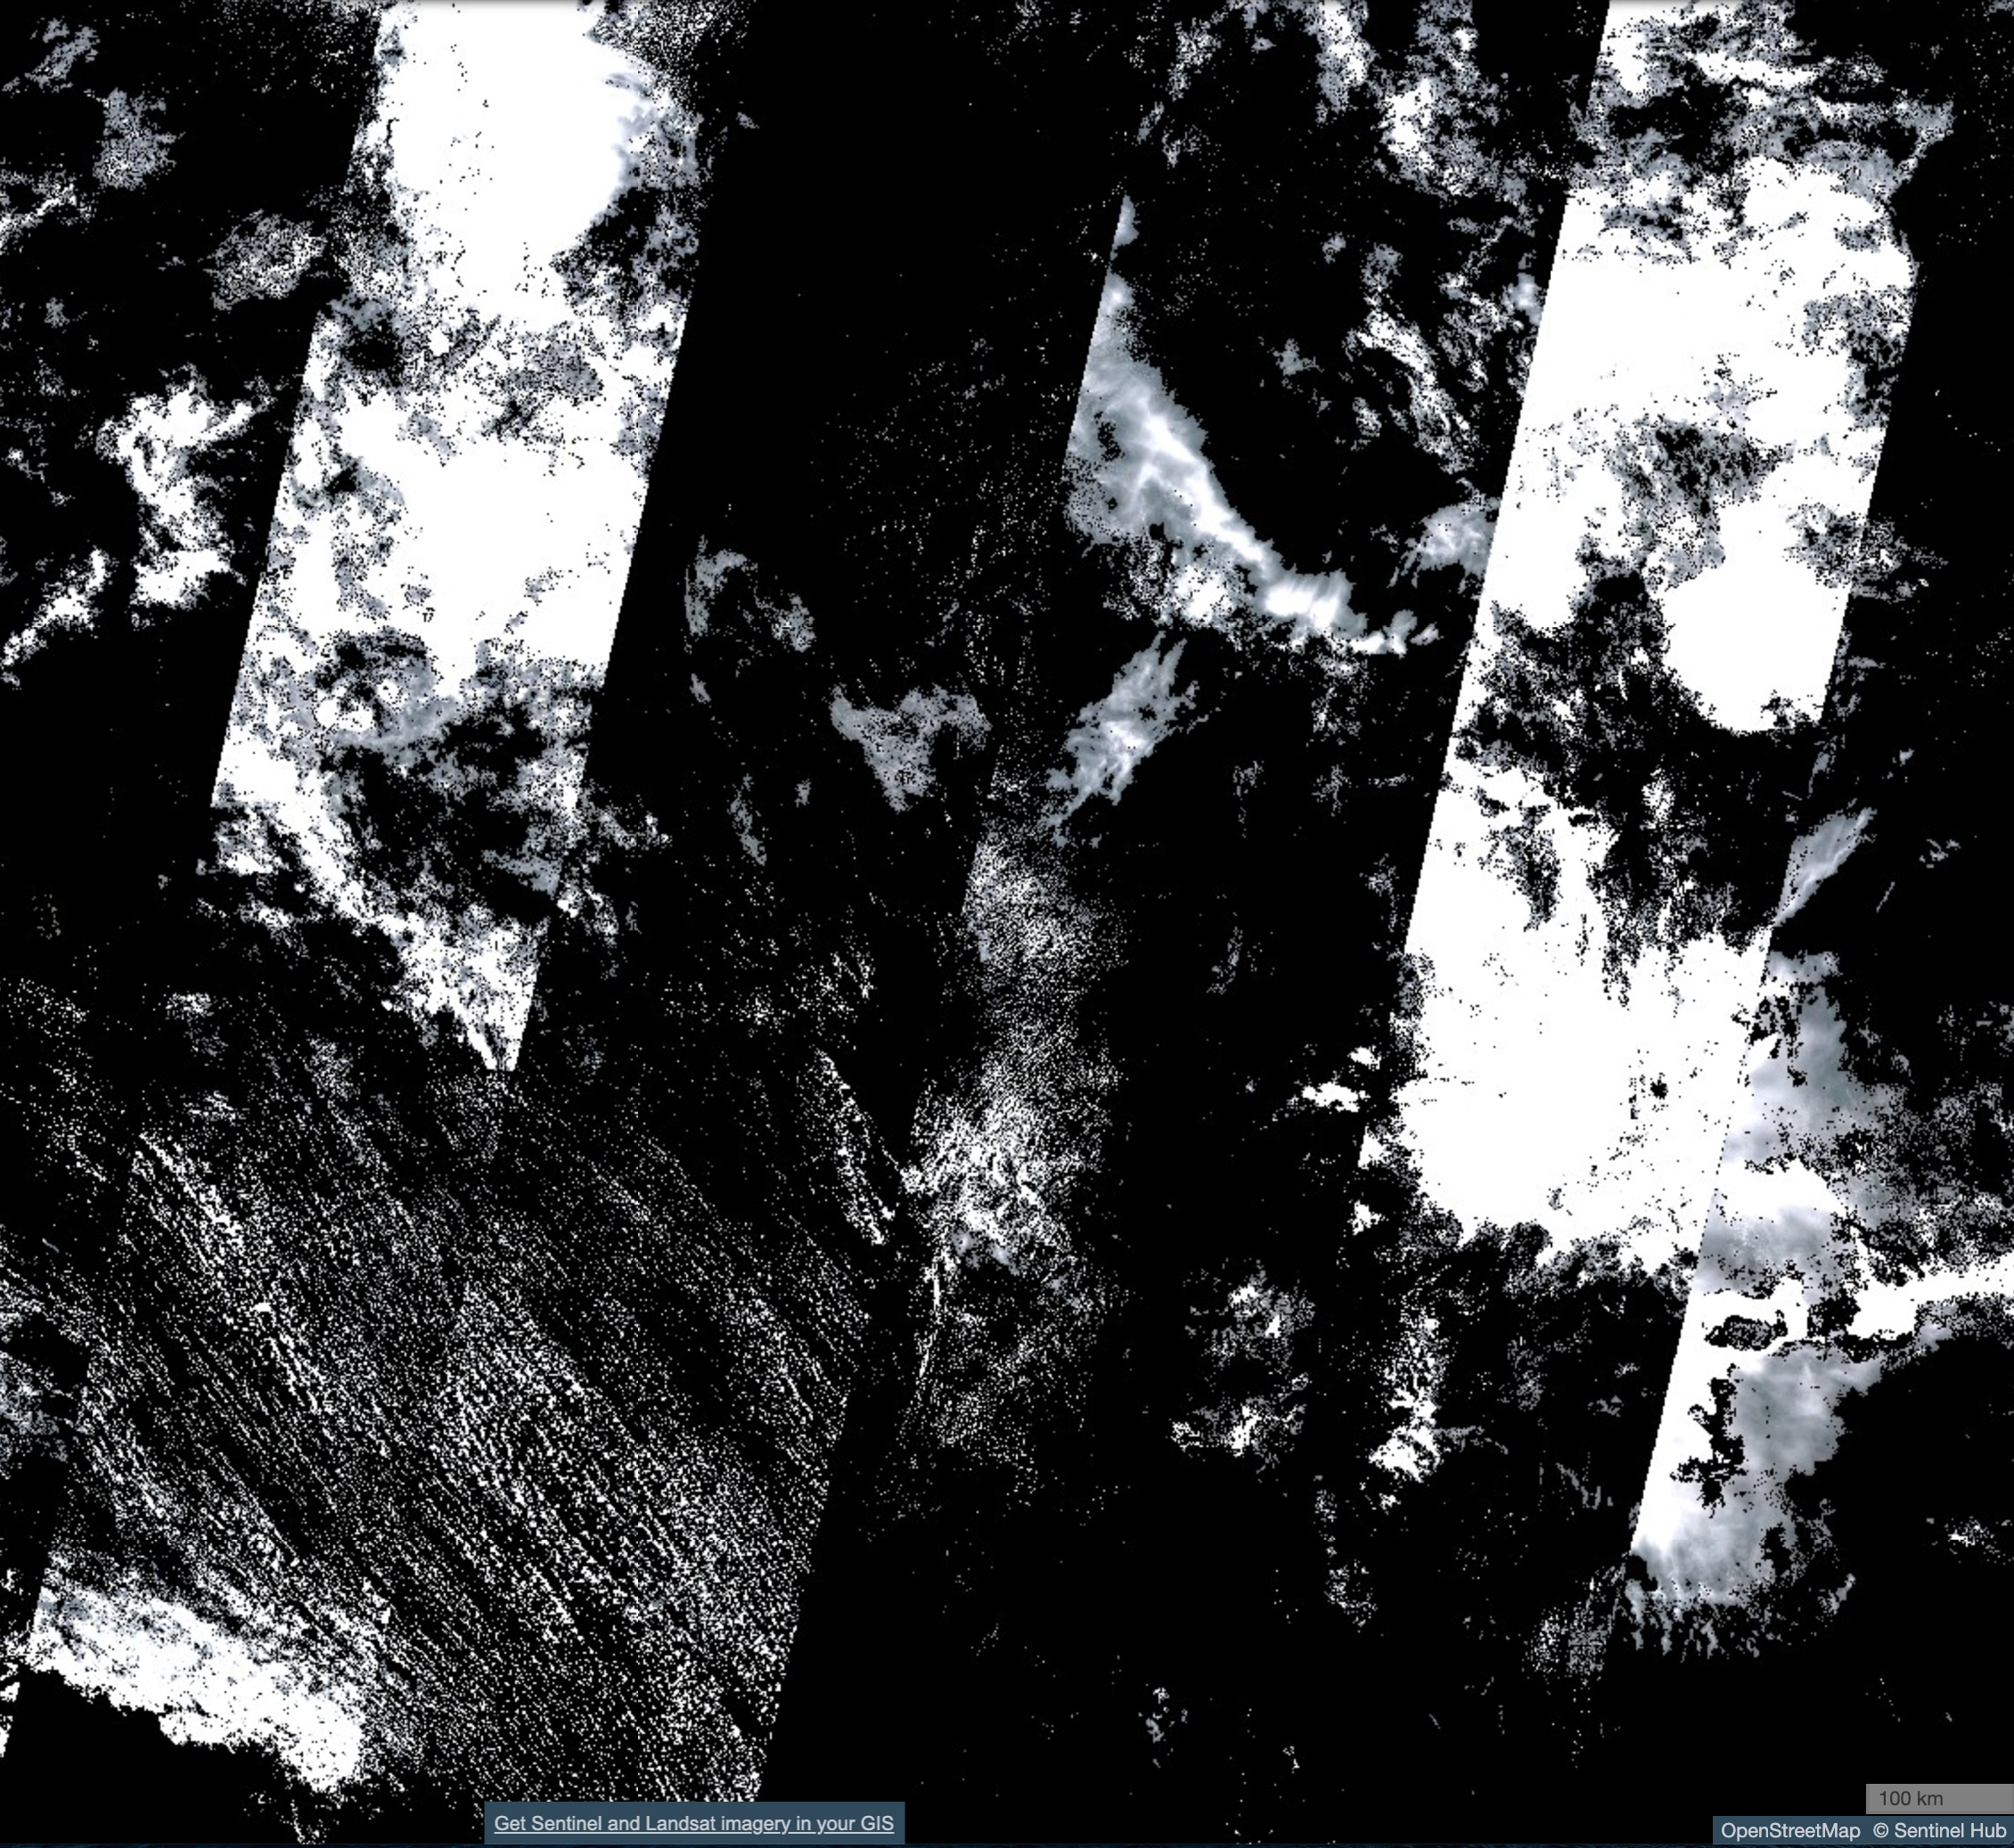
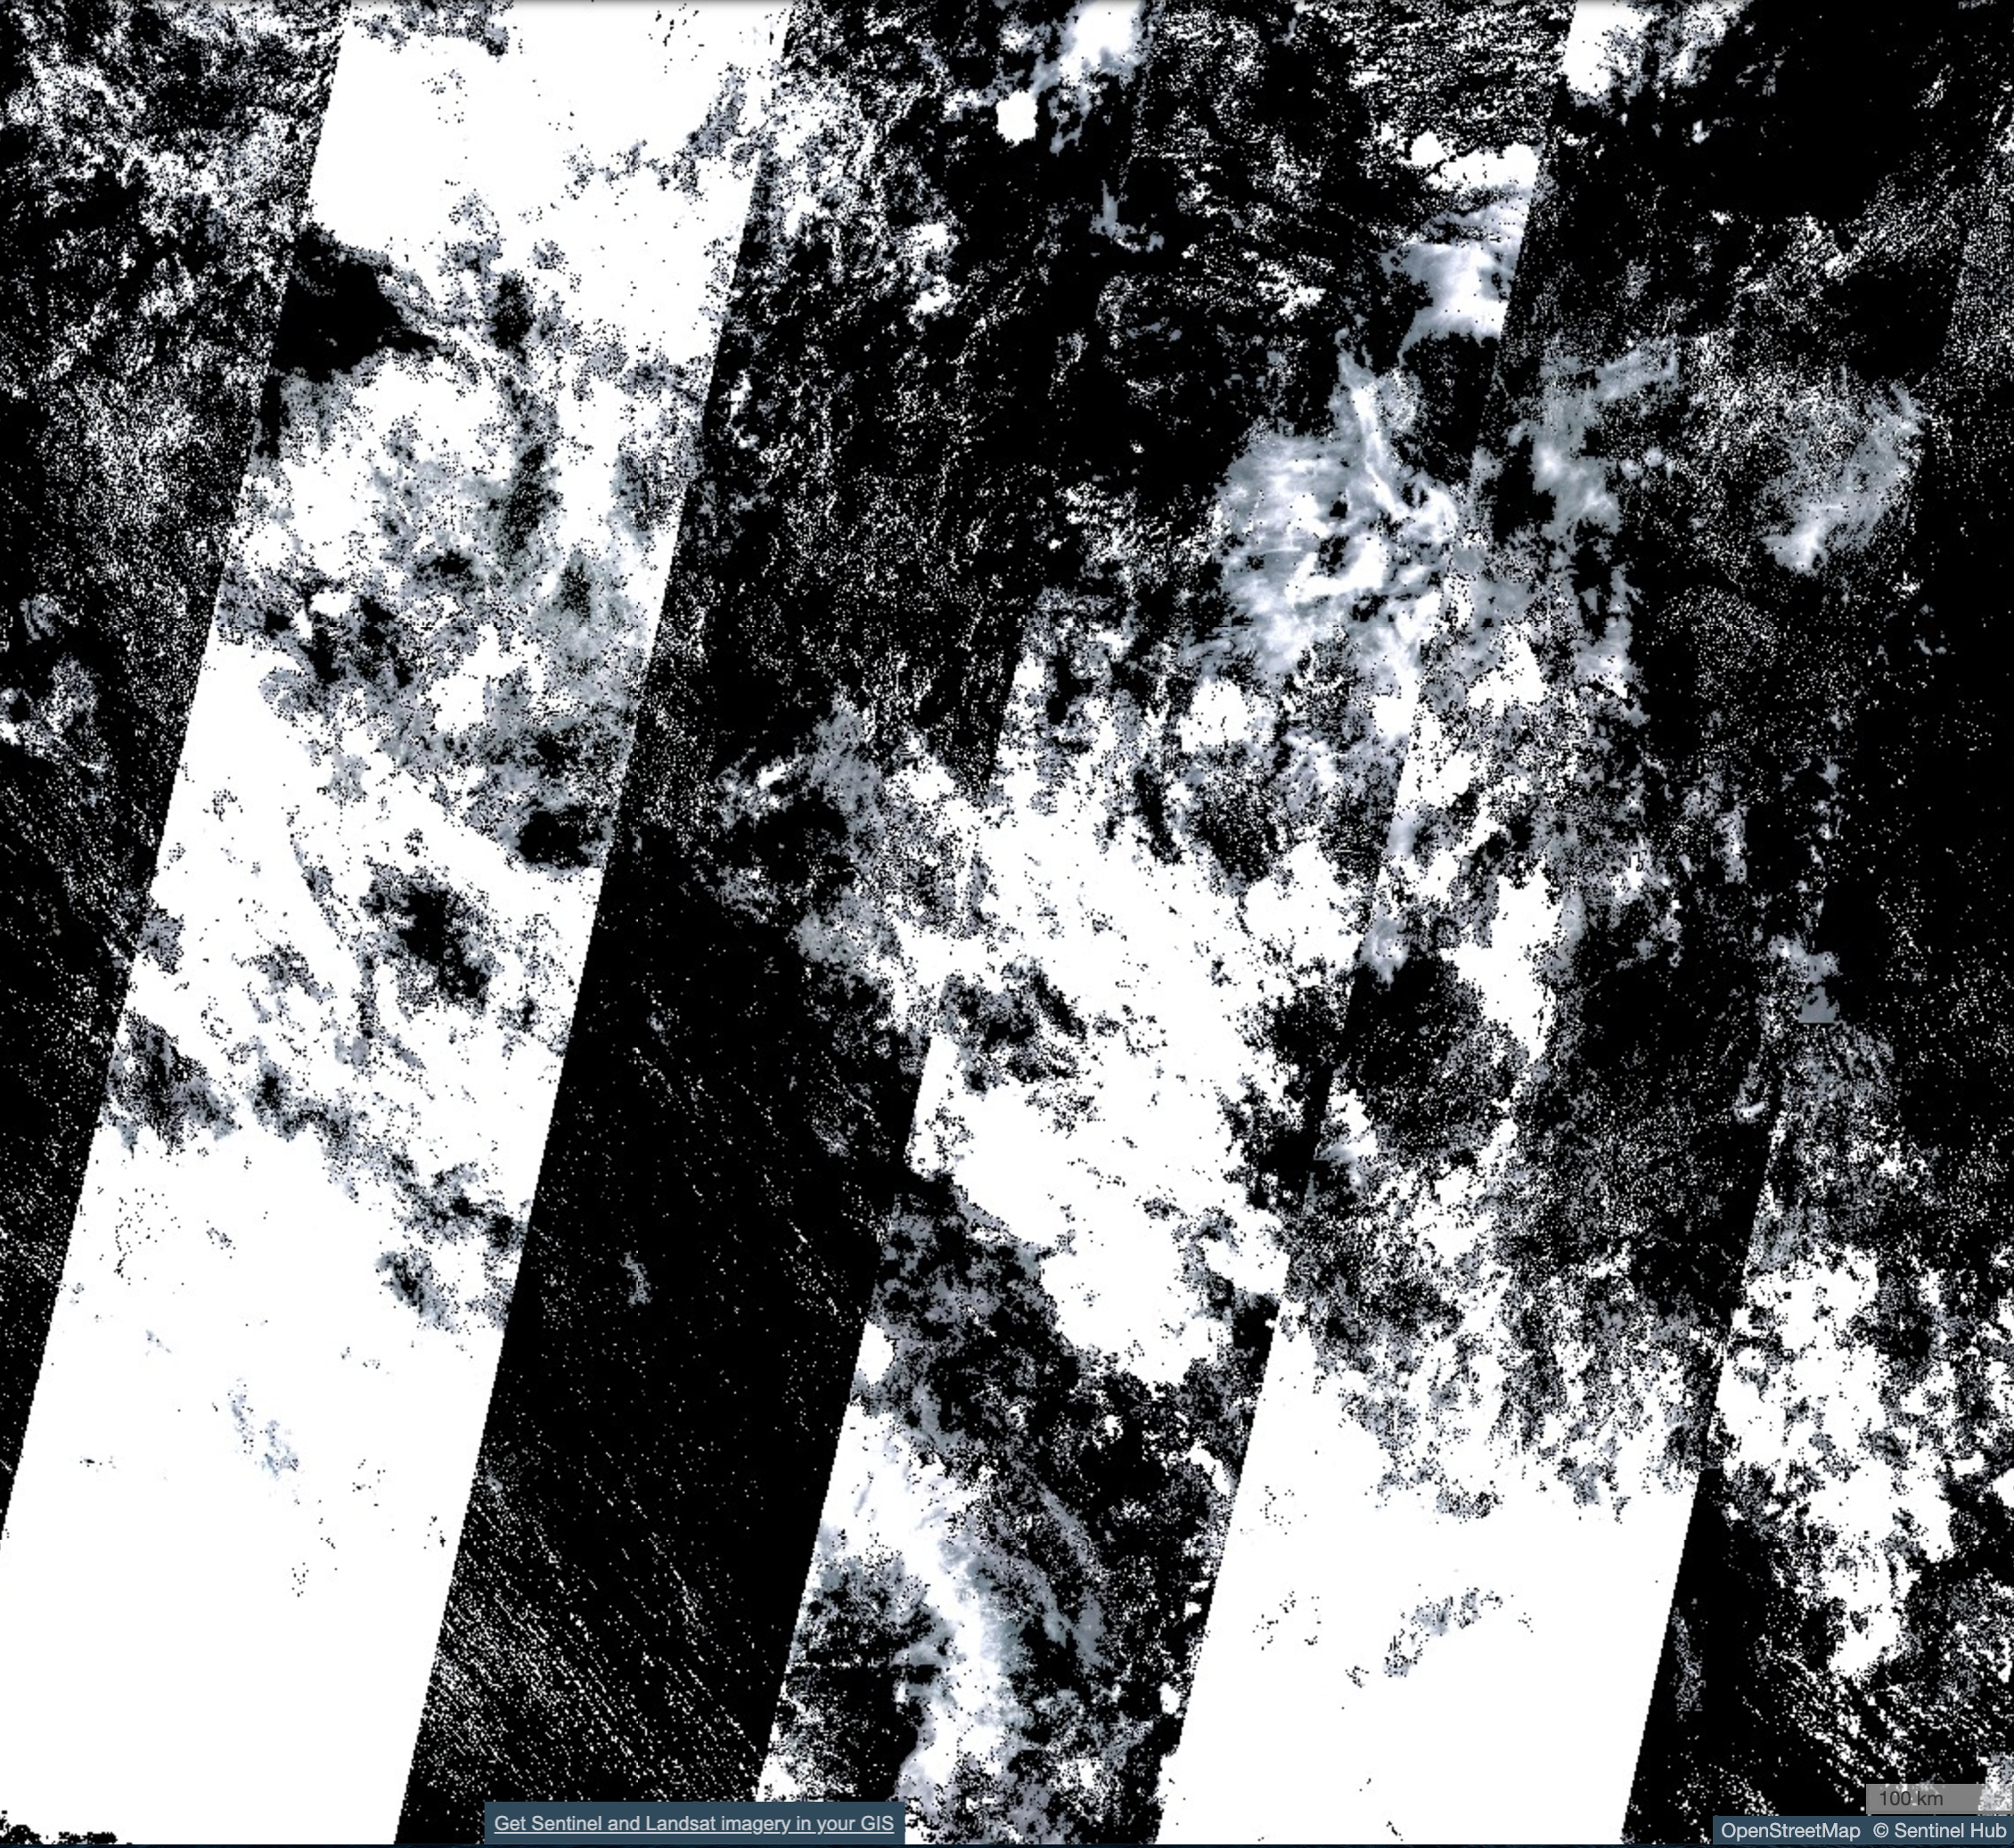
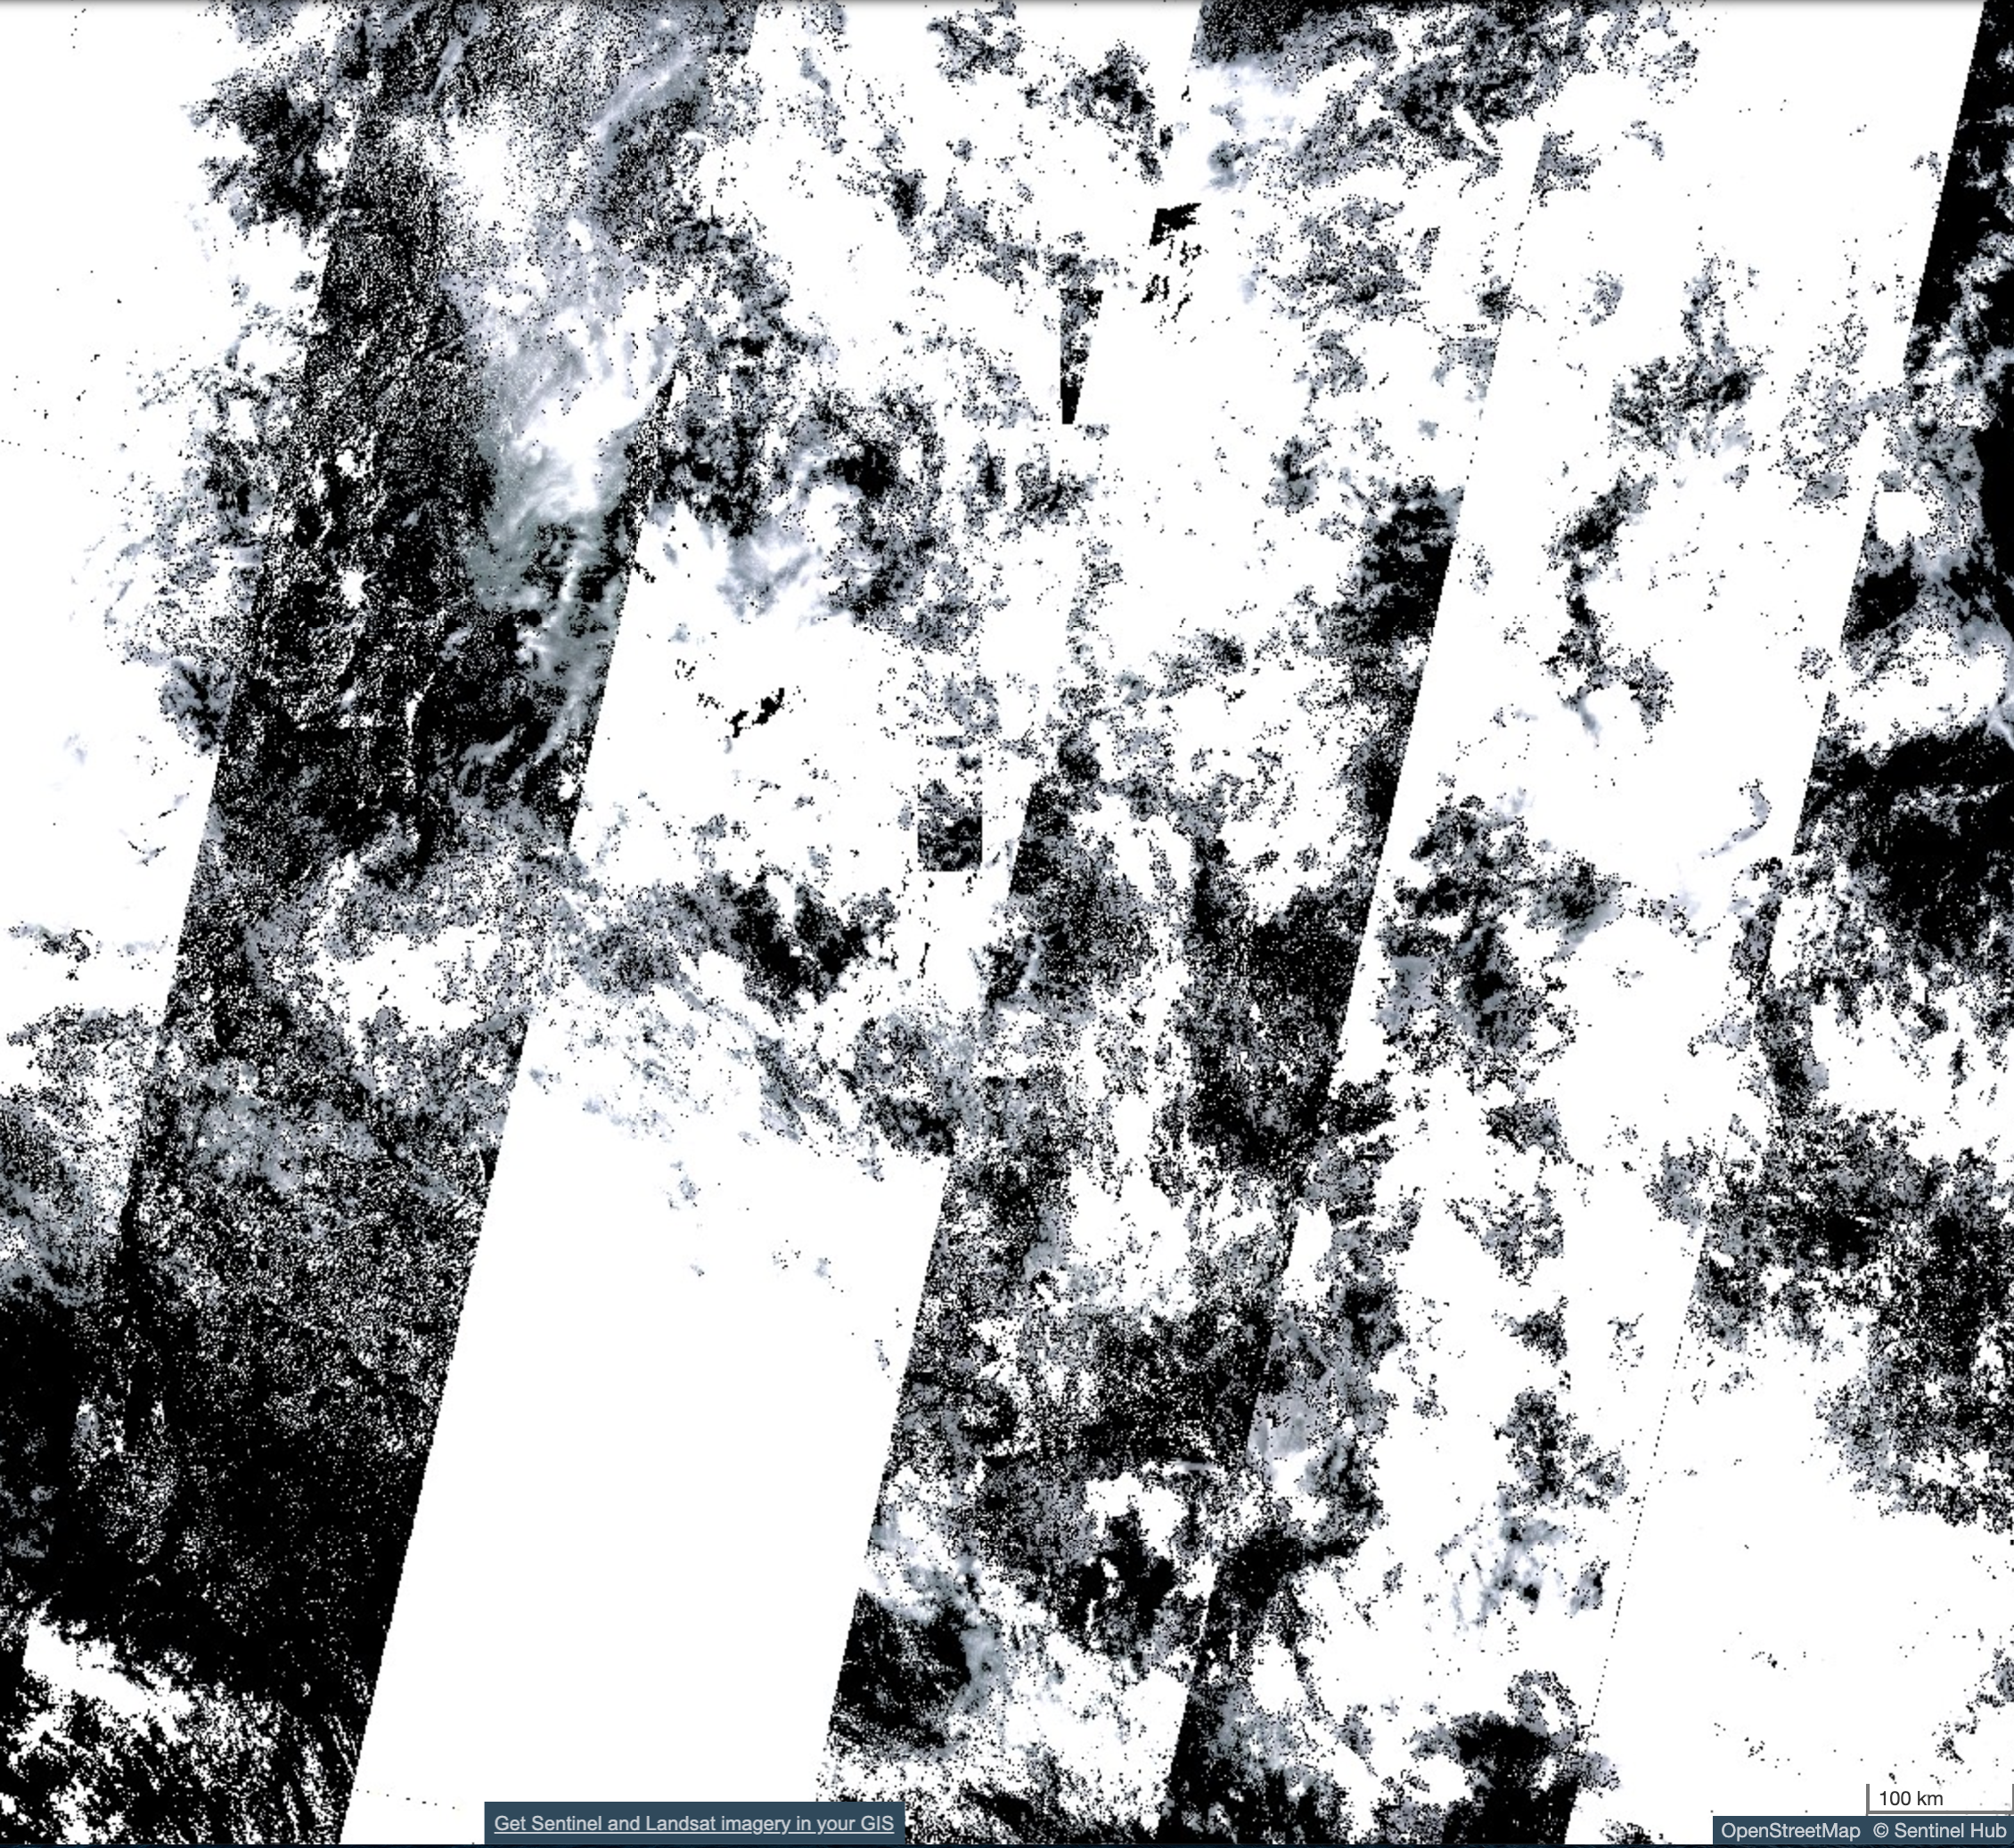
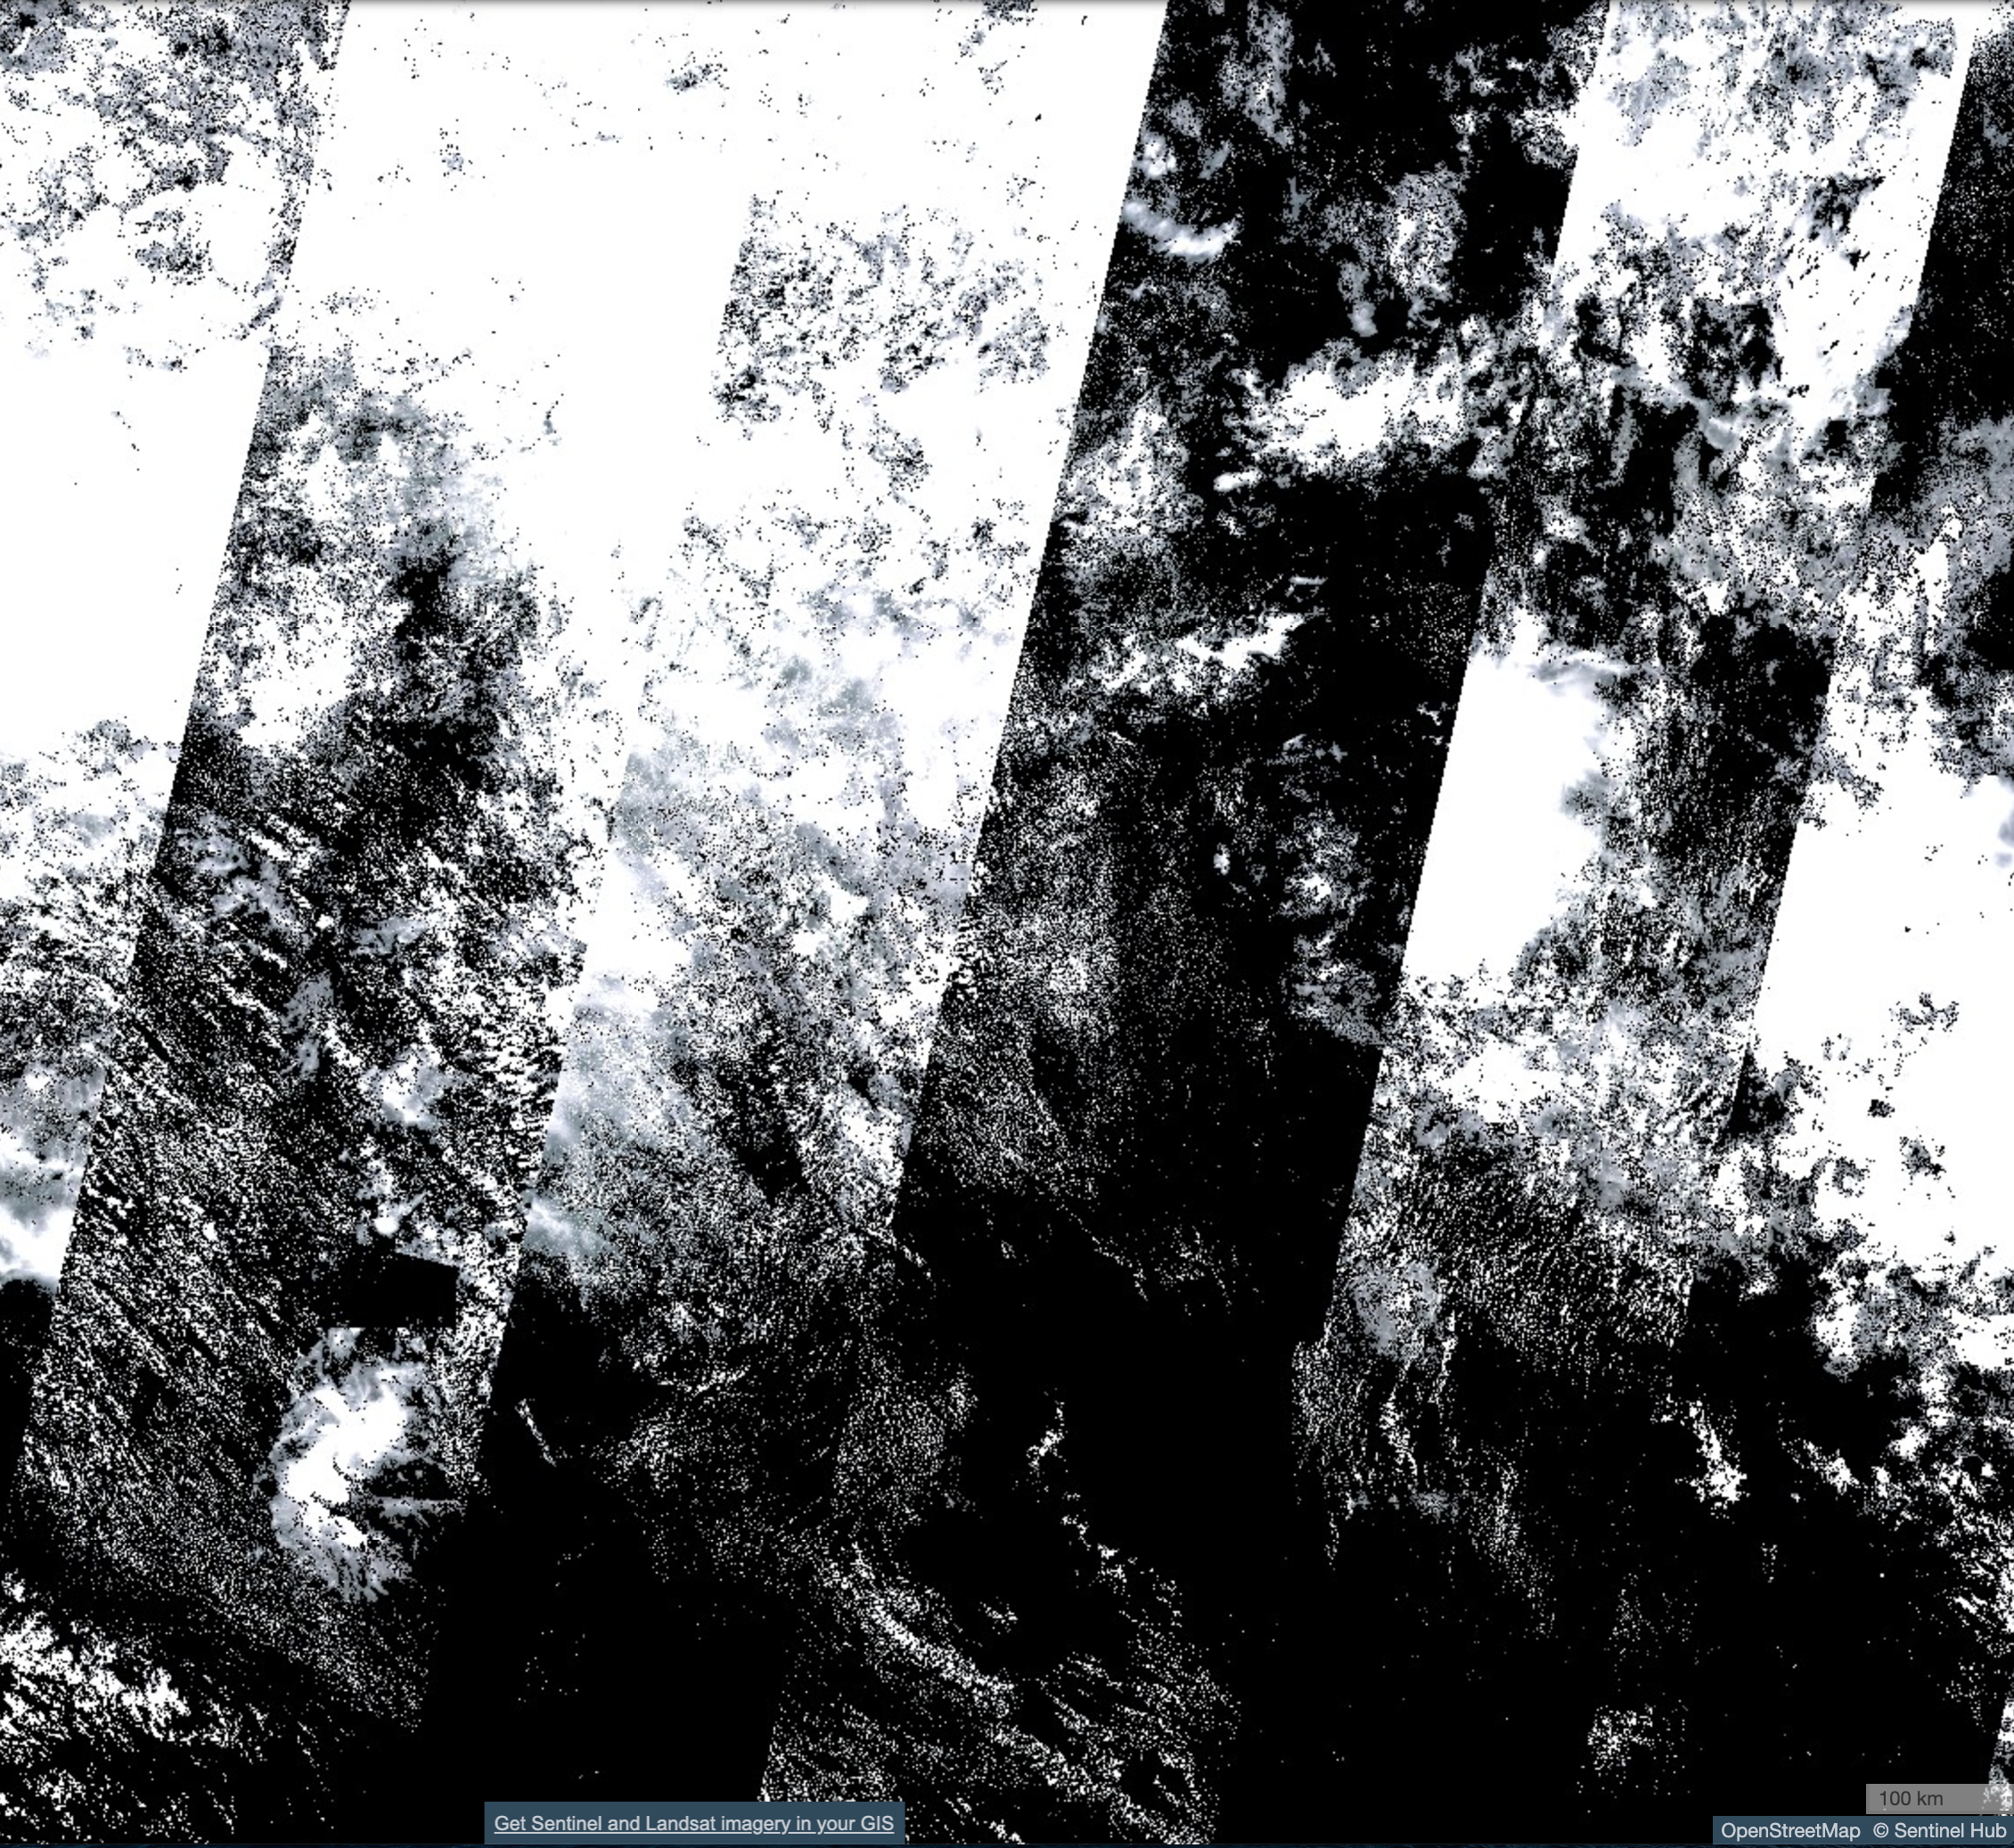
 - Cloud cover masks. Cloud cover occlude foliage, therefore during the processing steps, the cloud needs to be accounted for. Our strategy is take multiple look at the same region over a period of 4 passes or 20 days, and combine observed foliage into a single dataset.
- Cloud cover mask examples of the same area over a period of a month:
-
From S3, the data is analyzed using the following method:
- For each timestamp, the cloud cover mask is used to remove pixels from the NDVI image.
- The number of tree cover pixels (green) are counted. We know both raster datasets are at a 10 meter resolution so the area of the tree cover can be converted to relatable area (football fields)
-
AWS Lambda is used to run the solution at scale.
-
The API takes the user input for month and spatial location and saves the resulting counts to S3 output.


- Pulling data directly from ASDI, rather than using the SentinalHub. The raw data need preprocessing, including calculation of NDVI, which that was already completed in SentinalHub.
- Using Artificial Intelligence techniques, predicting pixel values instead of masking out cloud cover.
- Predicting when the deforestation is going to happen using Relation Learning. * This could be used to relocate all the people from unsustainable areas to the nearest sustainable location
- Use serverless data processing, such as large # of lambda functions to do map-reduce instead of using traditional infrastructure like EC2/EMR
- Use good serverless Big Data solutions, such as Athena, QuickSight, Glue for data processing tasks
- Use a serverless hosting solution, such as API Gateway, Lambda, Athena, S3, etc to host and distribute Sentinel tiles.
- Most of the images couldn't cover complete area because of cloud cover.
- There is a chance of NDVI value being corrupted.
- Masking RGB image using Cloud cover is naive way of solving a problem.
- Create lambda function for getting doc out of S3 with format location_month.json
- Attach lambda function to API gateway
- Create S3 bucket for the storage of documents
- Modify API payload in page.js
- Populate bucket with files
- Read files downloaded and display in the UI