Visit me at MY ESP
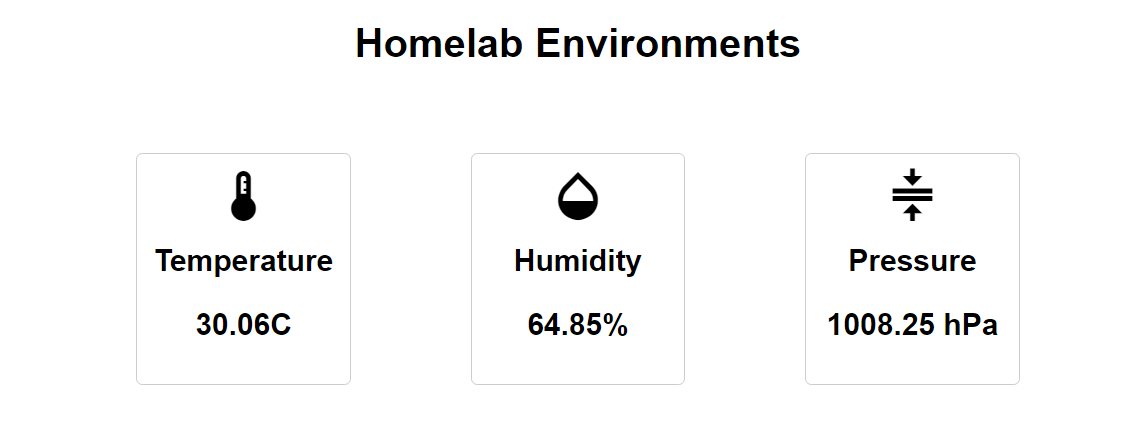
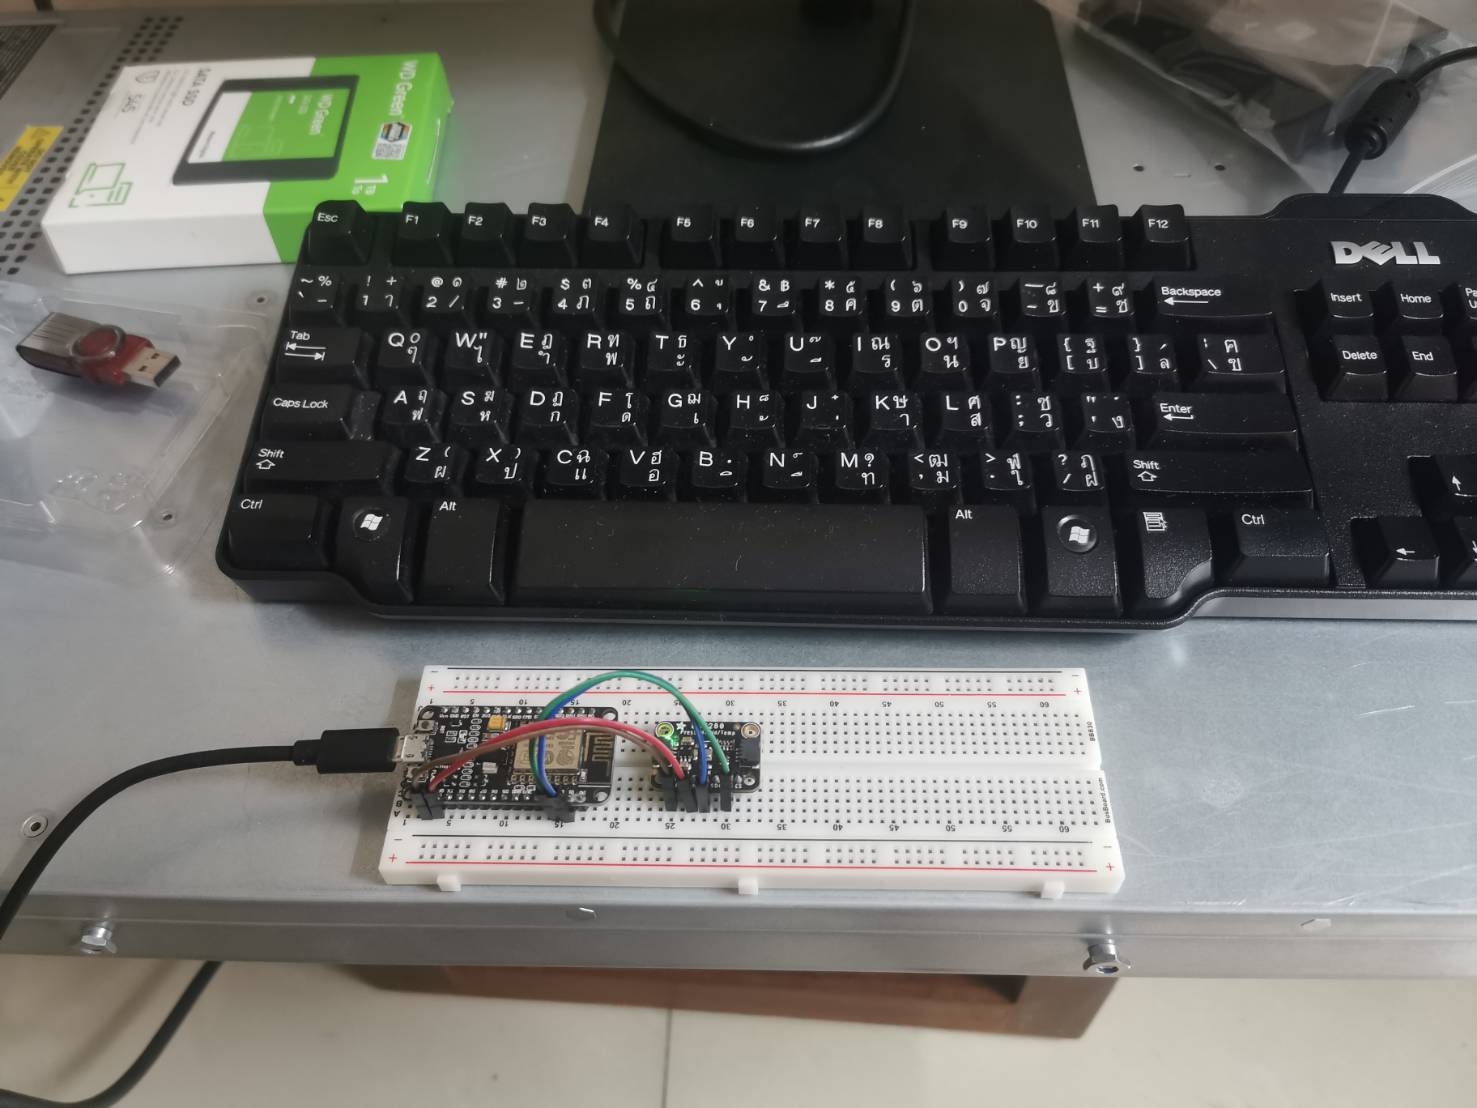
Homelab Environment Monitor is an Arduino-based project designed to provide seamless monitoring of your homelab server room environment. Using either a Generic ESP8266 or ESP32 board and an Adafruit BME280 sensor, this solution offers an efficient way to keep track of temperature, humidity, and atmospheric pressure without the need for a real-time database like Firebase. The project leverages the ESP's web server capabilities to facilitate easy access to environmental data and demonstrates the principle of SSR (Server-Side Rendering).
- Web-based user interface for convenient access to real-time sensor readings.
- Utilizes Adafruit BME280 sensor for accurate and reliable environmental measurements.
- Minimalistic setup without the requirement of a real-time database.
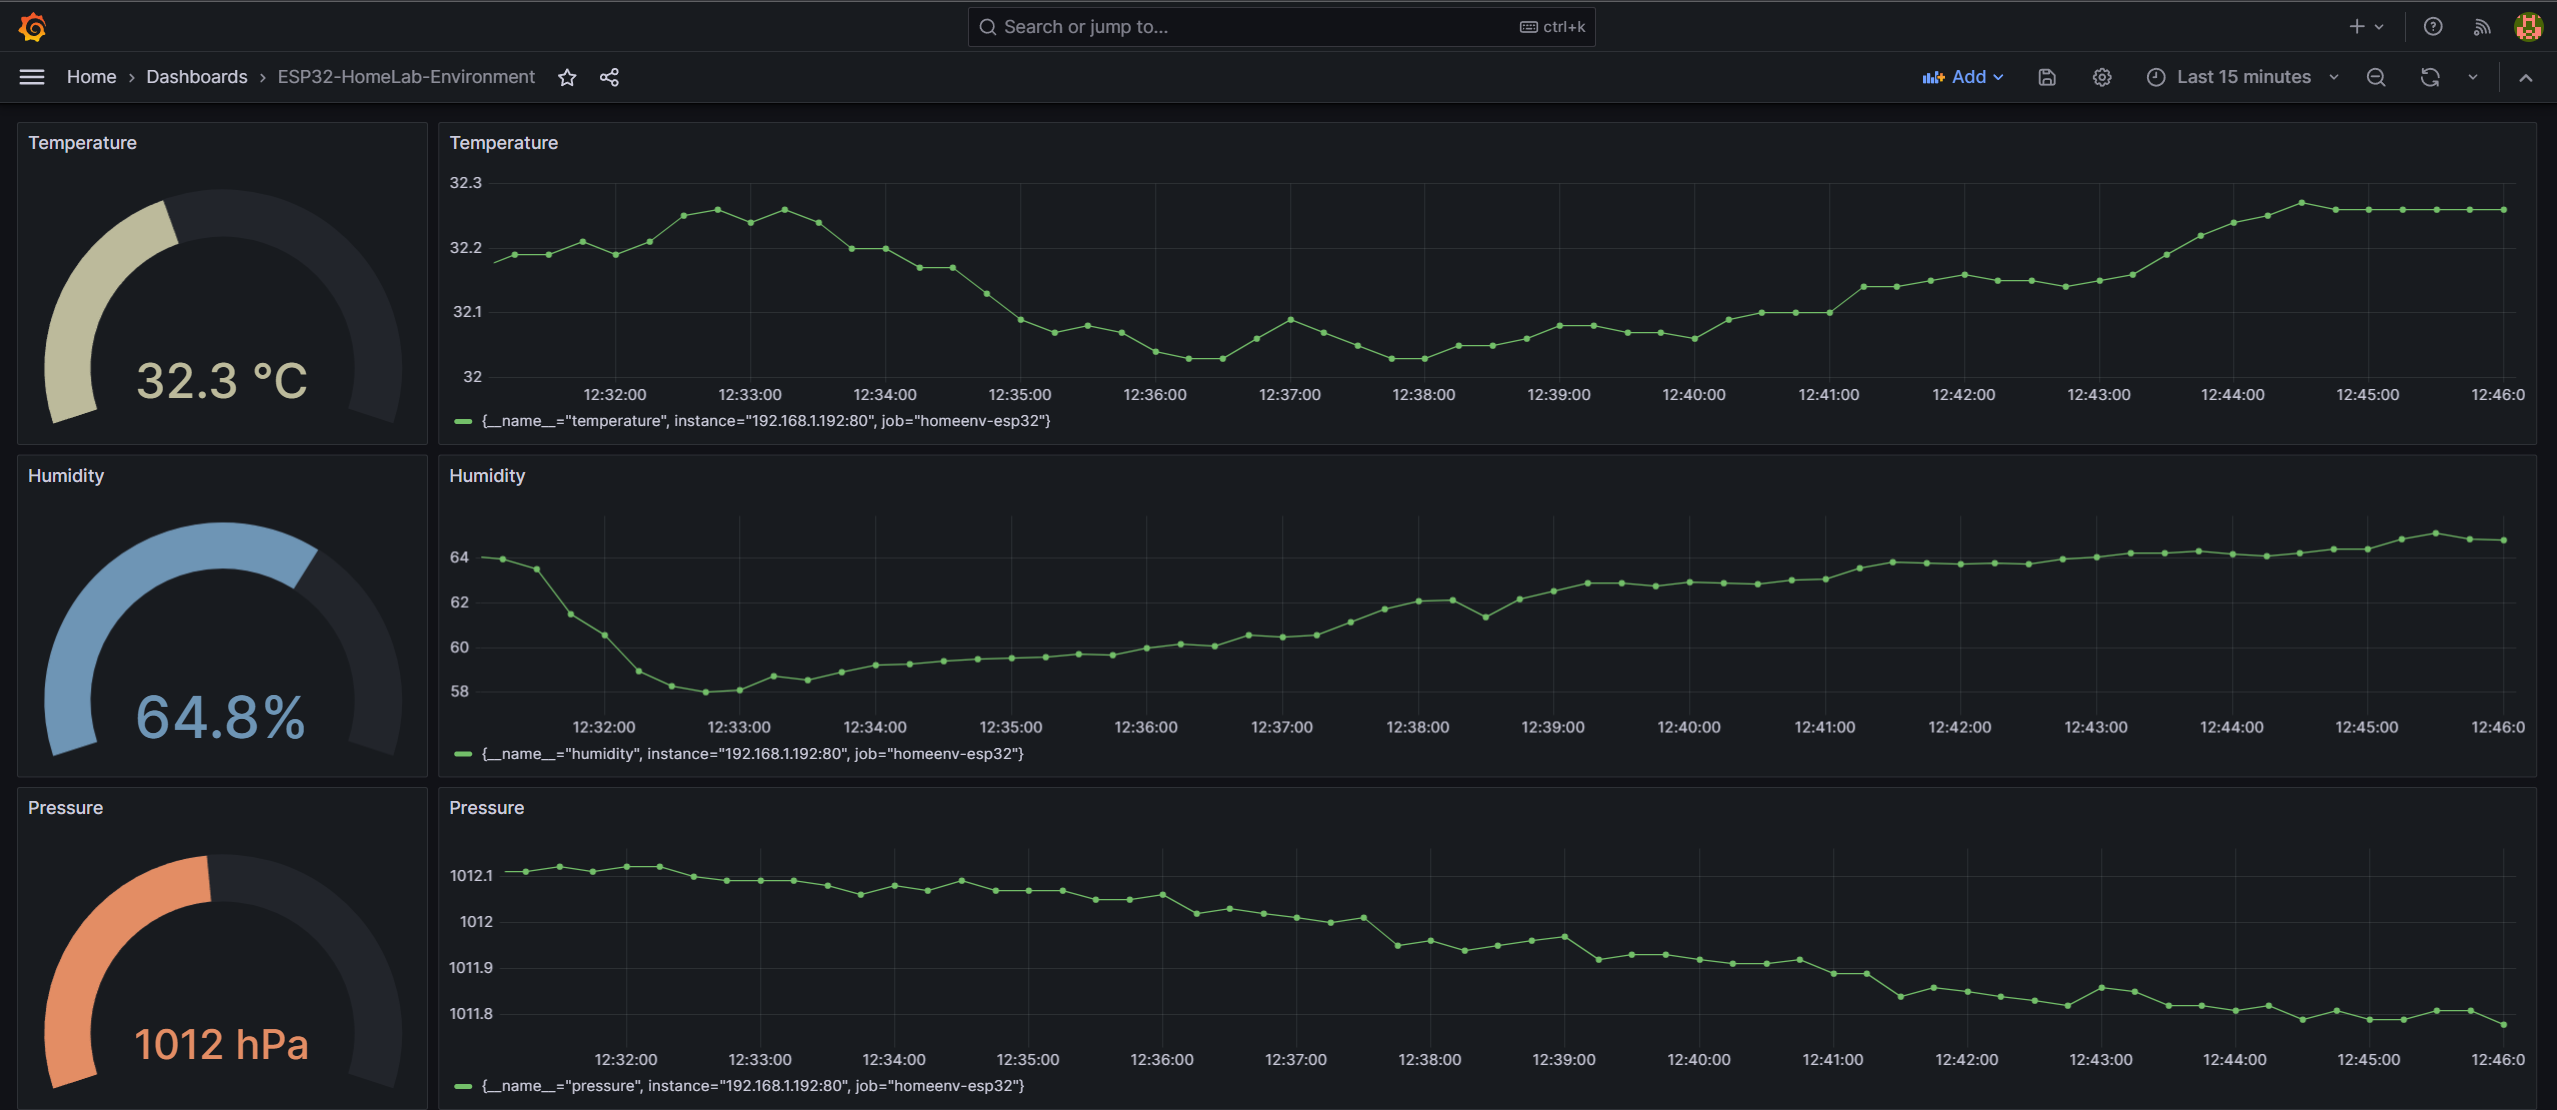
- Export Sensor data as Prometheus metrics for long-term monitoring and analysis and visualization with Grafana.
esp8266/mcu.ino: Arduino sketch containing the code for the environment monitoring system using ESP8266.esp8266/data/index.html: HTML file serving as the user interface for visualizing sensor data for ESP8266.esp32/mcu.ino: Arduino sketch containing the code for the environment monitoring system using ESP32.esp32/data/index.html: HTML file serving as the user interface for visualizing sensor data for ESP32.LICENSE: MIT License file governing the usage of this project.
To set up the Homelab Environment Monitor project, follow these precise steps:
-
Install Arduino IDE: Download and install the Arduino IDE on your computer only 1.x will work (2023/08/07).
-
Install Libraries:
- Open the Arduino IDE.
- Go to
Sketch>Include Library>Manage Libraries. - Search for and install the following libraries:
Adafruit Unified Sensorby AdafruitAdafruit BME280 Libraryby Adafruit- For ESP8266:
ESP8266WiFiby ESP8266 Community - For ESP32:
WiFiandWebServerlibraries
-
Add ESP Support:
- For ESP8266:
- In the Arduino IDE, go to
File>Preferences. - Add the following URL to the
Additional Boards Manager URLsfield:http://arduino.esp8266.com/stable/package_esp8266com_index.json - Click
OKto save the preferences. - Go to
Tools>Board>Boards Manager. - Search for
esp8266and install theesp8266board package. - Select your ESP8266 board from
Tools>Board.
- In the Arduino IDE, go to
- For ESP32:
- Follow similar steps but use the appropriate board manager URL and board package for ESP32.
- For ESP8266:
-
Install SPIFFS Plugin:
-
Visit the Arduino ESP8266 filesystem uploader plugin repository for detailed installation instructions.
-
Visit the Arduino ESP32 filesystem uploader plugin repository for detailed installation instructions.
-
-
Upload Code:
- Open the appropriate
mcu.inofile (either for ESP8266 or ESP32) in the Arduino IDE. - Replace
{YOUR_SSID}and{YOUR_PASSWORD}with your Wi-Fi credentials. - Choose your ESP board from
Tools>Board. - Select the appropriate COM port from
Tools>Port. - Upload the sketch to the ESP.
- Open the appropriate
-
Upload HTML:
- To enable the web user interface, upload the
index.htmlfile from the appropriatedatafolder to the ESP using SPIFFS. Consult the ESP documentation for step-by-step instructions.
- To enable the web user interface, upload the
-
Access the Monitor:
- After uploading, access the user-friendly web interface by opening
http://{esp_ip}in your web browser. - For programmatic access, retrieve sensor data via the API at
http://{esp_ip}/api. - For prometheus and grafana access, retrieve sensor data via the API at
http://{esp_ip}/metrics.
- After uploading, access the user-friendly web interface by opening
- Web Interface: Access the intuitive web interface by navigating to
http://{esp_ip}in your web browser. This interface presents an easy-to-read visualization of the server room environment. - API Access: Obtain sensor data programmatically by making a GET request to
http://{esp_ip}/api. - Prometheus & Grafana: Use the Prometheus and Grafana monitoring stack to visualize and analyze sensor data. This is the recommended approach for long-term monitoring of the server room environment.


