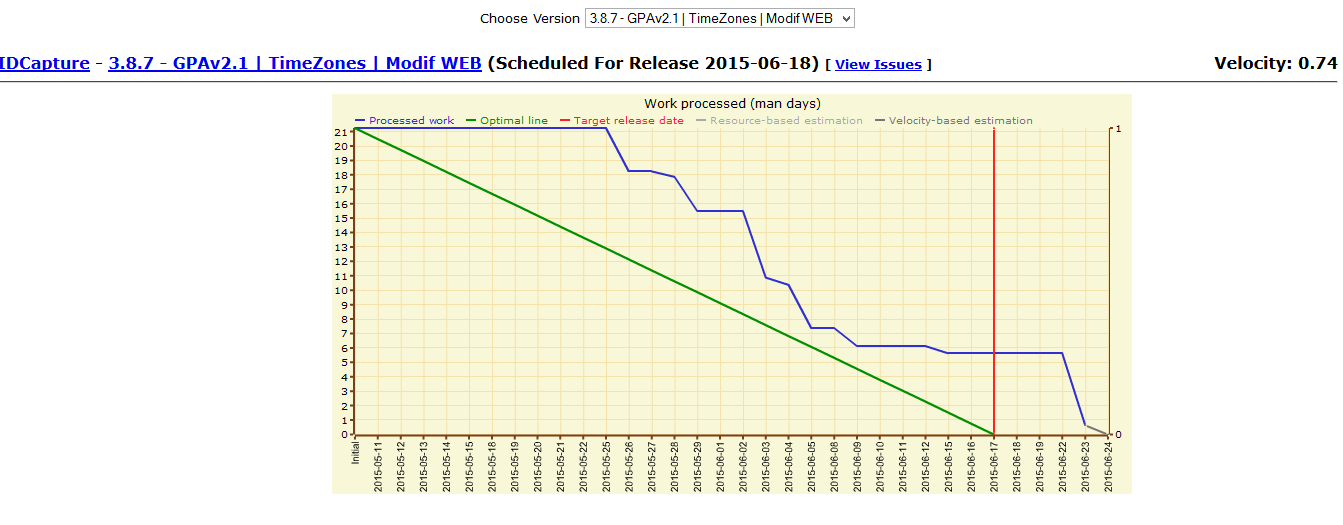
This a simple burn down chart for Mantis BT [http://www.mantisbt.org/]. It uses Open Flash Chart 2 [http://teethgrinder.co.uk/open-flash-chart-2/] for the graph display.
Ensure you have set the config "$g_roadmap_view_threshold" to something good (e.g. VIEWER).
-
Place everything in a folder named "BurnDownChart" into the plugins folder
-
Apply the patch for manage_proj_ver_edit_page.php: ~/mantis $ patch < plugins/BurnDownChart/manage_proj_ver_edit_page.php.patch
(It will add an event there to be able to add a start date)
-
Install the plugin in the admin section of MantisBT
-
Goto Manage Custom Fields and edit the plugin's fields (Initial_Estimate, Remaining_Work, Resolution_Date, ...)
- For each of these fields, link the projects to the field
- DO NOT rename the field, it won't work otherwise.
-
Edit the project you like and add a version which will be your sprint.
- Date order is the target end date for this sprint
- Start date is the start date of the sprint
- Allocated resources is the number of developers working on this sprint, i.e. the estimated velocity
-
For each task to add to the sprint, set the target version, the "estimated work" and keep the "remaining" & "spent" fields updated during the sprint.
- 0.4 development end date and more infos on chart (theoric velocity, sprint date)
- 0.3 date released and time spent
- 0.2 added estimated lines and customisable field names
- 0.1 not fully tested and just an alpha version.
GPL v3: http://www.gnu.org/licenses/gpl.html
MantisBT & Open Flash Chart developers and Svetoslav Denev, the original developer of this plugin
