National flags for Matplotlib.
There is no good documentation available yet. Hopefully, this blog post will help you get started.
https://leejjoon.github.io/jjl-mpl-blog/posts/mpl-20240318-mpl-flags/
mpl-flags contains the flag data in vector format readily usable with
Matplotlib. The original flags data are in svg format, and are converted to
matplotlib's Path data using mpl-simple-svg-parser. mpl-flags does not
contain the original svg files, only the converted data in numpy format
(vertices and codes).
The flag data is collected from various sources. Currently, it includes flags from
- Google's noto color emoji font : https://github.com/googlefonts/noto-emoji
- circle-flags : https://github.com/HatScripts/circle-flags
- flag-icons : https://github.com/lipis/flag-icons
Different sources can render the flags differently.
Some flags includes gradient, which is currently not supported by mpl-flags,
so they will result in incorrect details.
- noto: ['BZ', 'EC', 'FK', 'GS', 'GT', 'MX', 'NI', 'PM', 'TA', 'VG']
- 4x3, 1x1 : ['BZ', 'FK', 'GS', 'GT', 'MX', 'NI', 'VG']
Check the above post for the impact of no gradient in these flags.
The gradient support is work in progress.
from mpl_flags import Flags
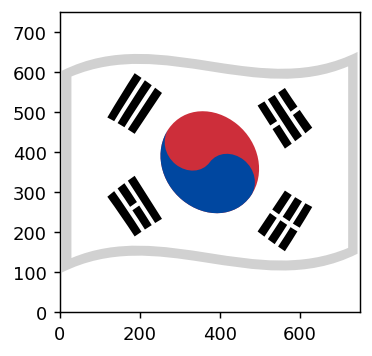
flags = Flags("noto_waved") # You initialize the Flags class specifying what kind of
# flags you like to use.
# `noto_waved` is flags from google's noto emoji fonts.
fig, ax = plt.subplots(figsize=(3, 3))
flags.show_flag(ax, "KR")from matplotlib.offsetbox import AnnotationBbox
flags = Flags("noto_original")
fig, ax = plt.subplots(figsize=(3, 3))
da = flags.get_drawing_area("KR", wmax=100)
ab = AnnotationBbox(da, (0.5, 0.5), frameon=True,
box_alignment=(0.5, 0.5))
ax.add_artist(ab)You can install using pip:
pip install mpl_flagspip install -e ".[dev]"