lowcharts
Tool to draw low-resolution graphs in terminal.
lowcharts is meant to be used in those scenarios where we have numerical data in text files that we want to display in the terminal to do a basic analysis.
An example would be the logs of a service (webserver, database, proxy, container orchestration, etc.) where times (or sizes) of requests are logged. In an ideal world you would have those logs accessible via a kibana (or similar) or those metrics exposed to a prometheus (or similar) and graphed in a grafana dashboard (or similar). But sometimes we need to cope with non ideal worlds, and troubleshoot a service with nothing more of what we can muster in a shell terminal.
Usage
Type lowcharts --help, or lowcharts PLOT-TYPE --help for a complete list of
options.
Currently three basic types of plots are supported:
Bar chart for matches in the input
Since grep -c does not aggregate counts per pattern, this is maybe my most frequent use case.
This chart is generated using lowcharts matches database.log SELECT UPDATE DELETE INSERT DROP:
Histogram
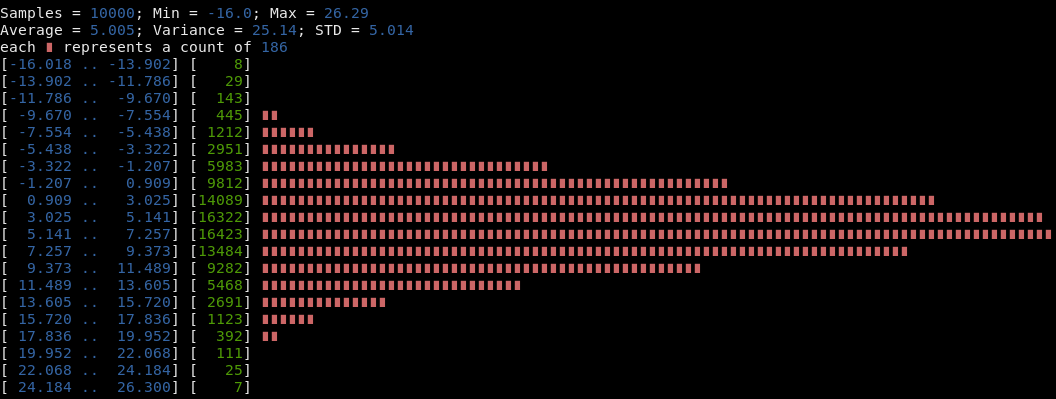
This chart is generated using python3 -c 'import random; [print(random.normalvariate(5, 5)) for _ in range(100000)]' | lowcharts hist:
This was inspired by data-hacks. However, for some big log files I found that project was slower of what I would like, and I found that a rust-compiled binary was better suited to my needs.
Options for specifying ranges, chart sizes and input files are supported:
lowcharts hist --max 0.5 --intervals 10 --width 50 data.txt
Samples = 50090; Min = 0.000; Max = 0.499
Average = 0.181; Variance = 0.023; STD = 0.154
each ∎ represents a count of 484
[0.000 .. 0.050] [14545] ∎∎∎∎∎∎∎∎∎∎∎∎∎∎∎∎∎∎∎∎∎∎∎∎∎∎∎∎∎∎
[0.050 .. 0.100] [ 6111] ∎∎∎∎∎∎∎∎∎∎∎∎
[0.100 .. 0.150] [ 4911] ∎∎∎∎∎∎∎∎∎∎
[0.150 .. 0.200] [ 4003] ∎∎∎∎∎∎∎∎
[0.200 .. 0.250] [ 3745] ∎∎∎∎∎∎∎
[0.250 .. 0.300] [ 3526] ∎∎∎∎∎∎∎
[0.300 .. 0.350] [ 3424] ∎∎∎∎∎∎∎
[0.350 .. 0.400] [ 3332] ∎∎∎∎∎∎
[0.400 .. 0.450] [ 3215] ∎∎∎∎∎∎
[0.450 .. 0.500] [ 3278] ∎∎∎∎∎∎
Above examples assume input files with a number per line. Options for figuring
out where to look in the input file for values are supported by regex option.
This example logs the time spent by nginx for all of 200K http responses ()
$ cat nginx*.log | lowcharts hist --regex ' 200 \d+ ([0-9.]+)' --intervals 10
Samples = 25080; Min = 0.004; Max = 0.049
Average = 0.008; Variance = 0.000; STD = 0.006
each ∎ represents a count of 228
[0.004 .. 0.009] [20569] ∎∎∎∎∎∎∎∎∎∎∎∎∎∎∎∎∎∎∎∎∎∎∎∎∎∎∎∎∎∎∎∎∎∎∎∎∎∎∎∎∎∎∎∎∎∎∎∎∎∎∎∎∎∎∎∎∎∎∎∎∎∎∎∎∎∎∎∎∎∎∎∎∎∎∎∎∎∎∎∎∎∎∎∎∎∎∎∎∎∎
[0.009 .. 0.013] [ 1329] ∎∎∎∎∎
[0.013 .. 0.018] [  807] ∎∎∎
[0.018 .. 0.022] [ 1412] ∎∎∎∎∎∎
[0.022 .. 0.027] [  363] ∎
[0.027 .. 0.031] [   27]
[0.031 .. 0.036] [  128]
[0.036 .. 0.040] [   22]
[0.040 .. 0.044] [  240] ∎
[0.044 .. 0.049] [  183]
X-Y Plot
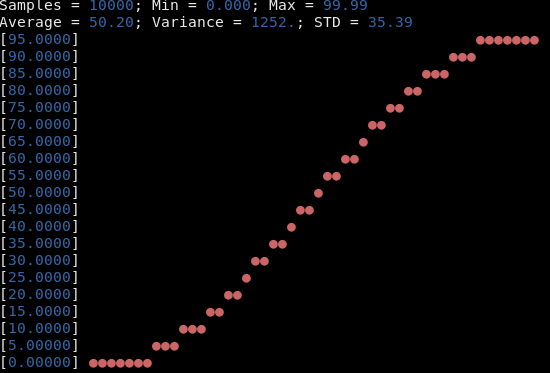
This chart is generated using cat ram-usage | lowcharts plot --height 20 --width 50:
Note that x axis is not labelled. The tool splits the input data by chunks of a fixed size and then the chart display the averages of those chunks. In other words: grouping data by time is not (yet?) supported; you can see the evolution of a metric over time, but not the speed of that evolution.
There is regex support for this type of plots.
Building
$ git clone https://github.com/juan-leon/lowcharts
$ cd lowcharts
$ cargo install --path .
Contributing
Feedback, ideas and pull requests are welcomed.


