In this project, I aimed to cover a set of preliminary skills required by a data engineer. As a data analyst planning to transition into this field, this project has helped me become acquainted with various concepts, techniques, and technologies. As a result, I have decided to share my experiences.
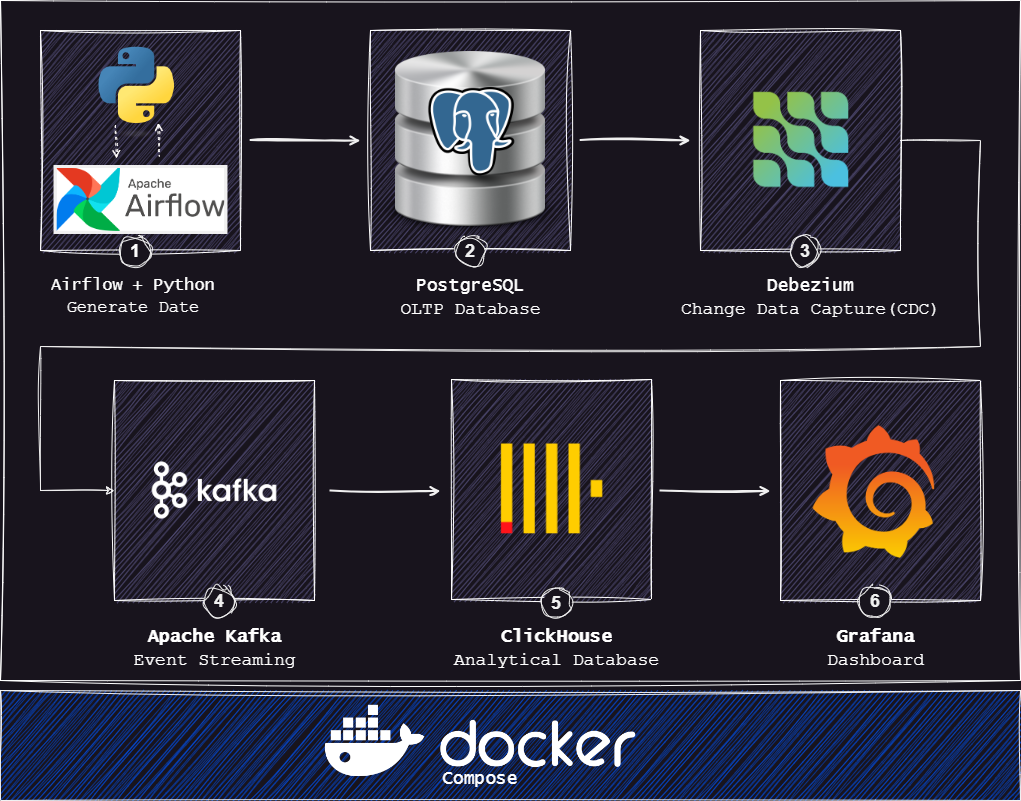
This project encompasses the design and implementation of a data pipeline tailored for an online store environment. The primary objective is to analyze the data generated by the store's operations in real-time and present meaningful insights through a dashboard interface. To achieve this goal, several key technologies have been employed, each serving a specific purpose in the data processing and visualization workflow.
1- Python:
In this project, Python served as the primary programming language. Python is widely used in data engineering projects due to its versatility, extensive libraries, and ease of use. To simulate ecommerce data and populate the database, I utilized the Faker library. Faker is a Python library that generates fake data, such as names, addresses, and product information, which is useful for testing and development purposes. Additionally, I employed the geopy.geocoders module, specifically the Nominatim class, to generate coordinates for each city where user orders were registered. This allowed for the geocoding of location data, enabling geographic analysis and visualization within the project. You can access the code I used to generate fake data in "code/ecommerce/models".
2- Apache Airflow:
Apache Airflow played a crucial role in this project by enabling the creation of Directed Acyclic Graphs (DAGs) and facilitating scheduling for data simulation tasks. As an open-source platform, Apache Airflow excels in orchestrating complex workflows and data pipelines. By defining DAGs, which encapsulate the sequence of tasks and their dependencies, I could automate the process of simulating data and executing tasks reliably and at scale. Leveraging Airflow's scheduling capabilities, I ensured efficient management of data processing tasks, ensuring timely execution and handling of dependencies between different components of the pipeline. The DAGs used in this project are available at "pipeline/dags".
3- PostgreSQL:
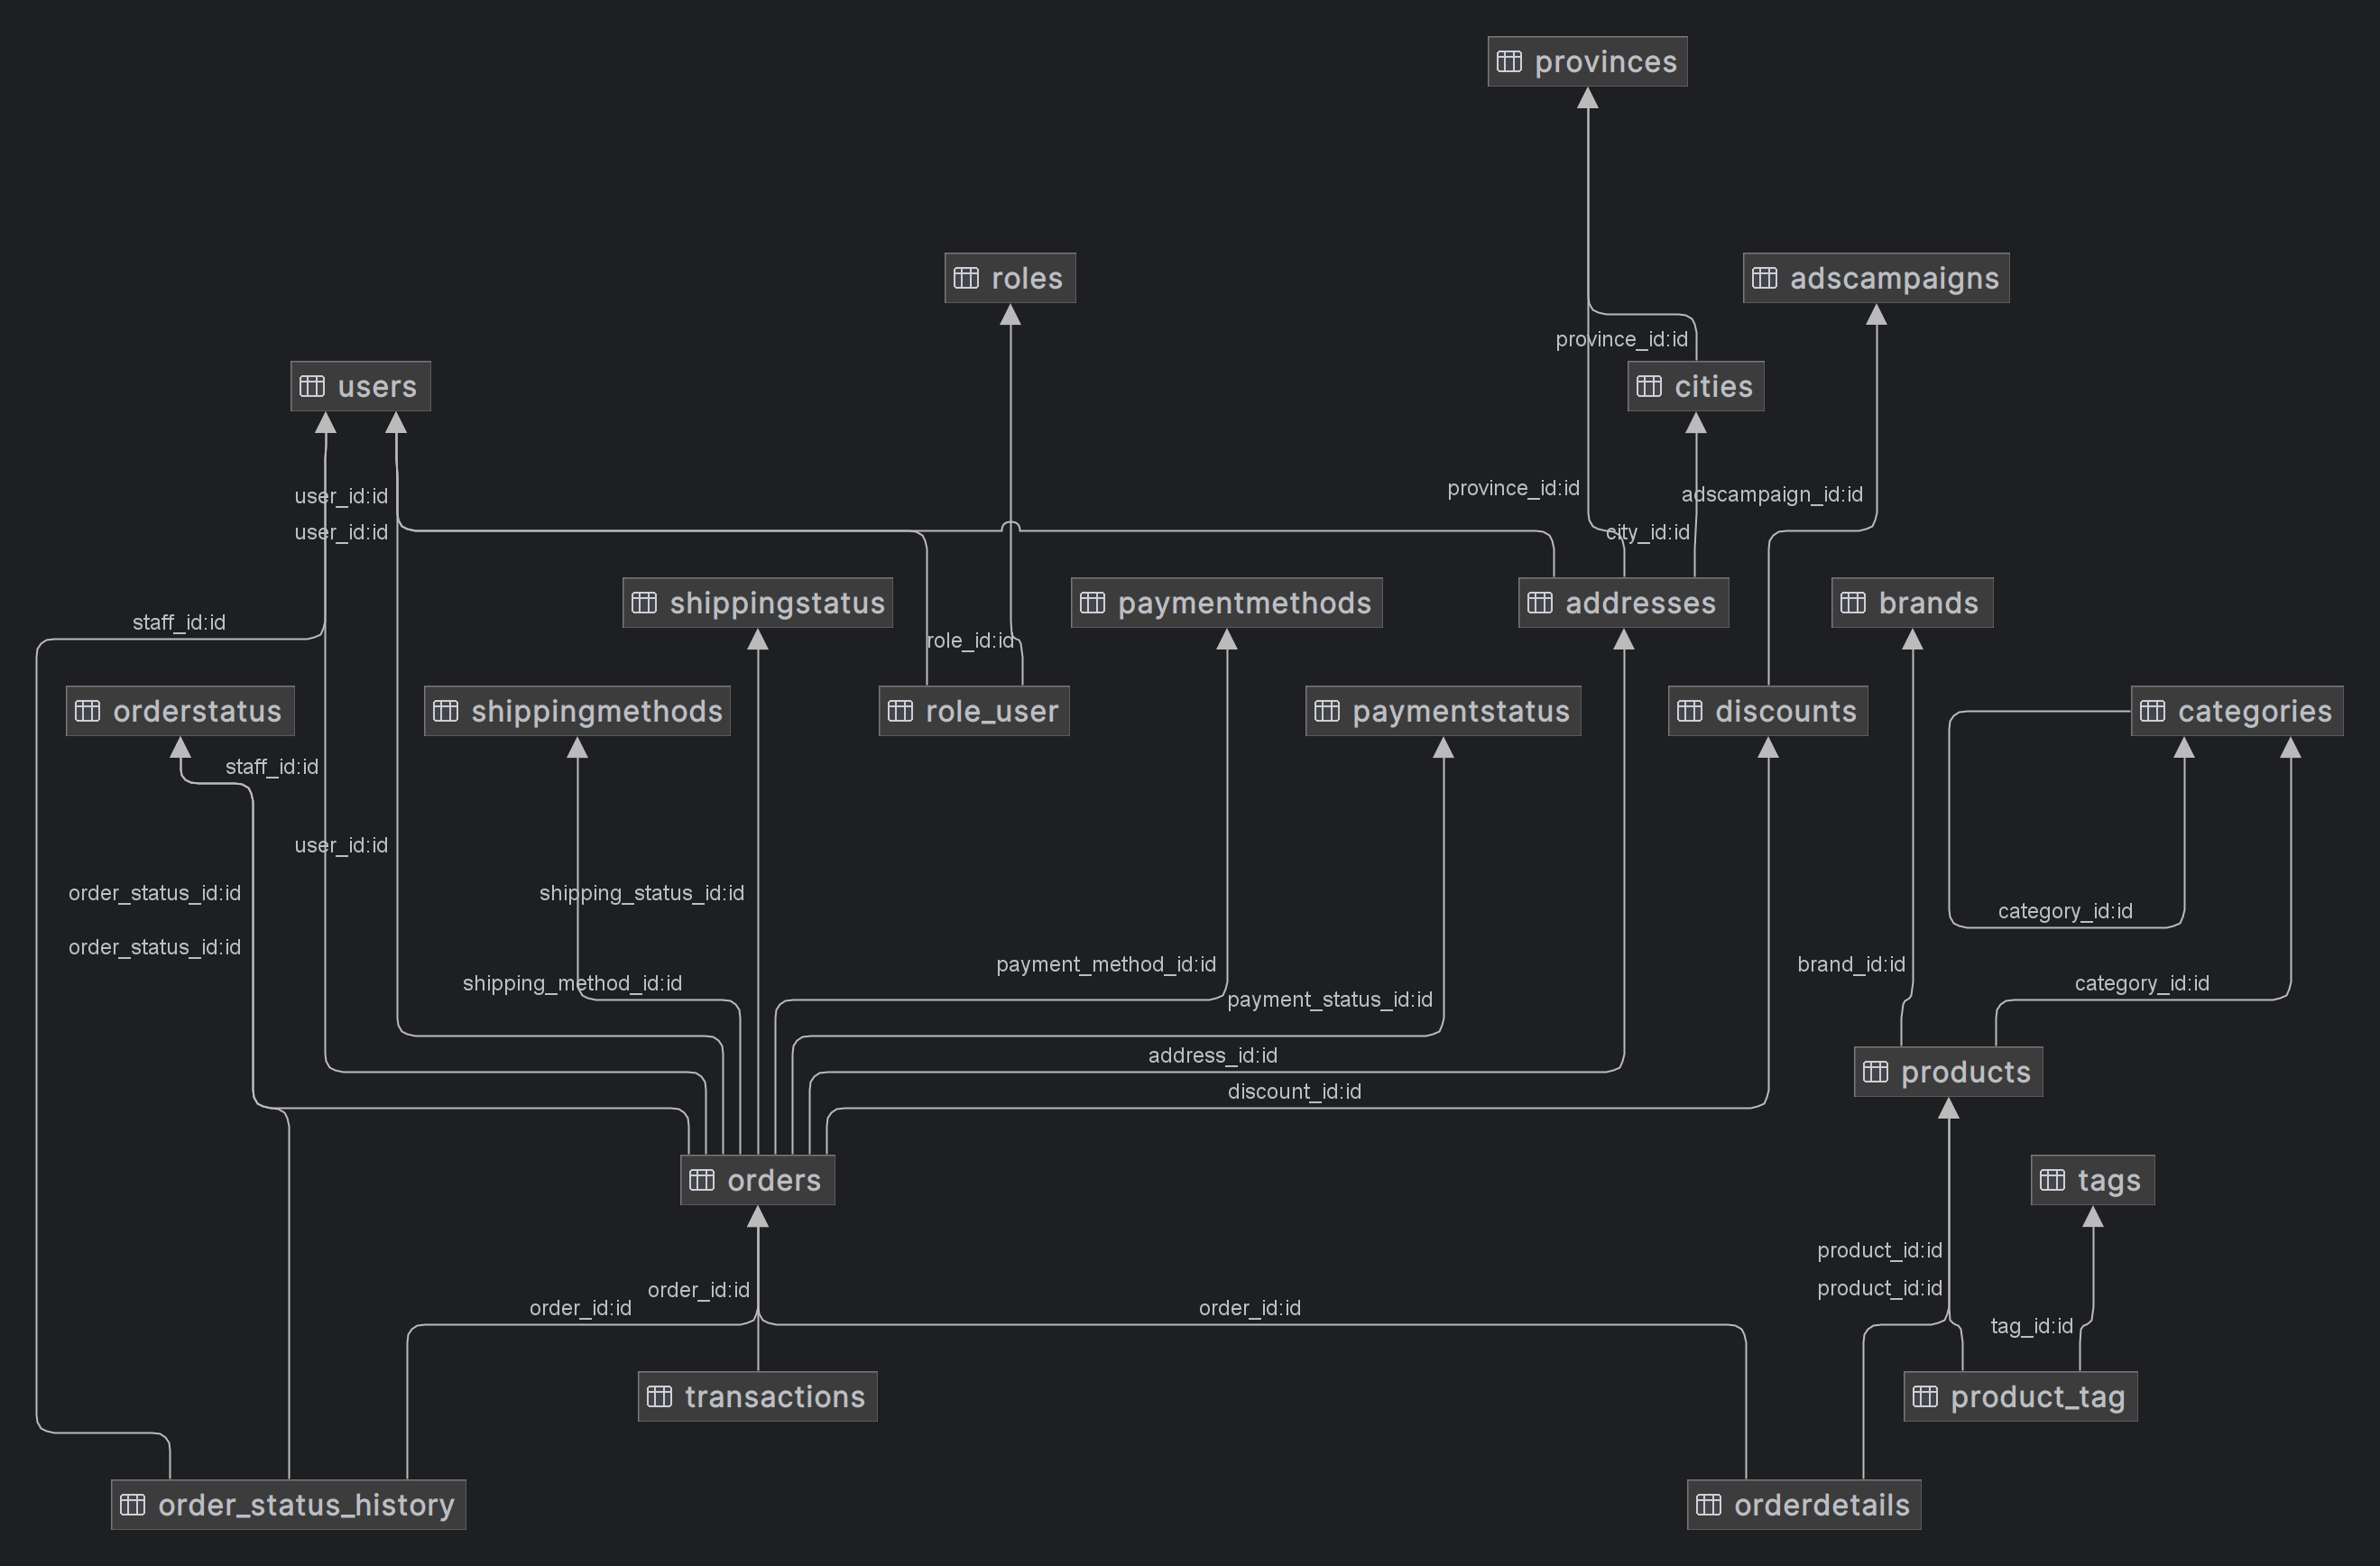
PostgreSQL served as the Online Transaction Processing (OLTP) database for this project, tasked with storing transactional data. To begin, I meticulously crafted a database schema, which was then implemented within PostgreSQL. Connectivity to PostgreSQL was established using the psycopg2 library, a robust PostgreSQL adapter for Python. An accompanying entity relationship diagram (ERD) is provided below, offering a visual representation of the database schema. Furthermore, the SQL script utilized for creating the database tables can be accessed in "database/postgres_tables.sql".
4- Debezium and Apache Kafka:
Debezium, utilized as a Kafka source connector in this project, plays a pivotal role in enabling Change Data Capture (CDC) from PostgreSQL to Apache Kafka. Acting as a conduit for real-time streaming, Debezium captures database changes in PostgreSQL and efficiently transfers them to Kafka topics. This seamless integration ensures that Kafka consumers have access to the most up-to-date information for further processing and analysis within the data pipeline. By leveraging Kafka's distributed architecture, the combined functionality of Debezium and Kafka facilitates scalable and fault-tolerant streaming of data, empowering the project with robust real-time capabilities. The Debezium connector configurations are available as a JSON file at "docker/debezium/init-scripts/postgres-connector.json".
Role of Kafka in the Project: In this project, Kafka serves as a central data hub, facilitating the seamless transfer of real-time data between different components of the data pipeline. ClickHouse connects to Kafka and retrieves data from Kafka topics, enabling efficient data processing and analysis. Kafka's distributed architecture ensures reliable and scalable data streaming, making it an essential component for building real-time data pipelines in the project.
5- ClickHouse:
In this project, ClickHouse serves as the analytical database, seamlessly connected to Kafka through the Kafka engine. Leveraging ClickHouse's robust capabilities, I utilized various features to enhance data processing and analysis. Specifically, I employed the MergeTree family table engine, which includes versatile table types such as MergeTree, SummingMergeTree, and AggregatingMergeTree. The MergeTree engine is well-suited for time-series data and offers efficient storage and querying capabilities, making it ideal for handling large volumes of streaming data. Additionally, the SummingMergeTree and AggregatingMergeTree table engines provide aggregation capabilities, allowing for the computation of summary statistics and aggregates on the fly.
Furthermore, ClickHouse's Materialized Views feature played a critical role in the project, effectively acting as triggers for real-time data updates. Materialized views in ClickHouse allow for the precomputation and storage of query results, ensuring fast access to frequently accessed data. By defining materialized views on the Kafka table engine, I could efficiently process incoming data and update downstream tables in real-time, facilitating timely insights and analysis within the data pipeline.
Additionally, materialized views in ClickHouse offer flexibility in defining refresh intervals, ensuring that data remains up-to-date and accurate for analytical purposes. Moreover, I leveraged ClickHouse's Kafka engine integration to seamlessly ingest data from Kafka topics into ClickHouse tables. To continuously read data from Kafka topics, I utilized ClickHouse's "materialized view" functionality, ensuring real-time updates and insights into the data pipeline.
The tables used for analytical purposes in the project start with _at_ (at: analytical table). Similarly, the Materialized Views used to populate these tables start with _mv_at_. Furthermore, I implemented Time to Live (TTL) settings for some tables to automatically delete summarized data after a specified time, ensuring the freshness of data stored in the analytical tables.
6- Grafana Dashboard:
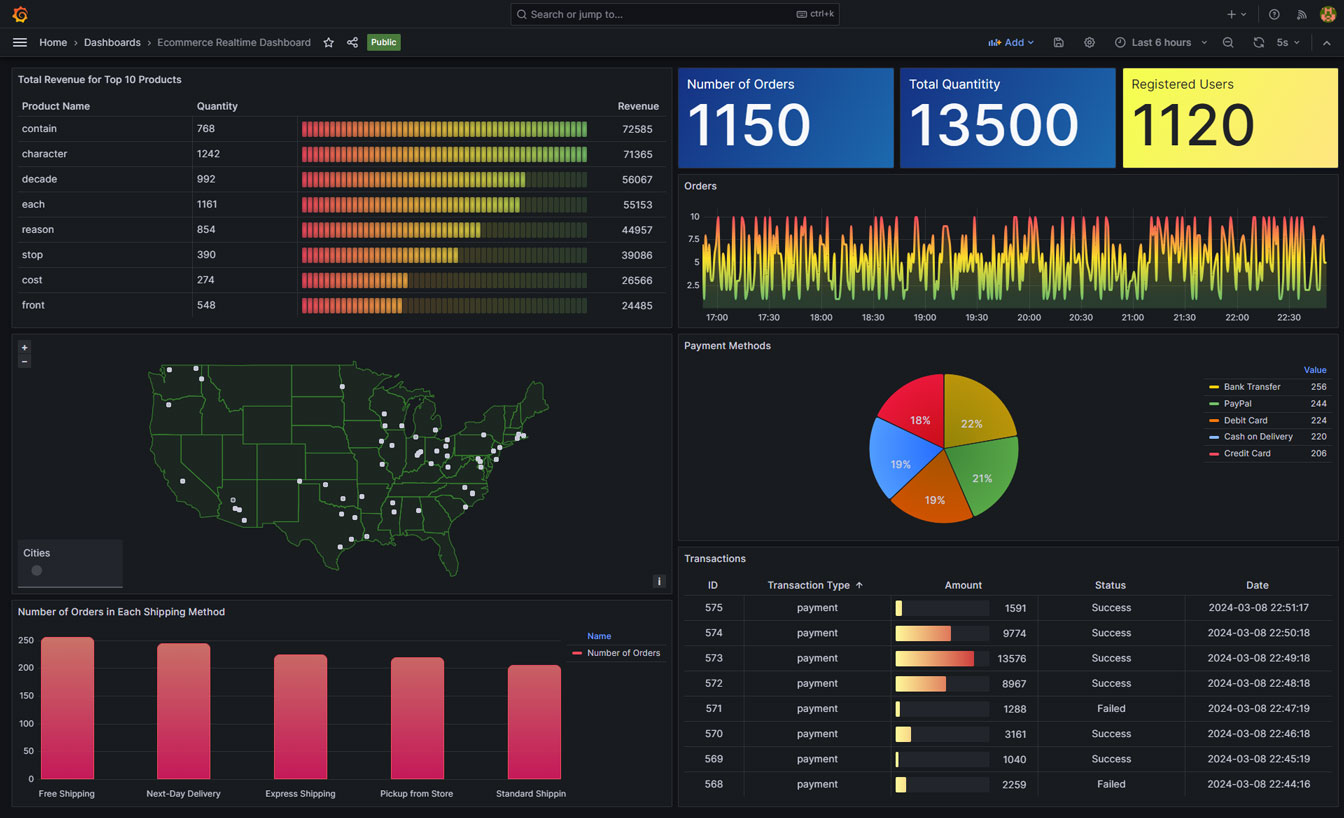
Grafana is utilized in this project primarily for real-time visualization of data. It connects to ClickHouse via the "grafana-clickhouse-datasource" plugin. While the primary focus of this project is not on visualization, Grafana serves to demonstrate the capabilities of ClickHouse and the features employed for analytical purposes.
Note: Upon running the project, you may notice that certain parts of the dashboard do not display information initially. Only the "Registered Users" panel will contain data. This is due to the fact that order and transaction information is generated gradually, with data from 10 users initially stored in the database. You can adjust this behavior by modifying the code in "code/ecommerce/models/role_user.py".
7- Docker (docker-compose):
I utilized docker-compose to streamline the deployment and interconnection of various services essential for the project's functionality. The configuration defines a comprehensive suite of 13 services, encompassing "airflow," "kafka-broker," "zookeeper," "clickhouse," "debezium," "grafana," and others. Notably, the "airflow" service orchestrates workflow management, while "kafka-broker" and "zookeeper" handle Kafka messaging infrastructure. The "clickhouse" service functions as the analytical database, with "debezium" enabling Change Data Capture (CDC) from PostgreSQL to Kafka. Grafana is deployed for monitoring and visualization purposes. Each service is meticulously configured with relevant environment variables, port assignments, health checks, and dependencies, ensuring seamless integration within the stack. Furthermore, volumes are employed to persist data for services such as Kafka, ClickHouse, Grafana, and PostgreSQL. A dedicated network ("services") facilitates efficient communication among the deployed services. This docker-compose configuration optimizes the management of the project's tech stack, fostering streamlined development, deployment, and operation processes.
- Ensure you have Docker and docker-compose installed on your system. If not, please follow the official Docker installation guide for your operating system.
-
Open your terminal.
-
Clone the project repository from GitHub to your local machine using the following command:
git clone https://github.com/behnamyazdan/ecommerce_realtime_data_pipeline.git
-
Use the command line to navigate to the root directory of the project:
cd ecommerce_realtime_data_pipeline
-
Execute the following command to start all services defined in the docker-compose file:
docker-compose upThis command will build and start the Docker containers for various services in your project.
- During the startup process, monitor the console output to ensure all services are initialized successfully.
- Pay attention to the initialization tasks performed by the
airflow-initanddebezium-connector-initcontainers.- The
airflow-initcontainer initializes Airflow and performs necessary setup tasks. After completing its initialization, this container will stop automatically. - The
debezium-connector-initcontainer creates a connector for Debezium, facilitating Change Data Capture (CDC) from PostgreSQL to Kafka. After creating the connector, this container will also stop automatically.
- The
- Once all initialization tasks are complete, ensure that other services continue to run without any errors or warnings.
These adjustments reflect the specific tasks performed by the airflow-init and debezium-connector-init containers during service initialization, providing clarity on their roles in the project setup process. If you have any further questions or need additional assistance, feel free to ask!
- Open a web browser and navigate to the following URLs to access various project services:
- Airflow UI:
http://localhost:13005username:airflow, password:airflow - Debezium UI:
http://localhost:8085(authentication not required) - Kafka UI:
http://localhost:8095/(authentication not required) - Grafana Dashboard:
http://localhost:13000username:admin, password:admin - PostgreSQL: port:
65432, username:postgres, password:postgres - ClickHouse: port:
8123, username:default, password: (not required)
- Airflow UI:


