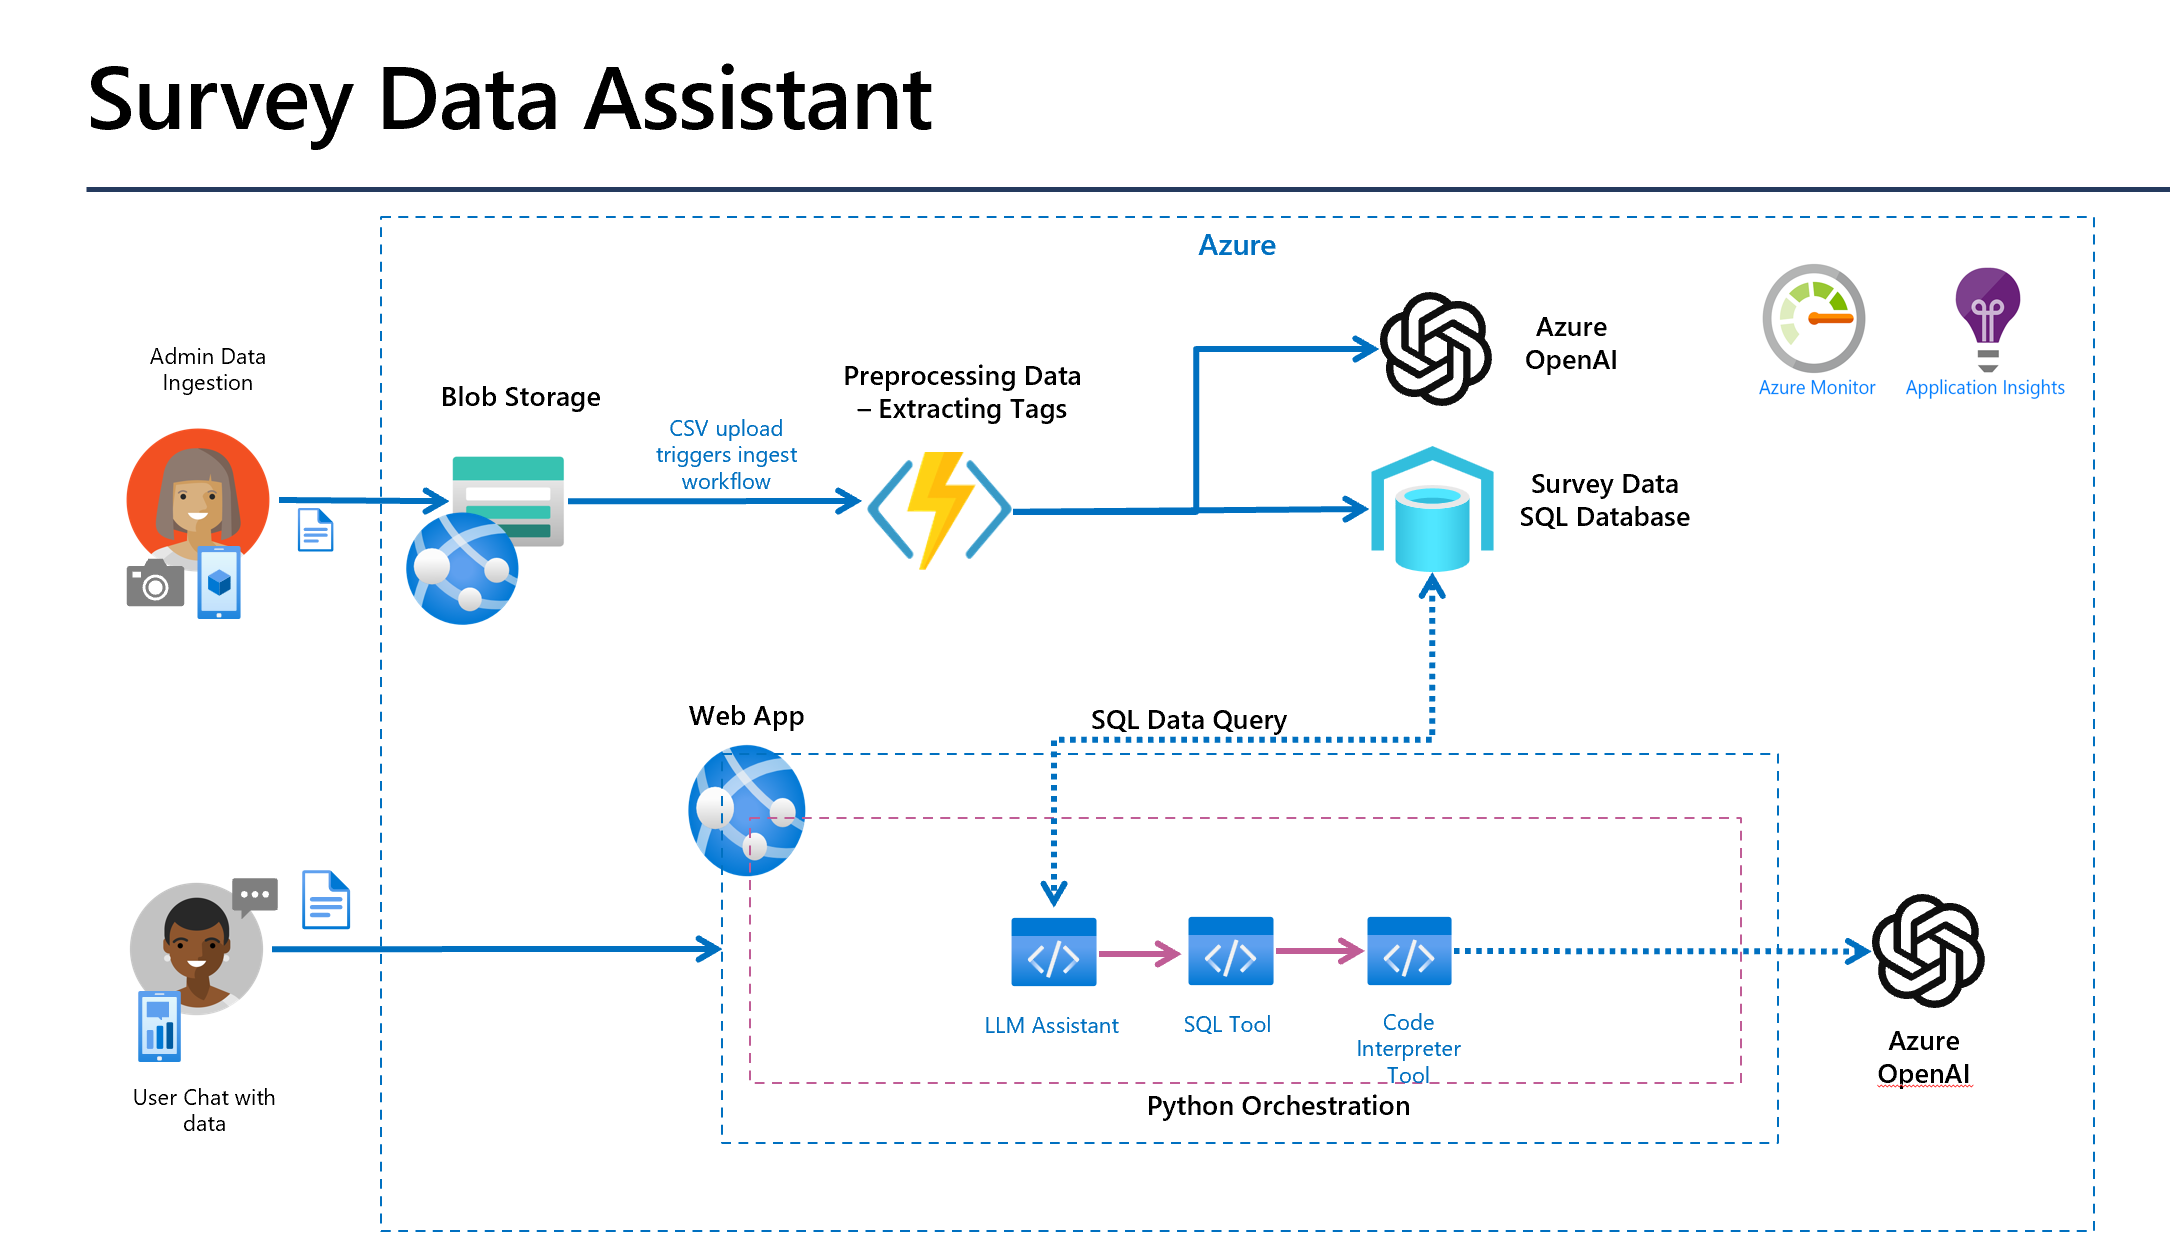
In this sample, we will show how to use Azure OpenAI Assistants with Prompt Flow.
- Python 3.11
- Conda
- Azure CLI
- AI Studio Hub & Project with an Azure OpenAI endpoint (OPENAI_API_BASE, OPENAI_API_KEY) in a region that supports assistants with an 1106 model or better -- I recommend creating it in Sweden central.
- Deployments of OpenAI models:
- deployment of
gpt-4-1106-preview/gpt-35-turbo-1106or later for use by the OpenAI assistant. Both work, butgpt-35-turbo-1106is faster andgpt-4-1106-previewis more accurate. (OPENAI_ASSISTANT_MODEL) - deployment of
gpt-35-turbo-1106or later for use by the Data Analyst to perform some limited NL to SQL. (OPENAI_ANALYST_CHAT_MODEL)
- deployment of
- Azure Application Insights (APPINSIGHTS_CONNECTION_STRING)
- SQL Server ODBC driver installed
Copy .env.sample to .env and fill in the values:
OPENAI_API_TYPE="azure"
OPENAI_API_VERSION="2024-02-15-preview"
OPENAI_API_BASE="https://***.openai.azure.com/"
OPENAI_API_KEY="******************"
OPENAI_ASSISTANT_MODEL="gpt-35-turbo-1106"
OPENAI_ANALYST_CHAT_MODEL="gpt-35-turbo-1106"
OPENAI_ASSISTANT_ID="asst_0leWabwuOmzsNVG5KCpeV" <-- you will create this further down
APPINSIGHTS_CONNECTION_STRING="InstrumentationKey=***;IngestionEndpoint=https://****.in.applicationinsights.azure.com/;LiveEndpoint=https://****"conda env create -f environment.yml
conda activate assistantThen install the pre-release version of azure-monitor-opentelemetry-exporter
pip install azure-monitor-opentelemetry-exporter --preCreate an OpenAI assistant using the setup.py script
python src/assistant_flow/setup.pyThis should ouput something like this:
OPENAI_API_KEY ******
OPENAI_API_BASE https://******.openai.azure.com
OPENAI_API_VERSION 2024-02-15-preview
{'id': 'asst_wgEXCRBQ7E4BfznSkGgJy41k', 'created_at': 1714610540, 'description': None, 'instructions': "\nYou are a helpful assistant that helps the user potentially with the help of some functions.\n\nIf you are using multiple tools to solve a user's task, make sure to communicate \ninformation learned from one tool to the next tool.\nFirst, make a plan of how you will use the tools to solve the user's task and communicated\nthat plan to the user with the first response. Then execute the plan making sure to communicate\nthe required information between tools since tools only see the information passed to them;\nThey do not have access to the chat history.\nIf you think that tool use can be parallelized (e.g. to get weather data for multiple cities) \nmake sure to use the multi_tool_use.parallel function to execute.\n\nOnly use a tool when it is necessary to solve the user's task. \nDon't use a tool if you can answer the user's question directly.\nOnly use the tools provided in the tools list -- don't make up tools!!\n\nAnything that would benefit from a tabular presentation should be returned as markup table.\n", 'metadata': {}, 'model': 'gpt-35-turbo-1106', 'name': 'Survey Assistant', 'object': 'assistant', 'tools': [{'type': 'code_interpreter'}, {'function': {'name': 'survey_data_insights', 'description': '\n            get some data insights about the contoso survey data. This tool has information about total survey, return return rates, discounts given, etc., by date, product category, etc.\n            you can ask questions like:\n            - query for the month with the strongest revenue\n            - which day of the week has the least survey in january\n            - query the average value of orders by month\n            - what is the average sale value for Tuesdays\n            If you are unsure of the data available, you can ask for a list of categories, days, etc.\n            - query for all the values for the main_category\n            If a query cannot be answered, the tool will return a message saying that the query is not supported. otherwise the data will be returned.\n            ', 'parameters': {'type': 'object', 'properties': {'question': {'type': 'string', 'description': "The question you want to ask the tool in plain English. e.g. 'what is the average sale value for Tuesdays'"}}, 'required': ['question']}}, 'type': 'function'}], 'response_format': None, 'temperature': None, 'tool_resources': None, 'top_p': None, 'file_ids': []}
Assistant created with id asst_wgEXCRBQ7E4BfznSkGgJy41k
add the following to your .env file
OPENAI_ASSISTANT_ID="asst_wgEXCRBQ7E4BfznSkGgJy41k"
You should go to your Azure AI Studio project and check that the assistant was actually created -- it should look like this:
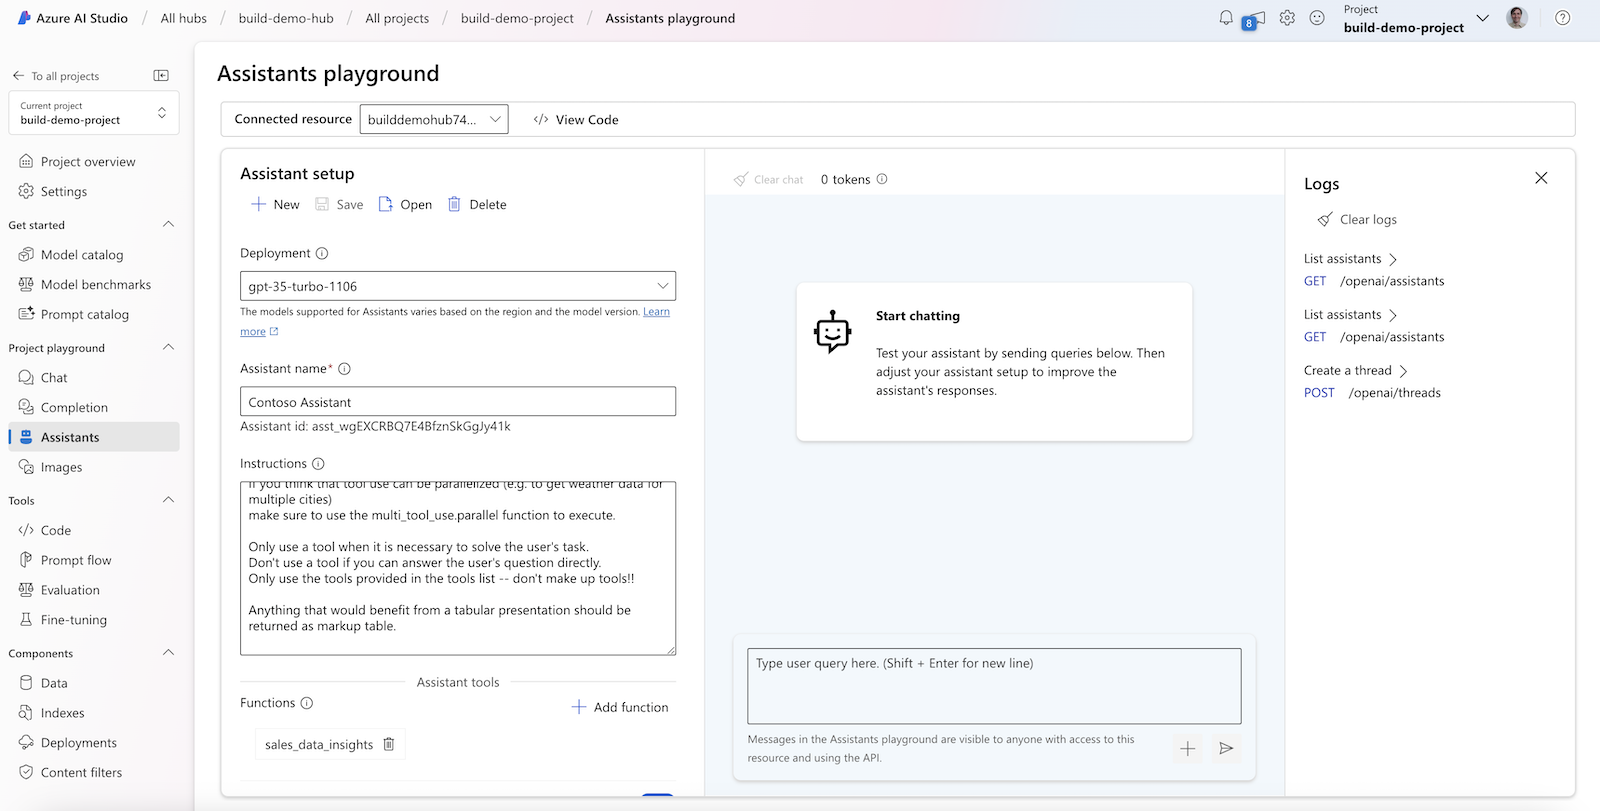
Then do as suggested on the console by adding the provided line OPENAI_ASSISTANT_ID="asst_*****" to the .env file.
You can test that the flow is working correctly by running the following command:
pf flow test --flow assistant_flow.chat:chat_completion --uiThis will start the prompt flow service (pfs) and provide a URL to the chat UI. The console output will be similar to this:
Prompt flow service has started...
You can begin chat flow on http://127.0.0.1:23333/v1.0/ui/chat?flow=L1VzZXJzL2RhbmllbHNjL2dpdC9hc3Npc3RhbnQtcGYtZGVtby9zcmMvYXNzaXN0YW50X2Zsb3cvZmxvdy5kYWcueWFtbA%3D%3D
You can ask the assistant questions like:
get the order numbers by month for the last year and plot it in a line chart using matplotlib. Make sure to use the month names in the plot.
The sample app uses chainlit to build a simple chat UI that is capable of displaying images. The app is started like so:
python src/app.pyThe console output will be similar to this (port numbers might differ):
2024-05-01 20:49:19 - Loaded .env file
2024-05-01 20:49:21 - collection: assistant-test
2024-05-01 20:49:21 - resource attributes: {'service.name': 'promptflow', 'collection': 'assistant-test'}
2024-05-01 20:49:21 - tracer provider is set with resource attributes: {'service.name': 'promptflow', 'collection': 'assistant-test'}
Starting prompt flow service...
Start prompt flow service on port 23334, version: 1.10.0.
You can stop the prompt flow service with the following command:'pf service stop'.
Alternatively, if no requests are made within 1 hours, it will automatically stop.
2024-03-30 11:15:14 - Your app is available at http://localhost:8000
Open two browser tabs, one to http://localhost:8000 and one to http://localhost:23334/v1.0/ui/traces/
Should be able to chat with the assistant in the chat UI and see the traces in the other tab.
Here is an example of a sequence diagram that illustrates the flow of an assistant interaction with the Survey Data Insights tool. The flow starts with the frontend asking for a line chart of survey data. The Promptflow service then calls the assistant to get the survey data. The assistant then calls the Survey Data Insights tool to get the survey data. The Survey Data Insights tool then calls a SQL database to get the data. The data is then passed back to the assistant, which then calls the Code Interpreter tool to generate the line chart. The line chart is then passed back to the frontend. The flow is illustrated below:
sequenceDiagram
    autonumber
    actor Frontend
    participant Promptflow
    participant SurveyDataInsights
    box Azure OpenAI Service
        participant Assistant
        participant CodeInterpreter
    end

    Frontend->>Promptflow: show me survey data in a line chart
    activate Promptflow
    Promptflow->>Assistant: show me survey data in a line chart
    activate Assistant
    loop
        Assistant->>Assistant: call LLM
    end
    Assistant-->>Promptflow: tool_call: SDI("get survey data")
    deactivate Assistant
    Promptflow-->Frontend: notify:calling SDI("get survey data")
    Promptflow->>SurveyDataInsights:  get survey data
    activate SurveyDataInsights
    loop
        SurveyDataInsights->>SurveyDataInsights: call SQL
    end
    SurveyDataInsights-->>Promptflow: ["survey", "data", "in", "json", "format"]
    deactivate SurveyDataInsights
    Promptflow->>Assistant: tool_reply: ["survey", ...]
    activate Assistant
    loop
        Assistant->>Assistant: call LLM
    end
    Assistant->>CodeInterpreter: "import matplotlib ...."
    CodeInterpreter-->>Assistant: <Image>
    Assistant-->>Promptflow: "Here is the requested plot", <Image>
    deactivate Assistant
    Promptflow-->>Frontend: "Here is the requested plot", <Image>
    deactivate Promptflow
In addition to viewing the traces in the local promptflow traces view, you can also log the traces to Azure AI Studio. To do this, you need to set the trace destination to the Azure AI Studio workspace. You will need your Azure subscription ID, resource group, and project name.
pf config set trace.destination=azureml://subscriptions/15ae9cb6-95c1-483d-a0e3-b1a1a3b06324/resourceGroups/danielsc/providers/Microsoft.MachineLearningServices/workspaces/build-demo-projectOn first run, the above should produce output like this:
The workspace Cosmos DB is not initialized yet, will start initialization, which may take some minutes...
Set config [{'trace.destination': 'azureml://subscriptions/15ae9cb6-95c1-483d-a0e3-b1a1a3b06324/resourceGroups/danielsc/providers/Microsoft.MachineLearningServices/workspaces/build-demo-project'}] successfully.
After setting the trace destination, you might need to restart the pfs service:
pf service stop
pf service start
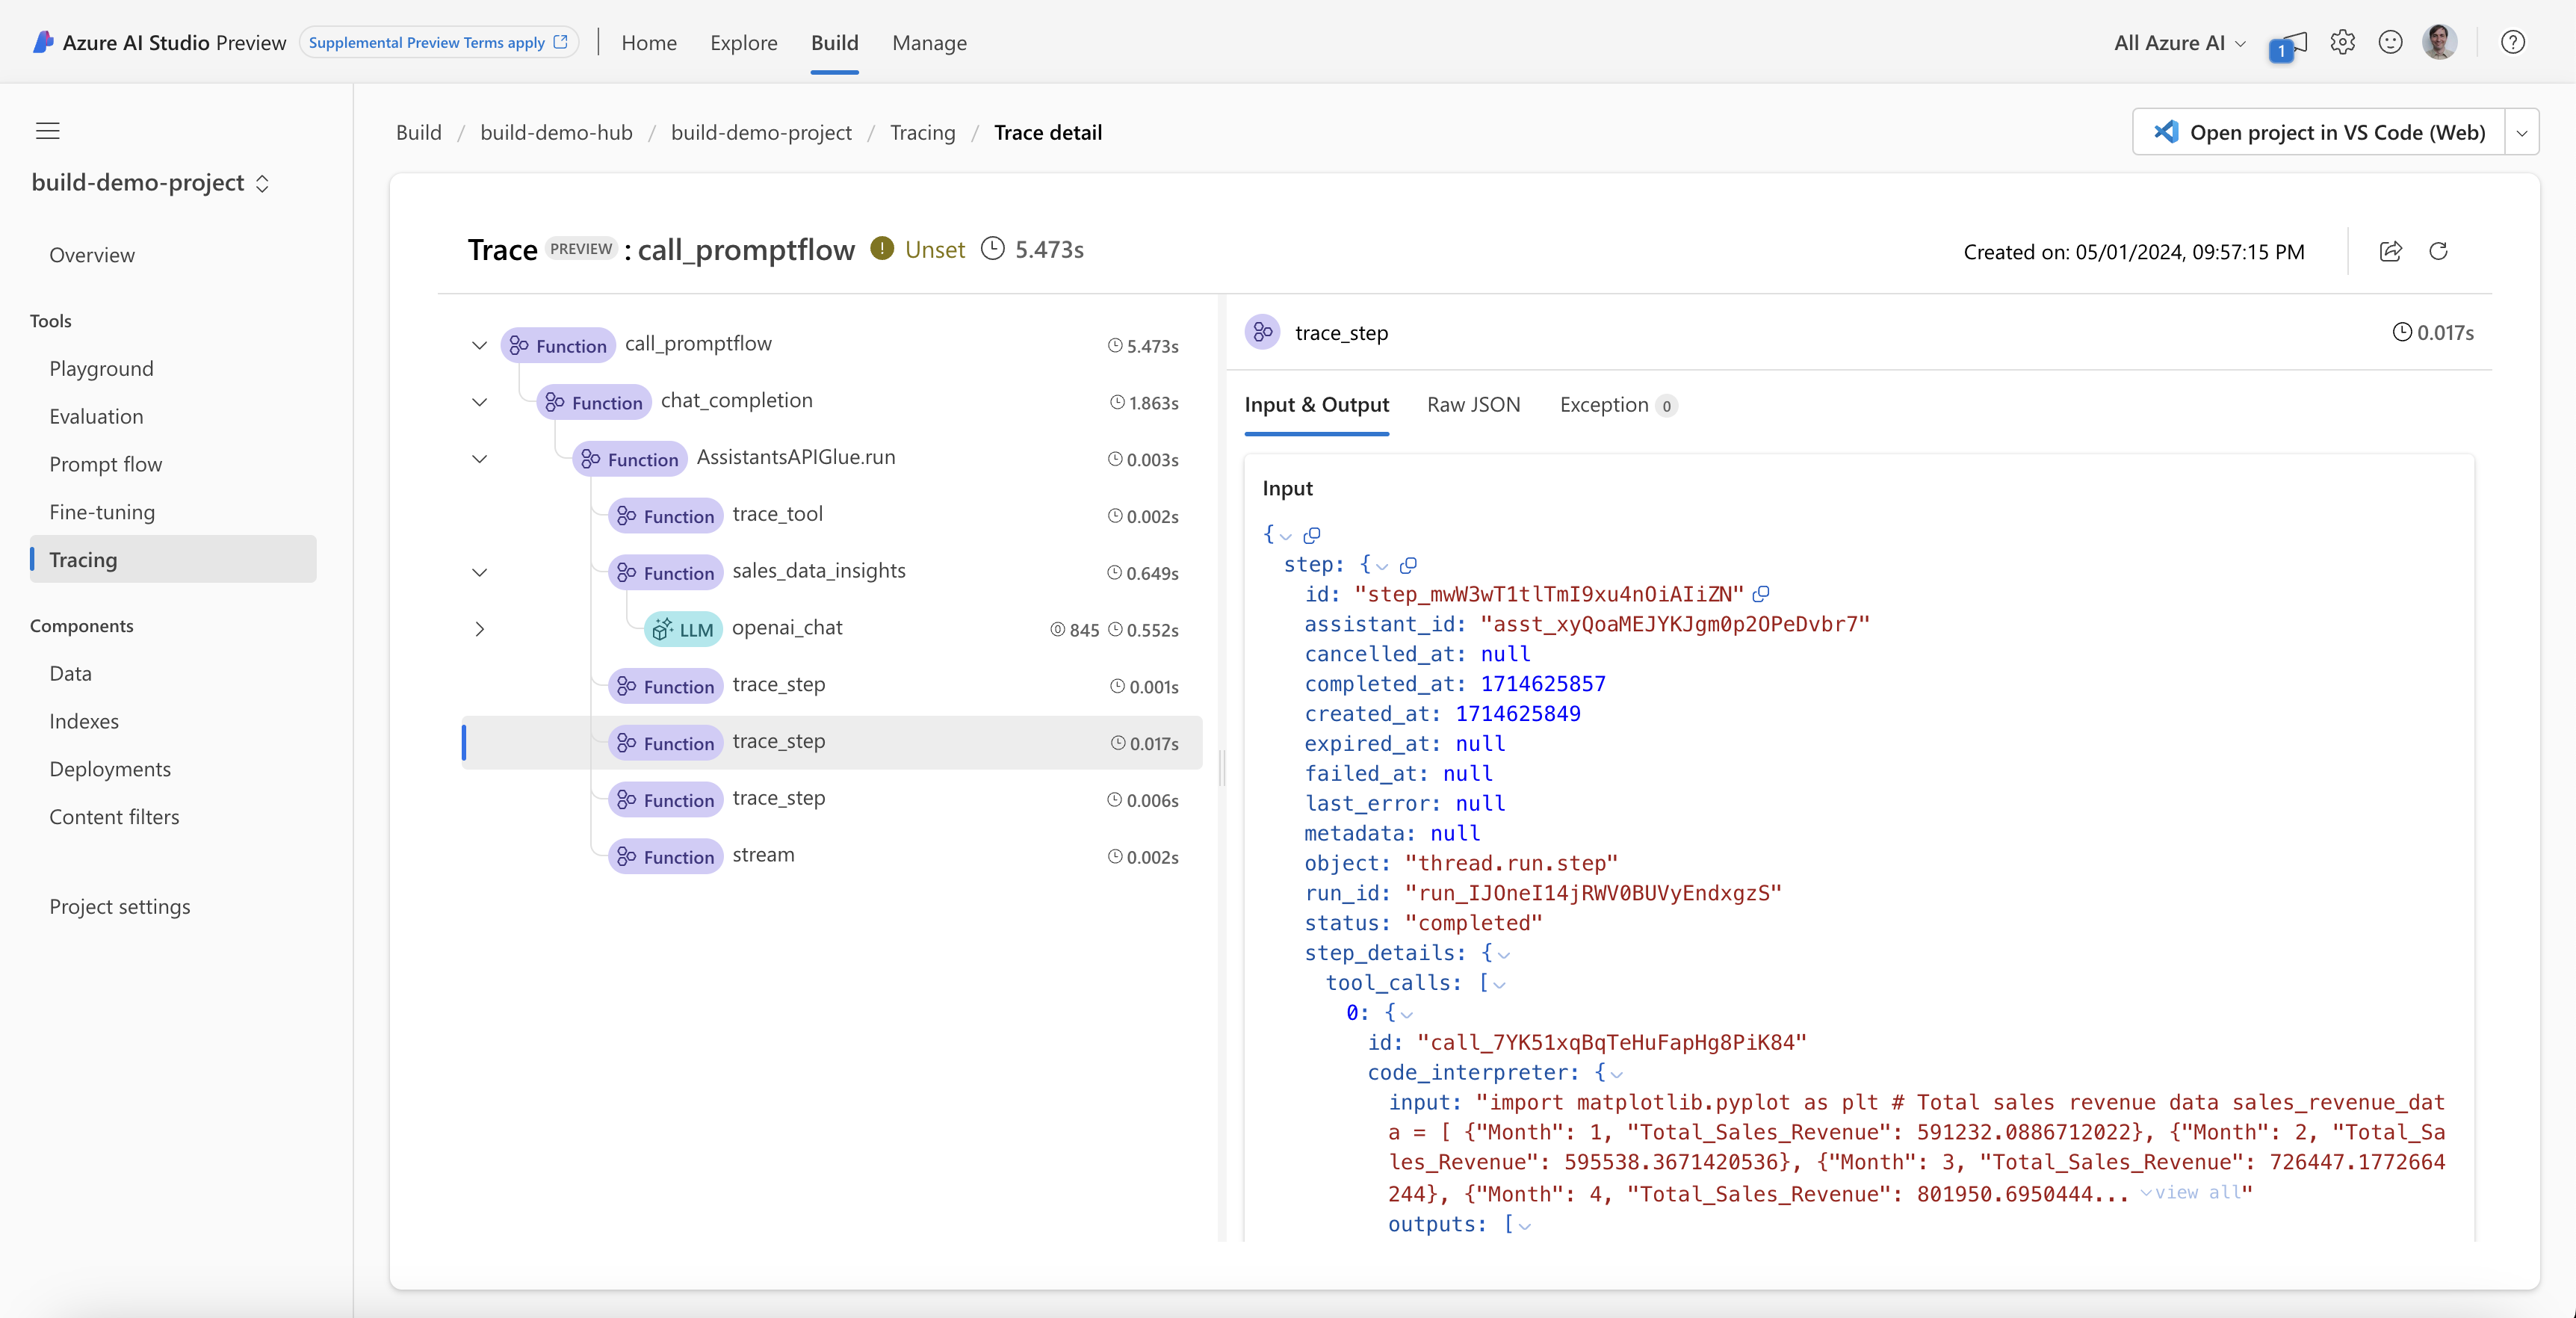
When you use the chat UI, you should see traces in the Azure AI Studio workspace. In the output logs of the app you should see the URL to the trace views for local and Azure AI Studio:
...
You can view the trace detail from the following URL:
http://localhost:23334/v1.0/ui/traces/?#collection=assistant-test&uiTraceId=0x67a45d1c29d32e62f50eda806ff51a3b
https://ai.azure.com/projecttrace/detail/0x67a45d1c29d32e62f50eda806ff51a3b?wsid=/subscriptions/15ae9cb6-95c1-483d-a0e3-b1a1a3b06324/resourceGroups/danielsc/providers/Microsoft.MachineLearningServices/workspaces/build-demo-project&flight=PFTrace
...
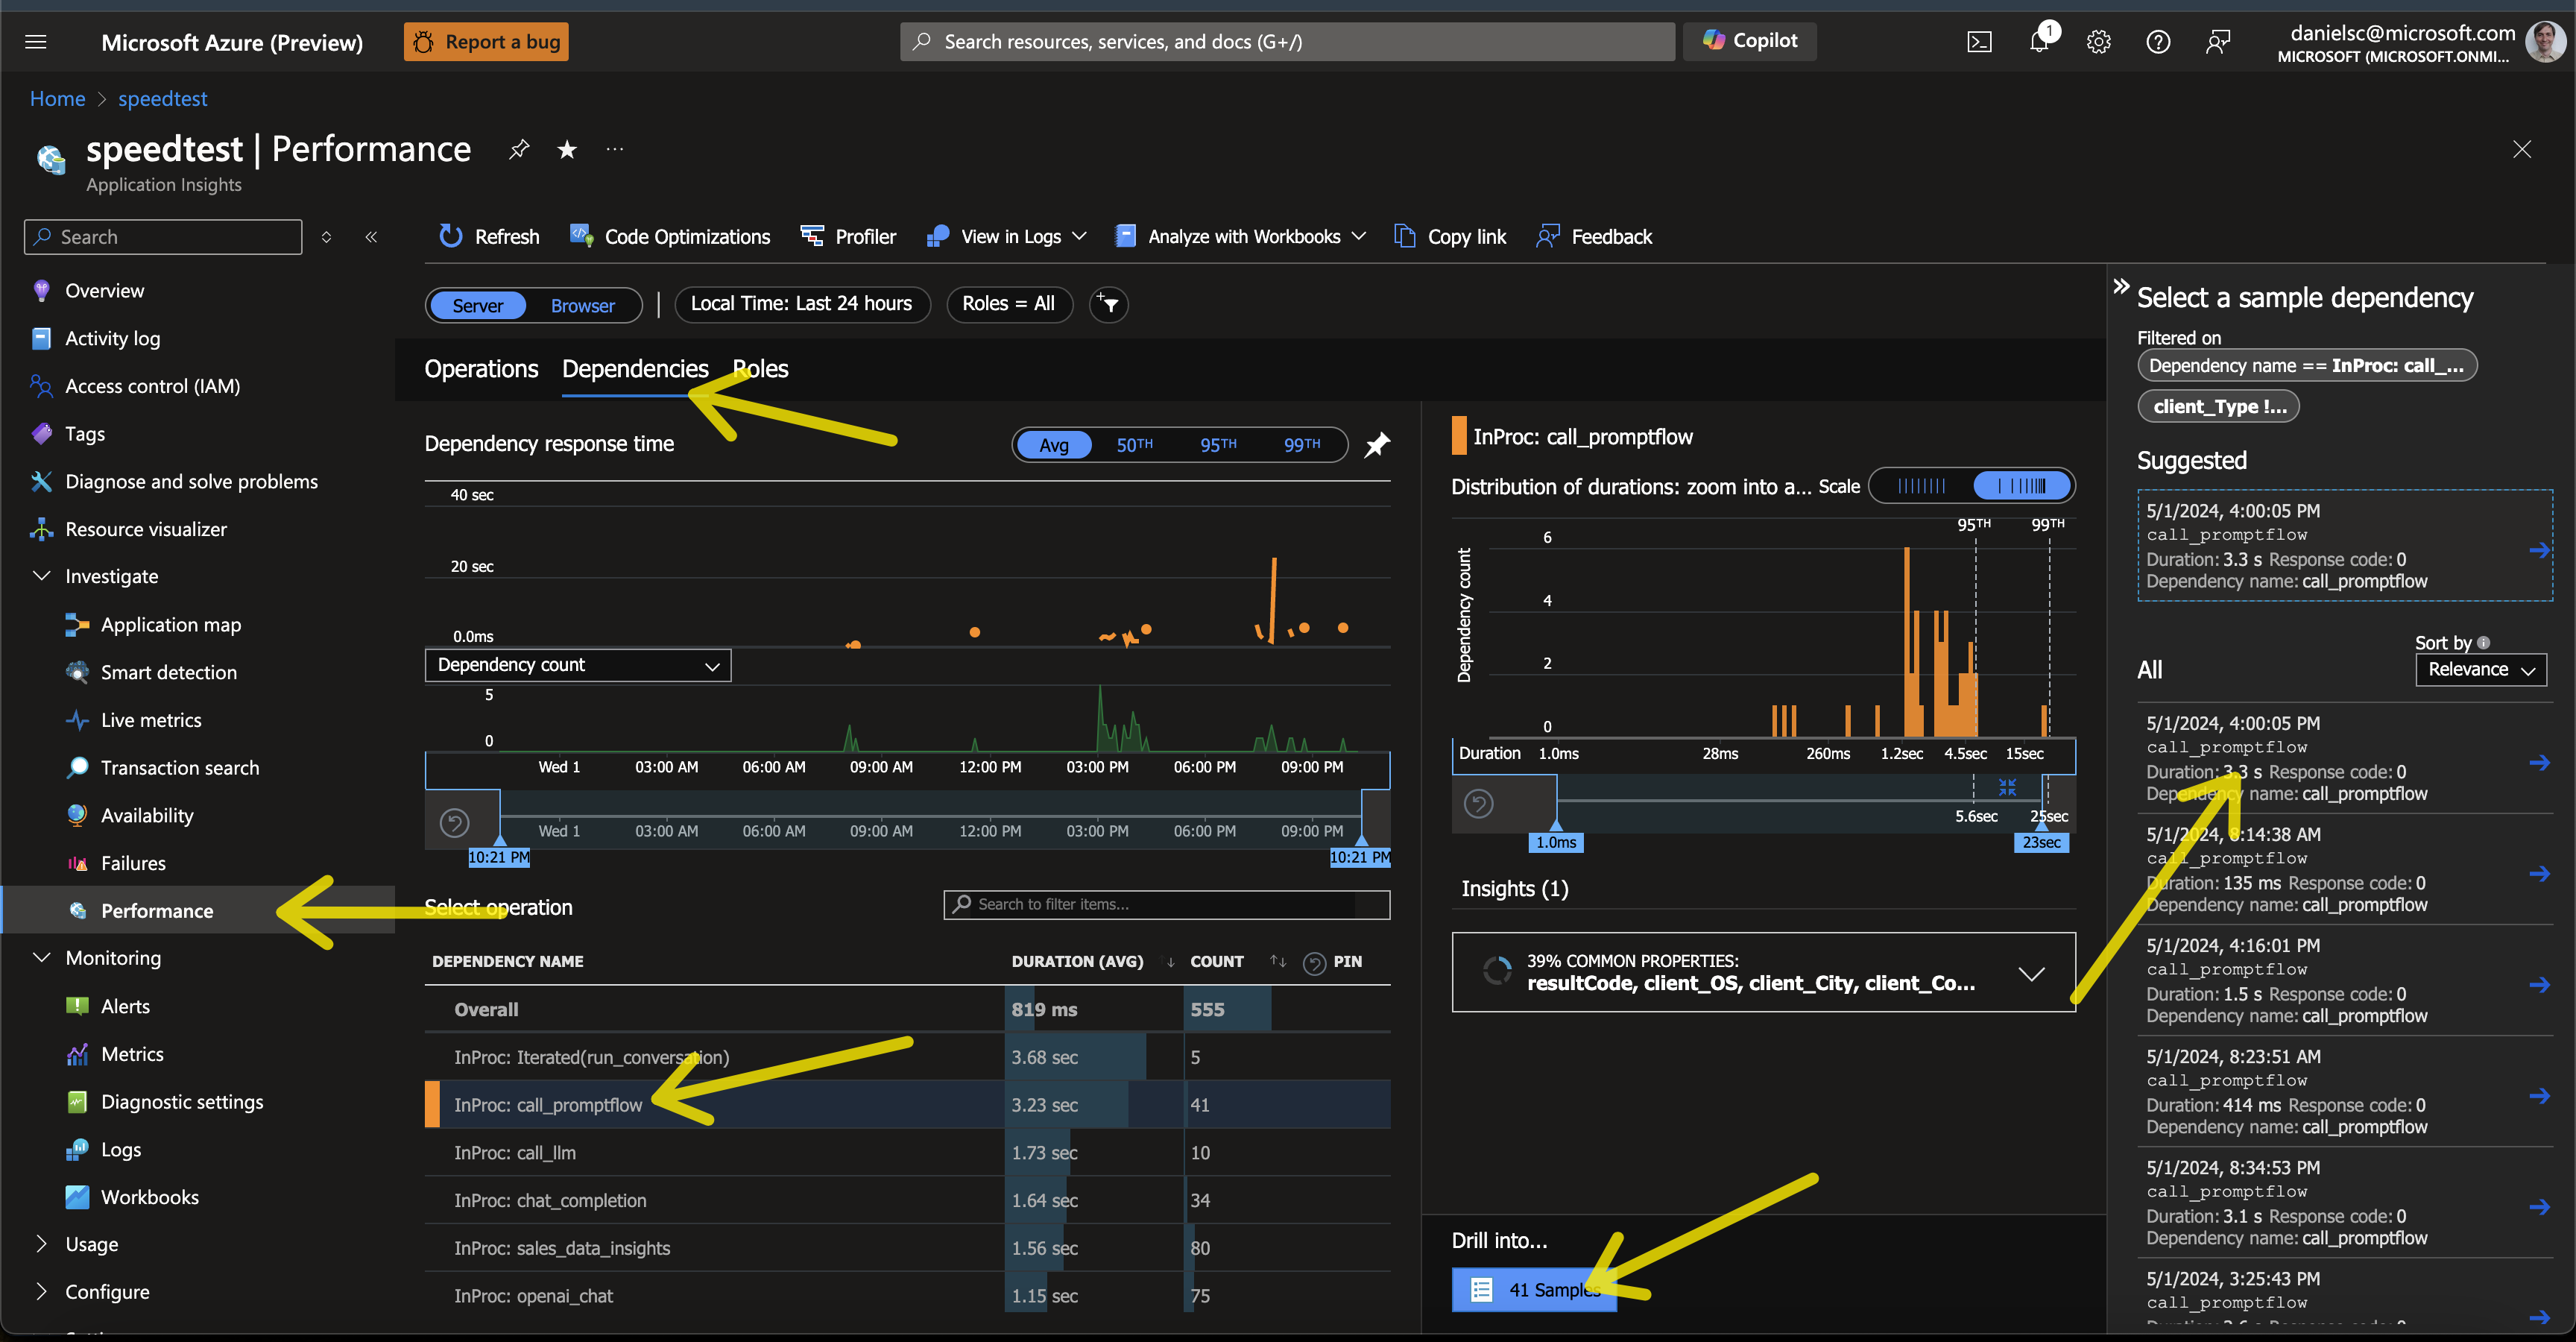
You can also view the traces in Application Insights. You already set the environment variable APPINSIGHTS_CONNECTION_STRING in the .env file. The value should be the connection string of the Application Insights instance you want to use.
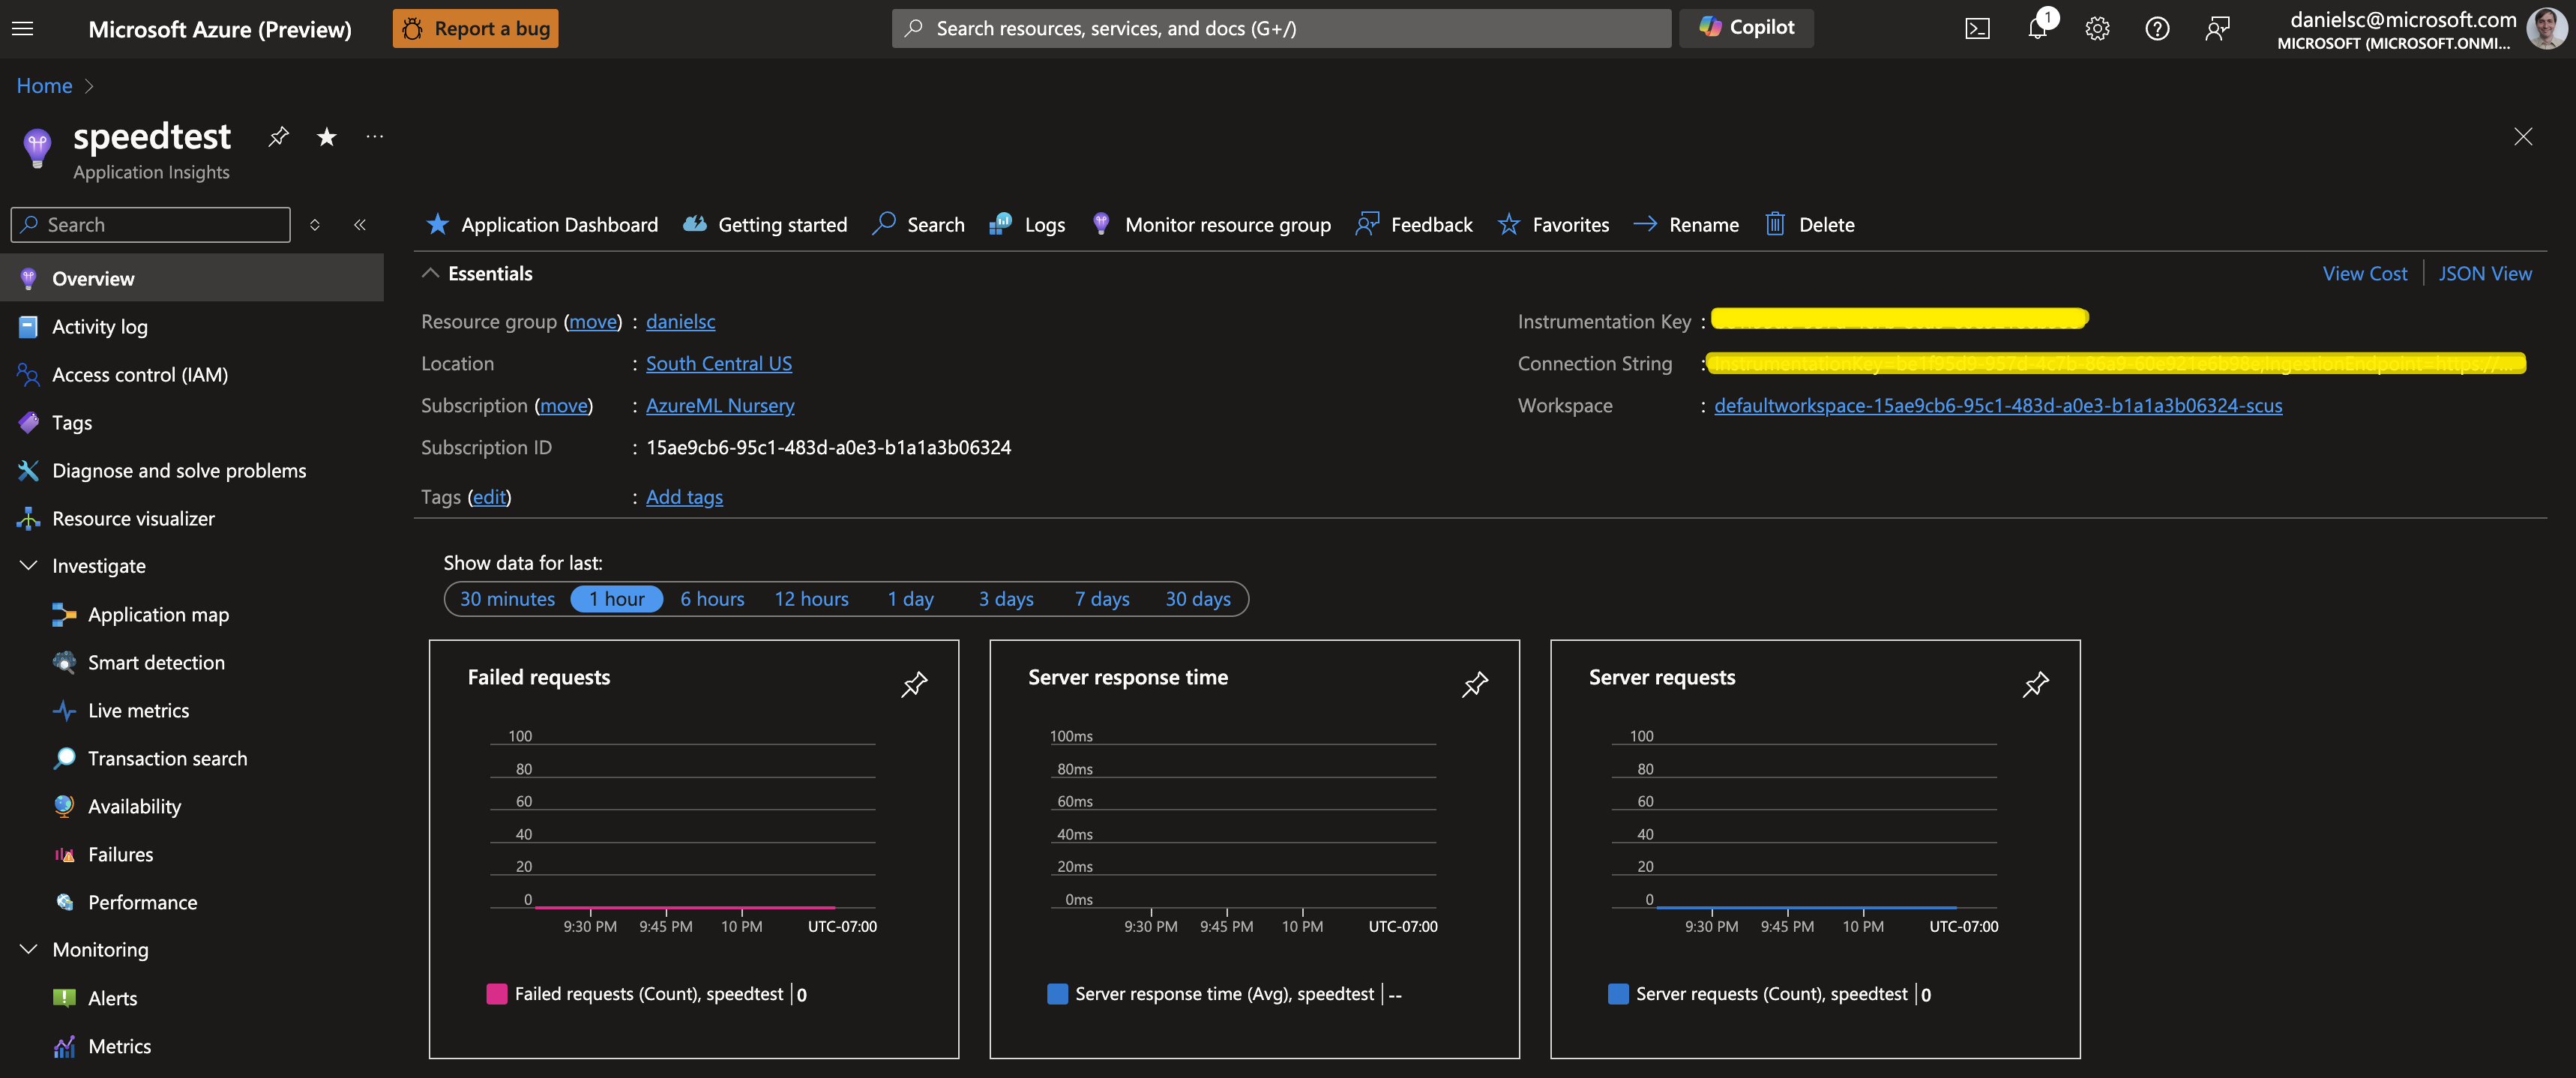
To see the traces here, you can for instance use the End-to-End transaction details view in Application Insights. To get there, follow the clicks as shown in the image below:
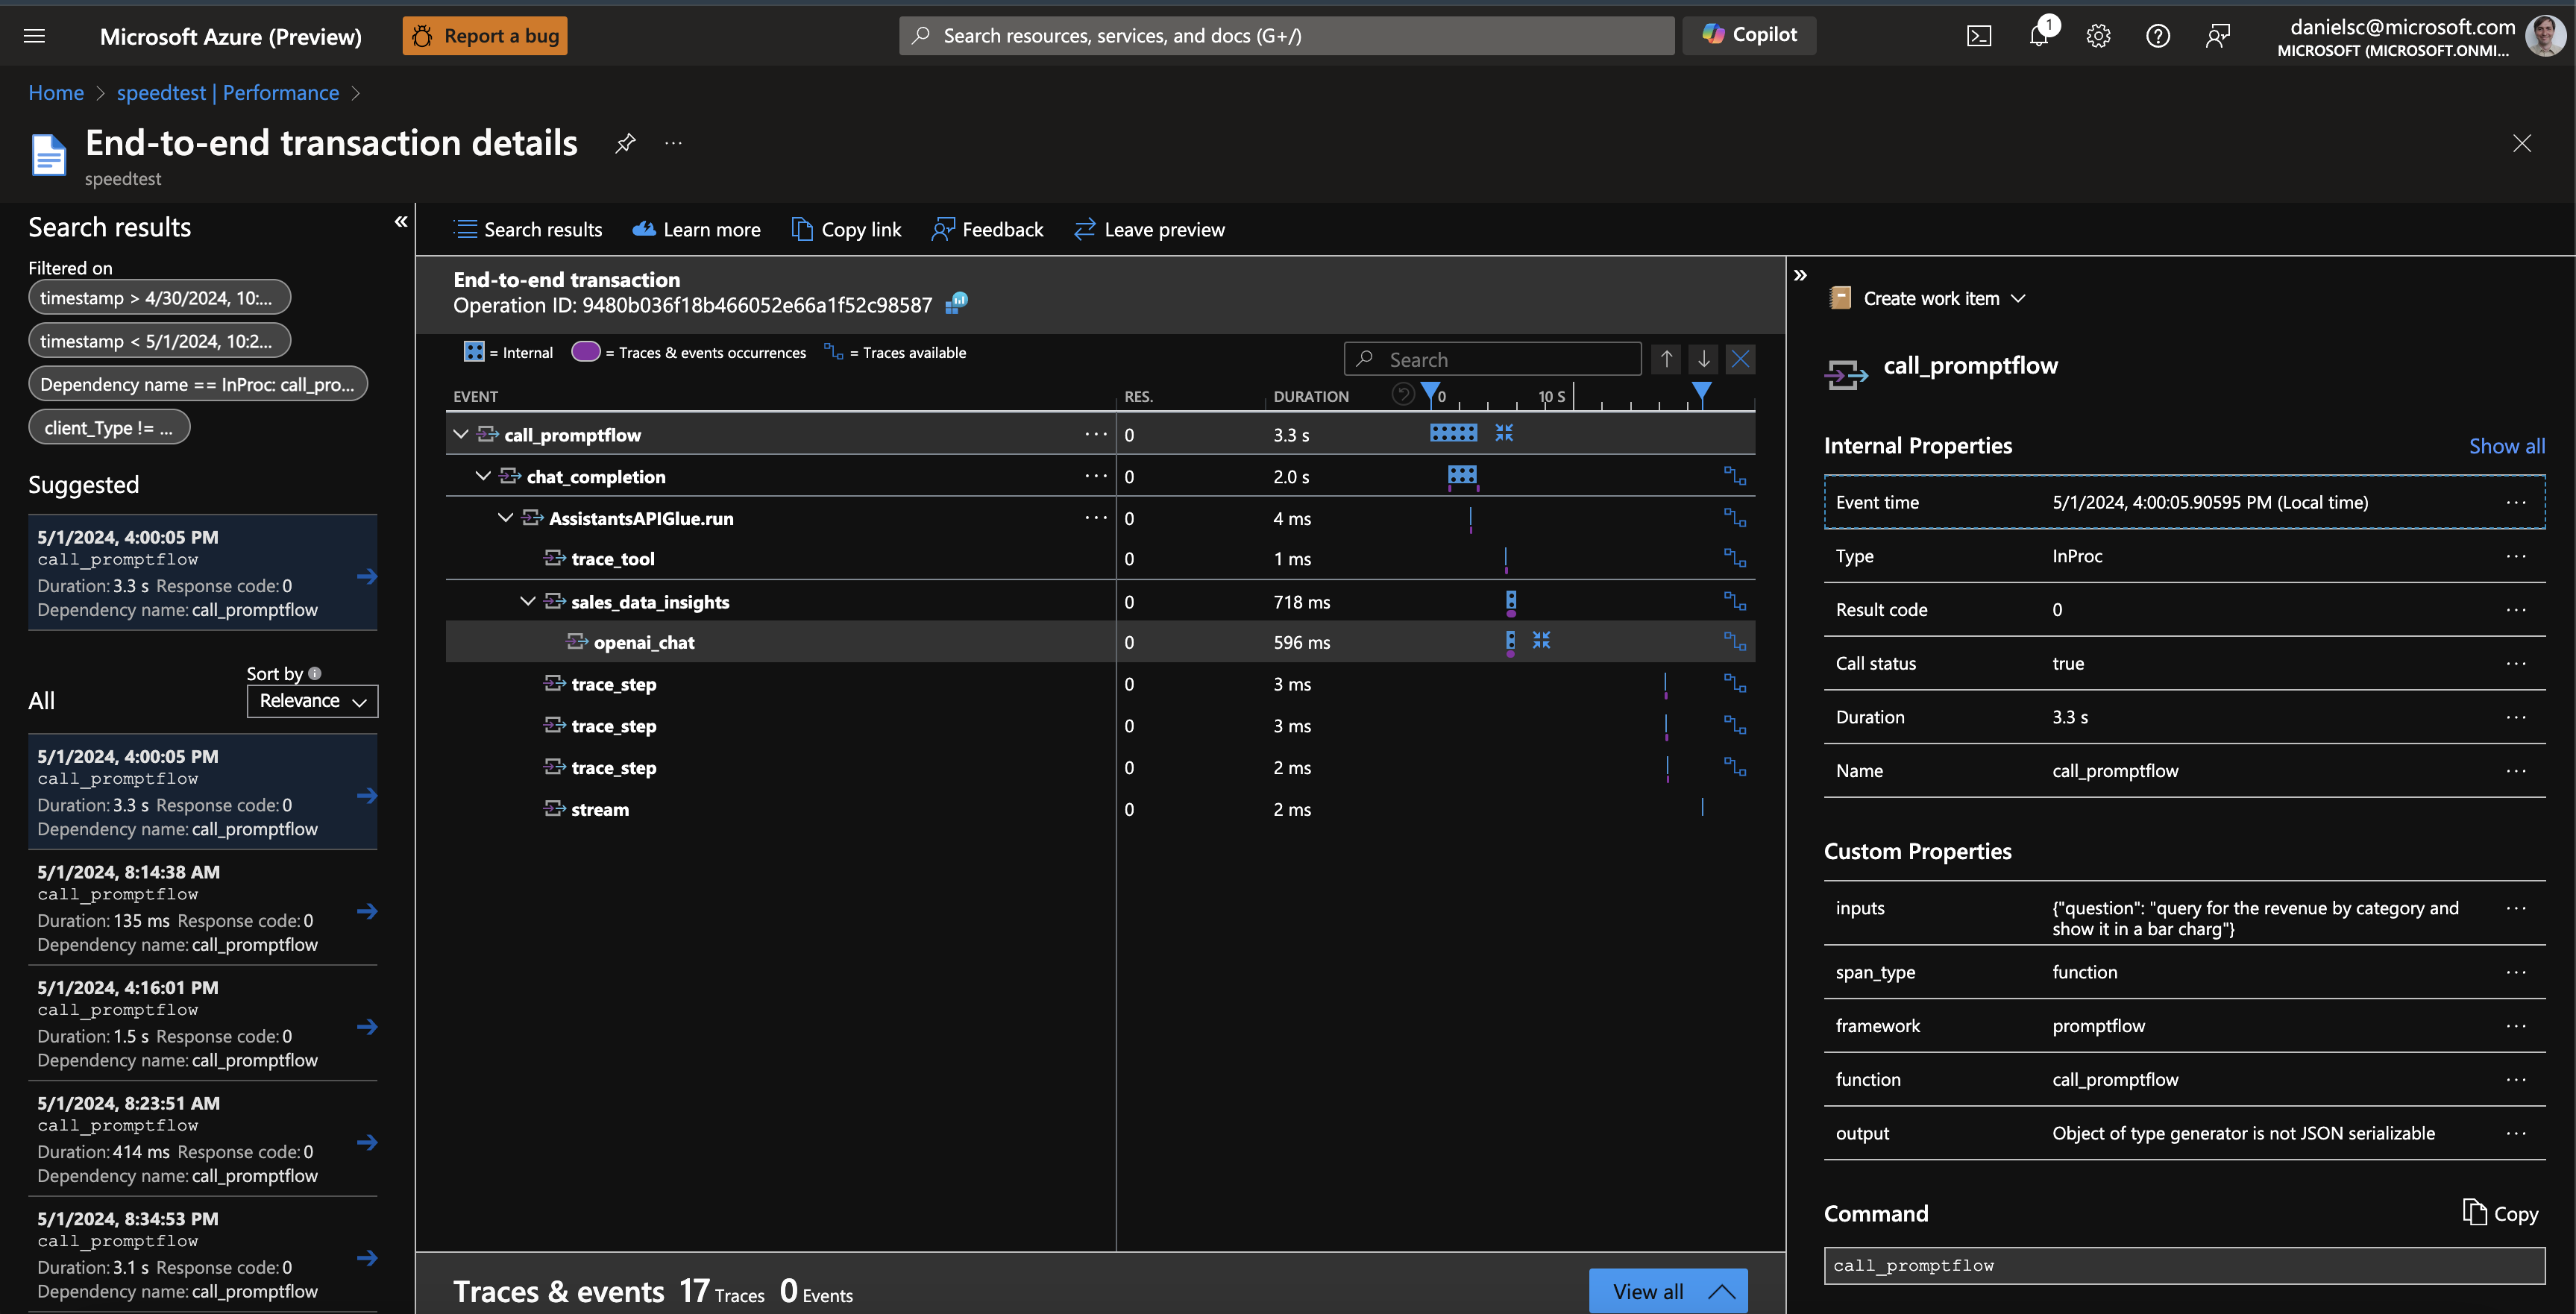
Which will give you a view like this:
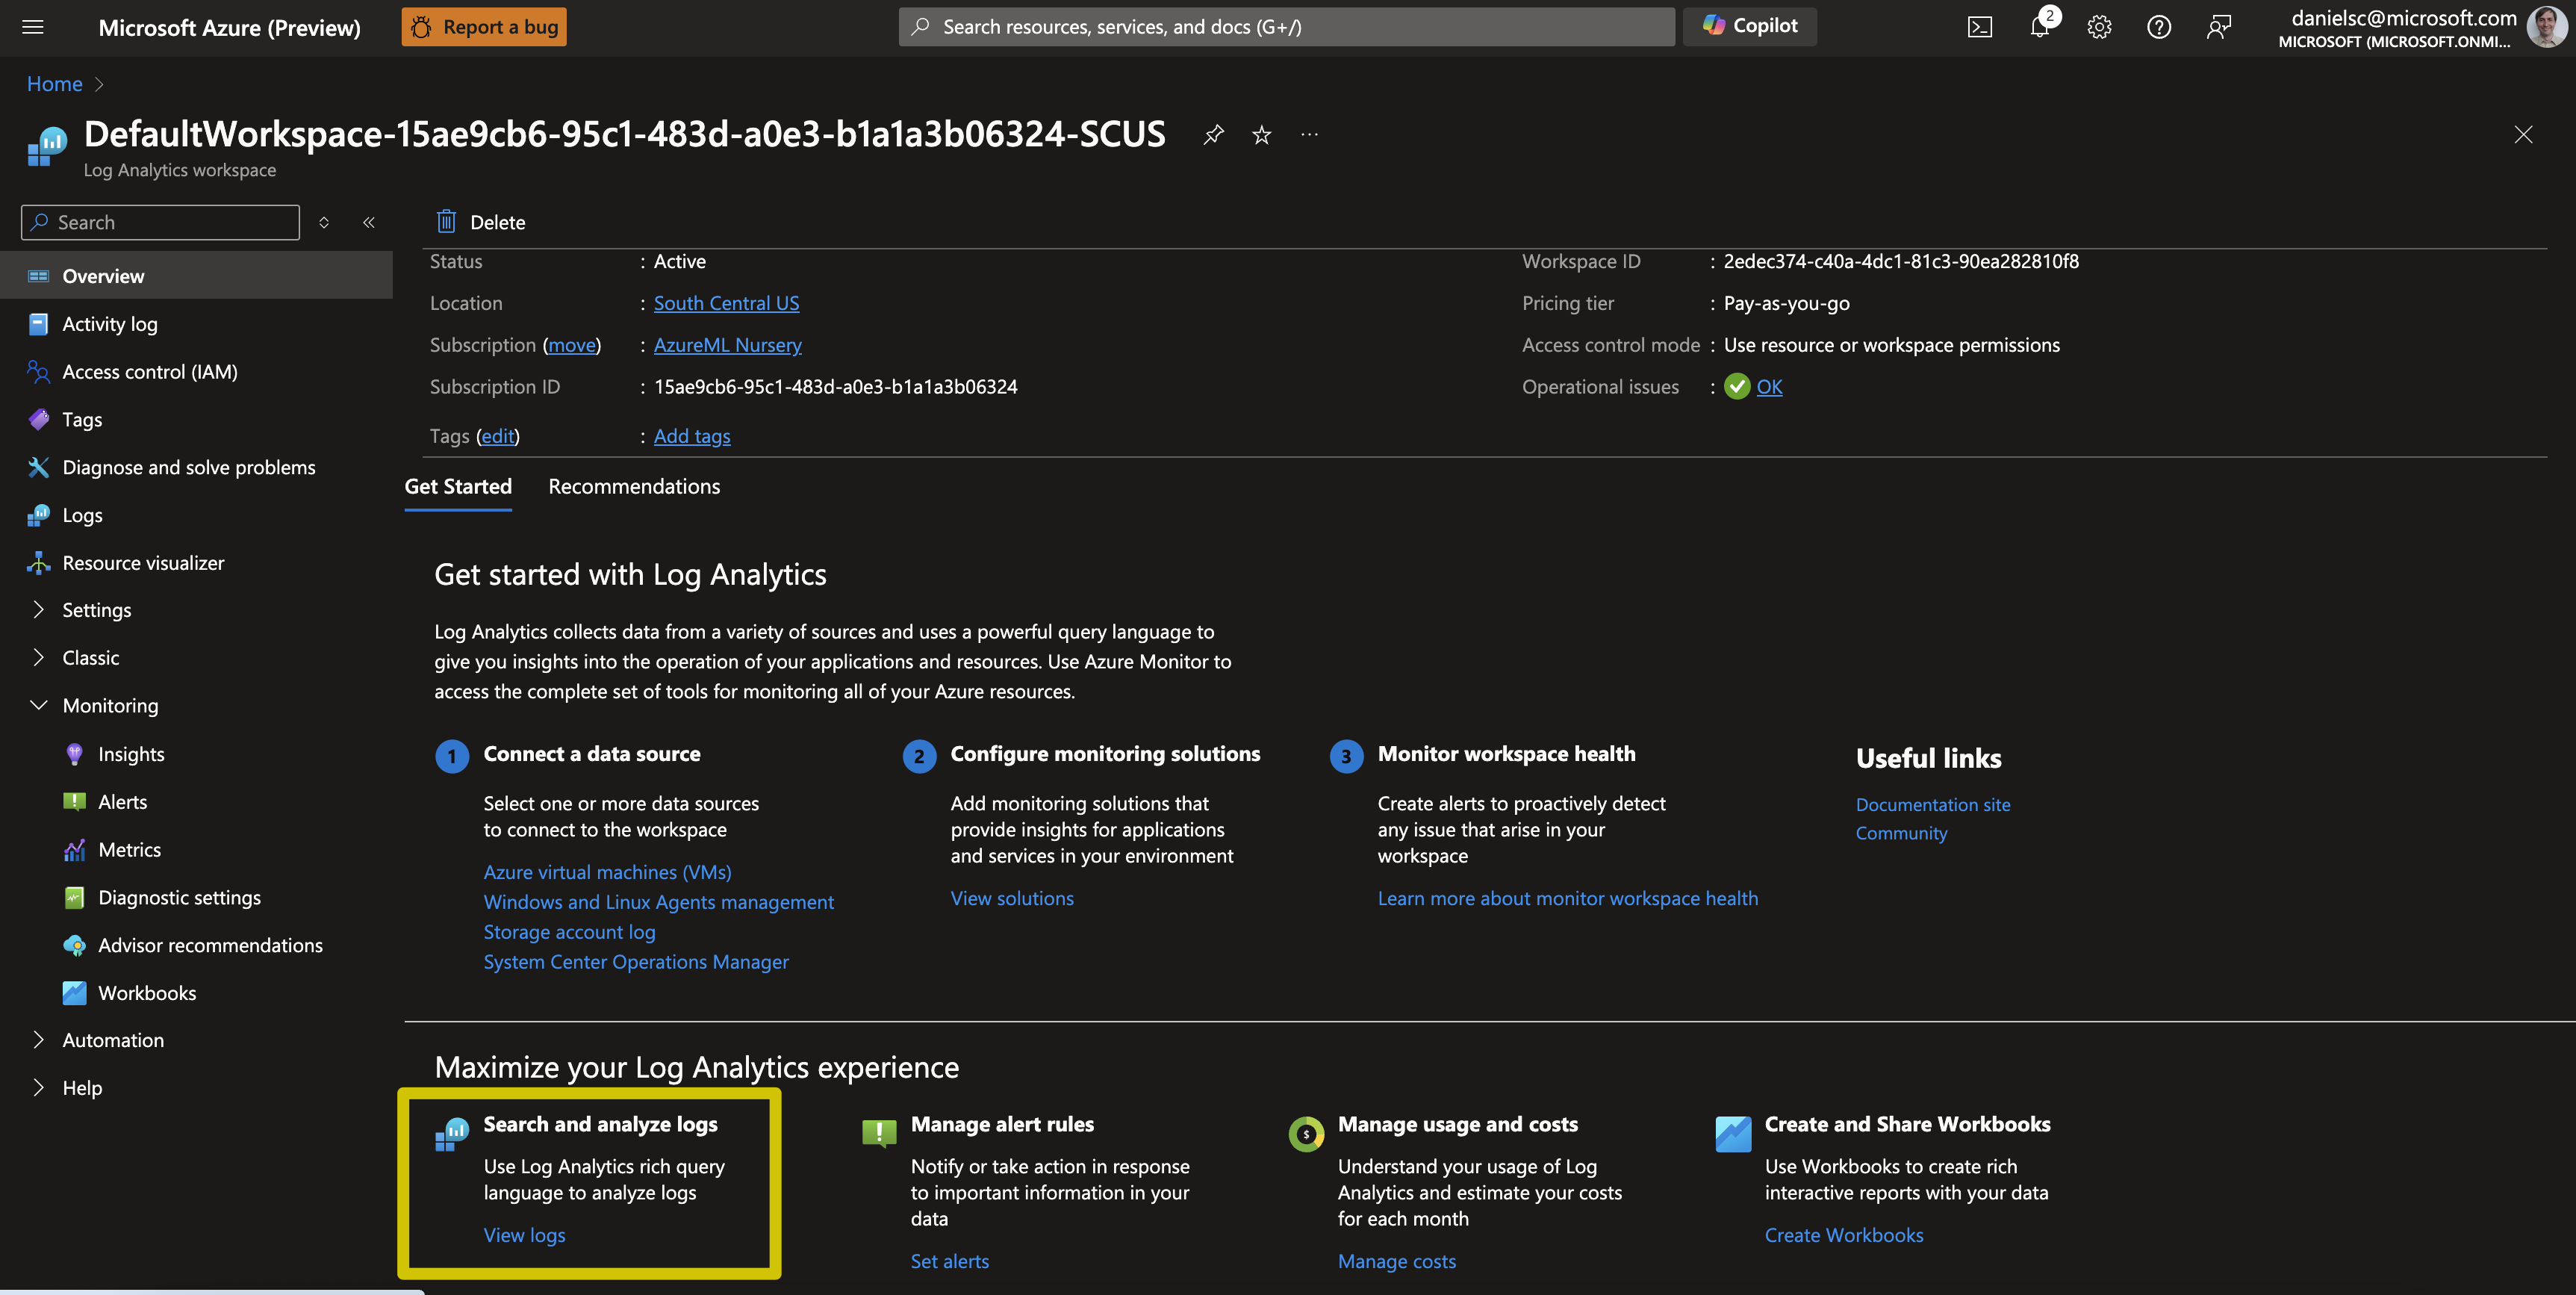
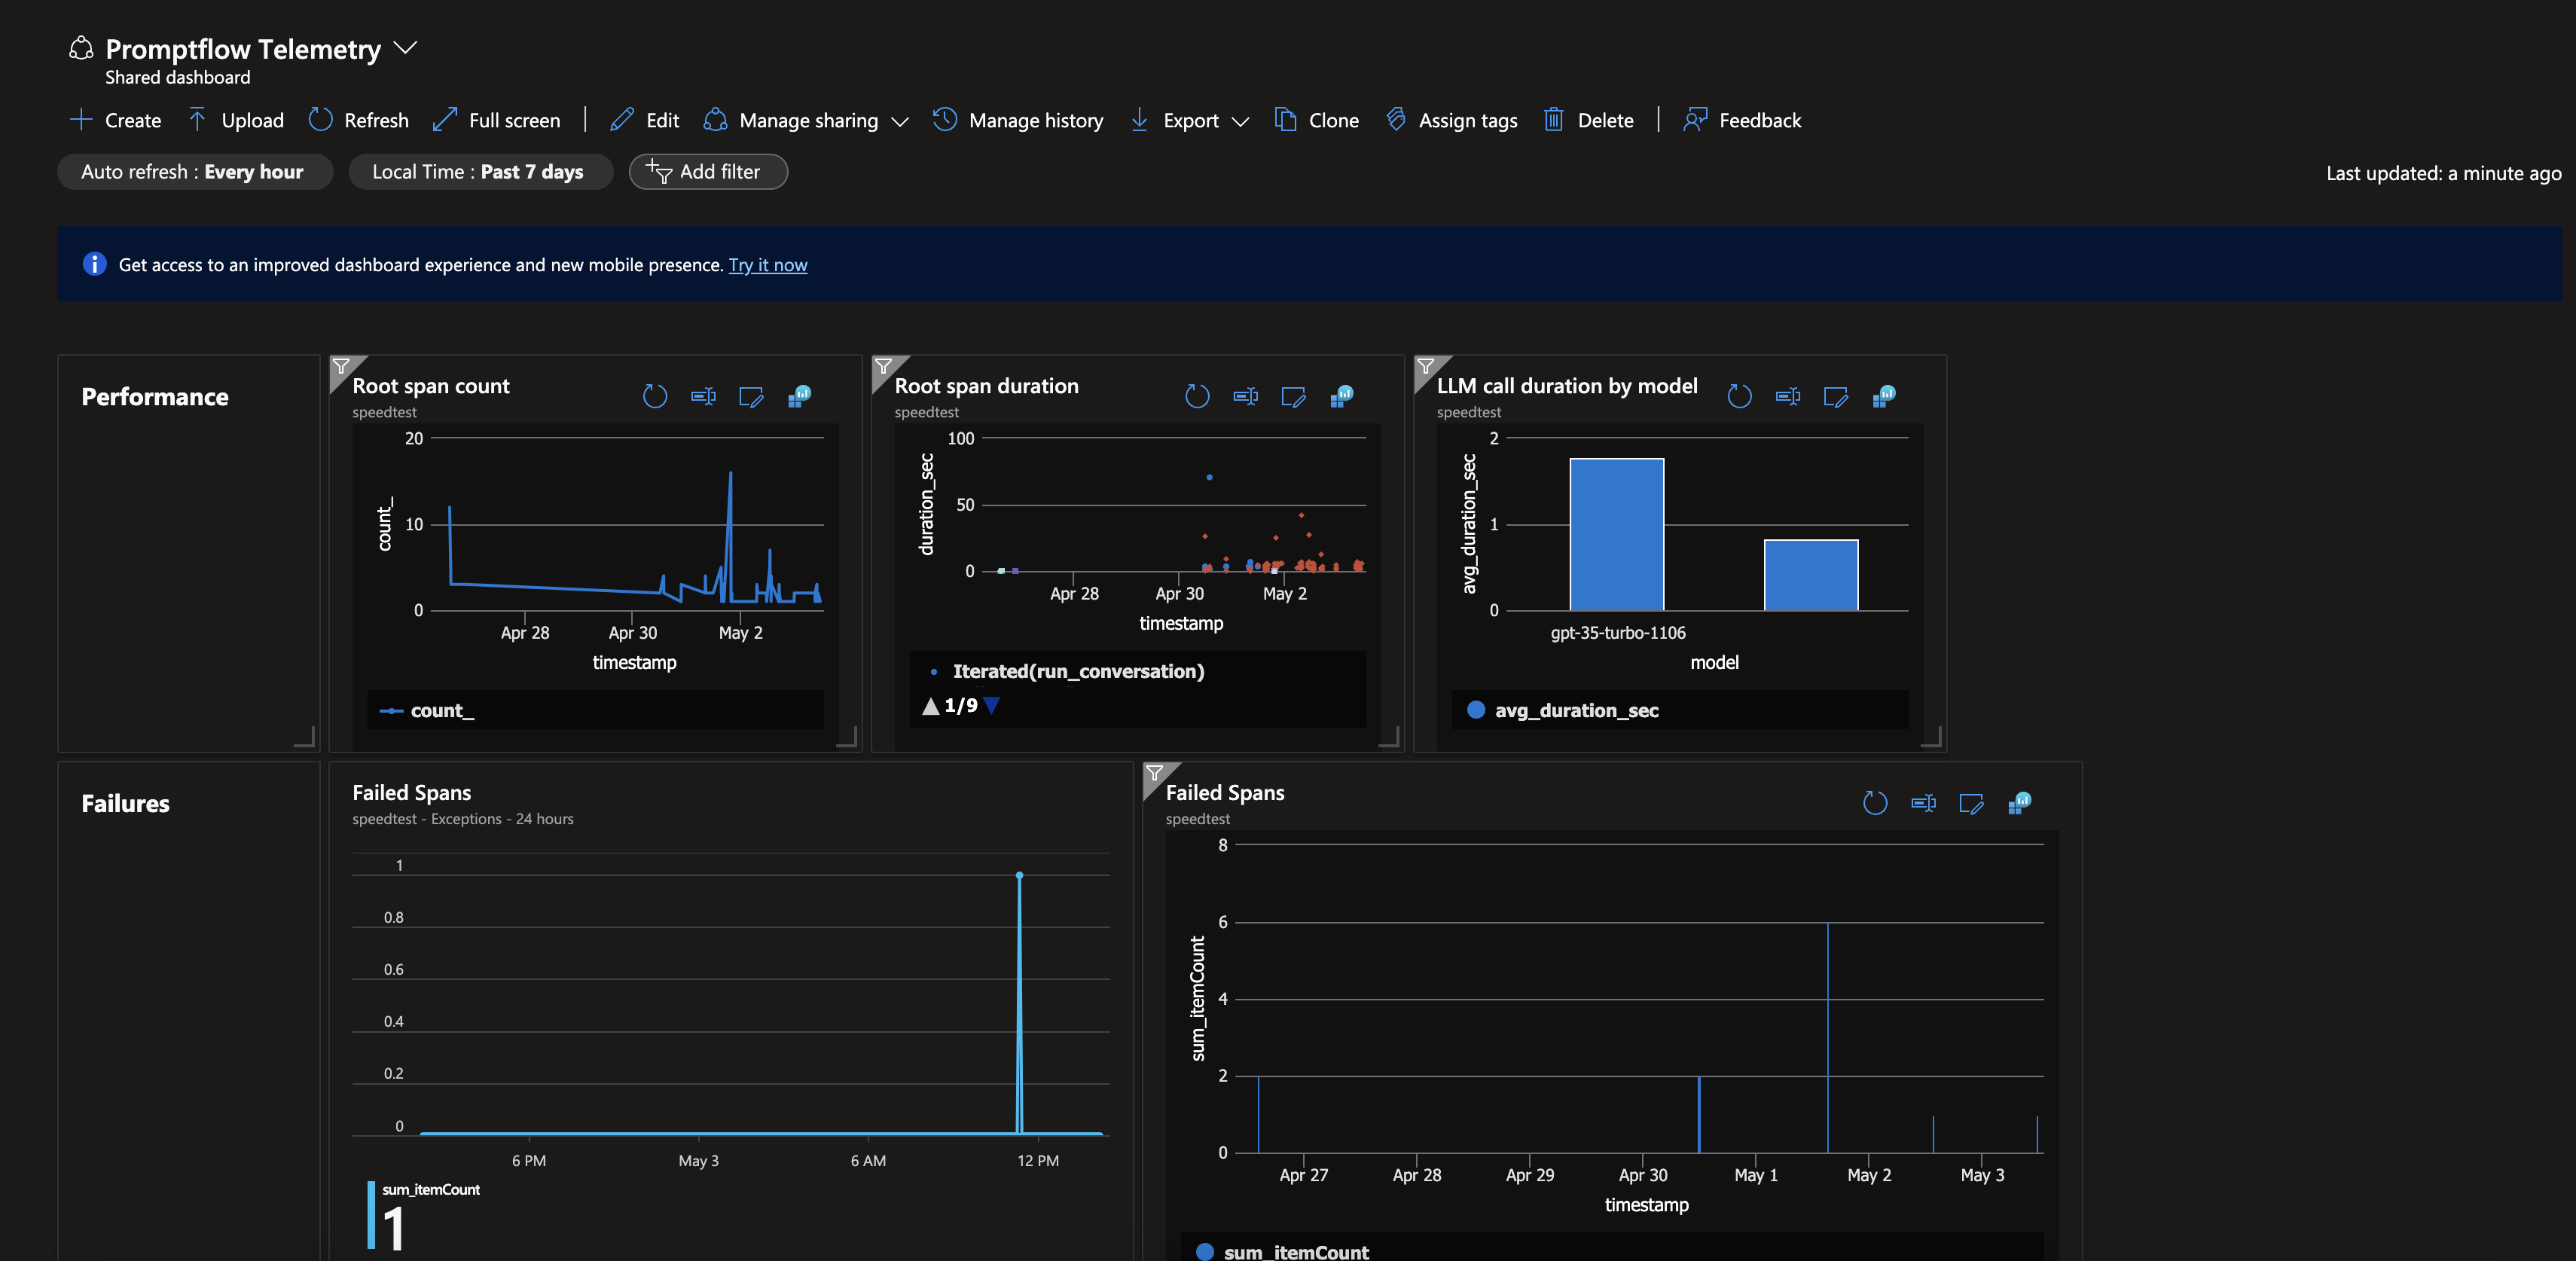
To have the Telemetry from Promptflow and your app show up in and Azure Portal Dashboard or a Grafana Dashboard, you can follow these steps:
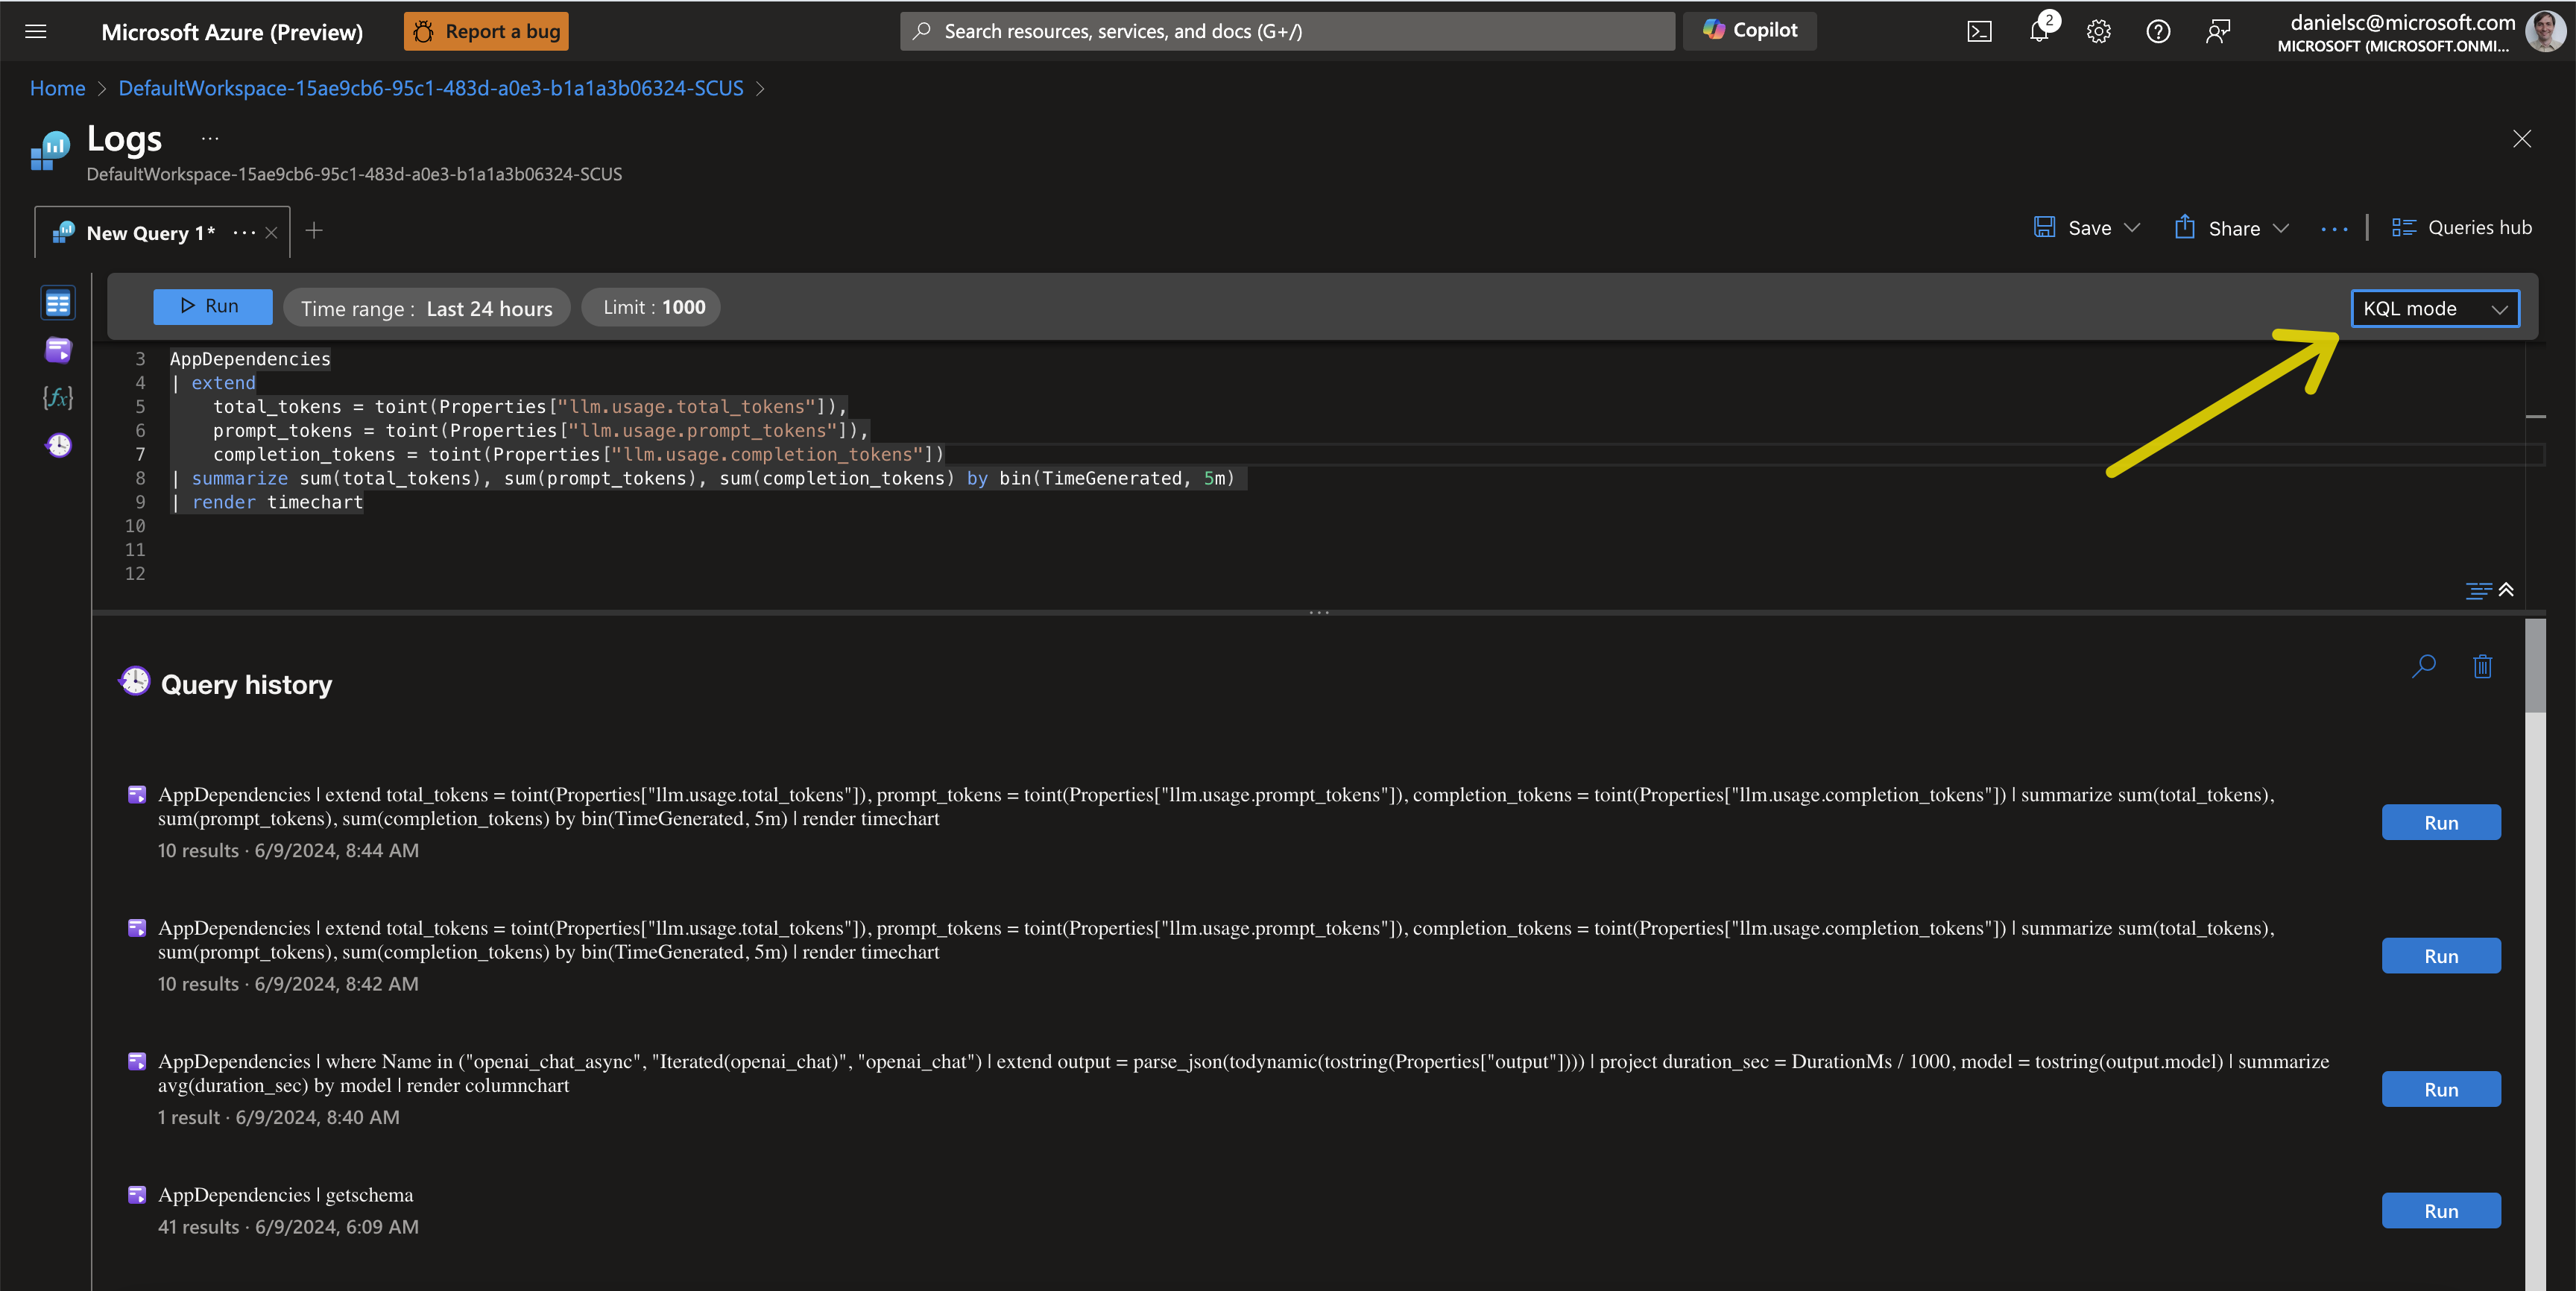
- In App Insights, got to the Logs view and create a new query. Make sure to edit your query in KQL Mode so you have access to the different tables. Here is an example of a query that shows the average duration of the OpenAI Chat calls by model/deployment name used:
dependencies
| where name == "openai_chat_async" or name == "Iterated(openai_chat)"
| extend inputs = parse_json(todynamic(tostring(customDimensions["inputs"])))
| project model = inputs.model, duration_sec = duration / 1000
| summarize avg(duration_sec) by tostring(model)
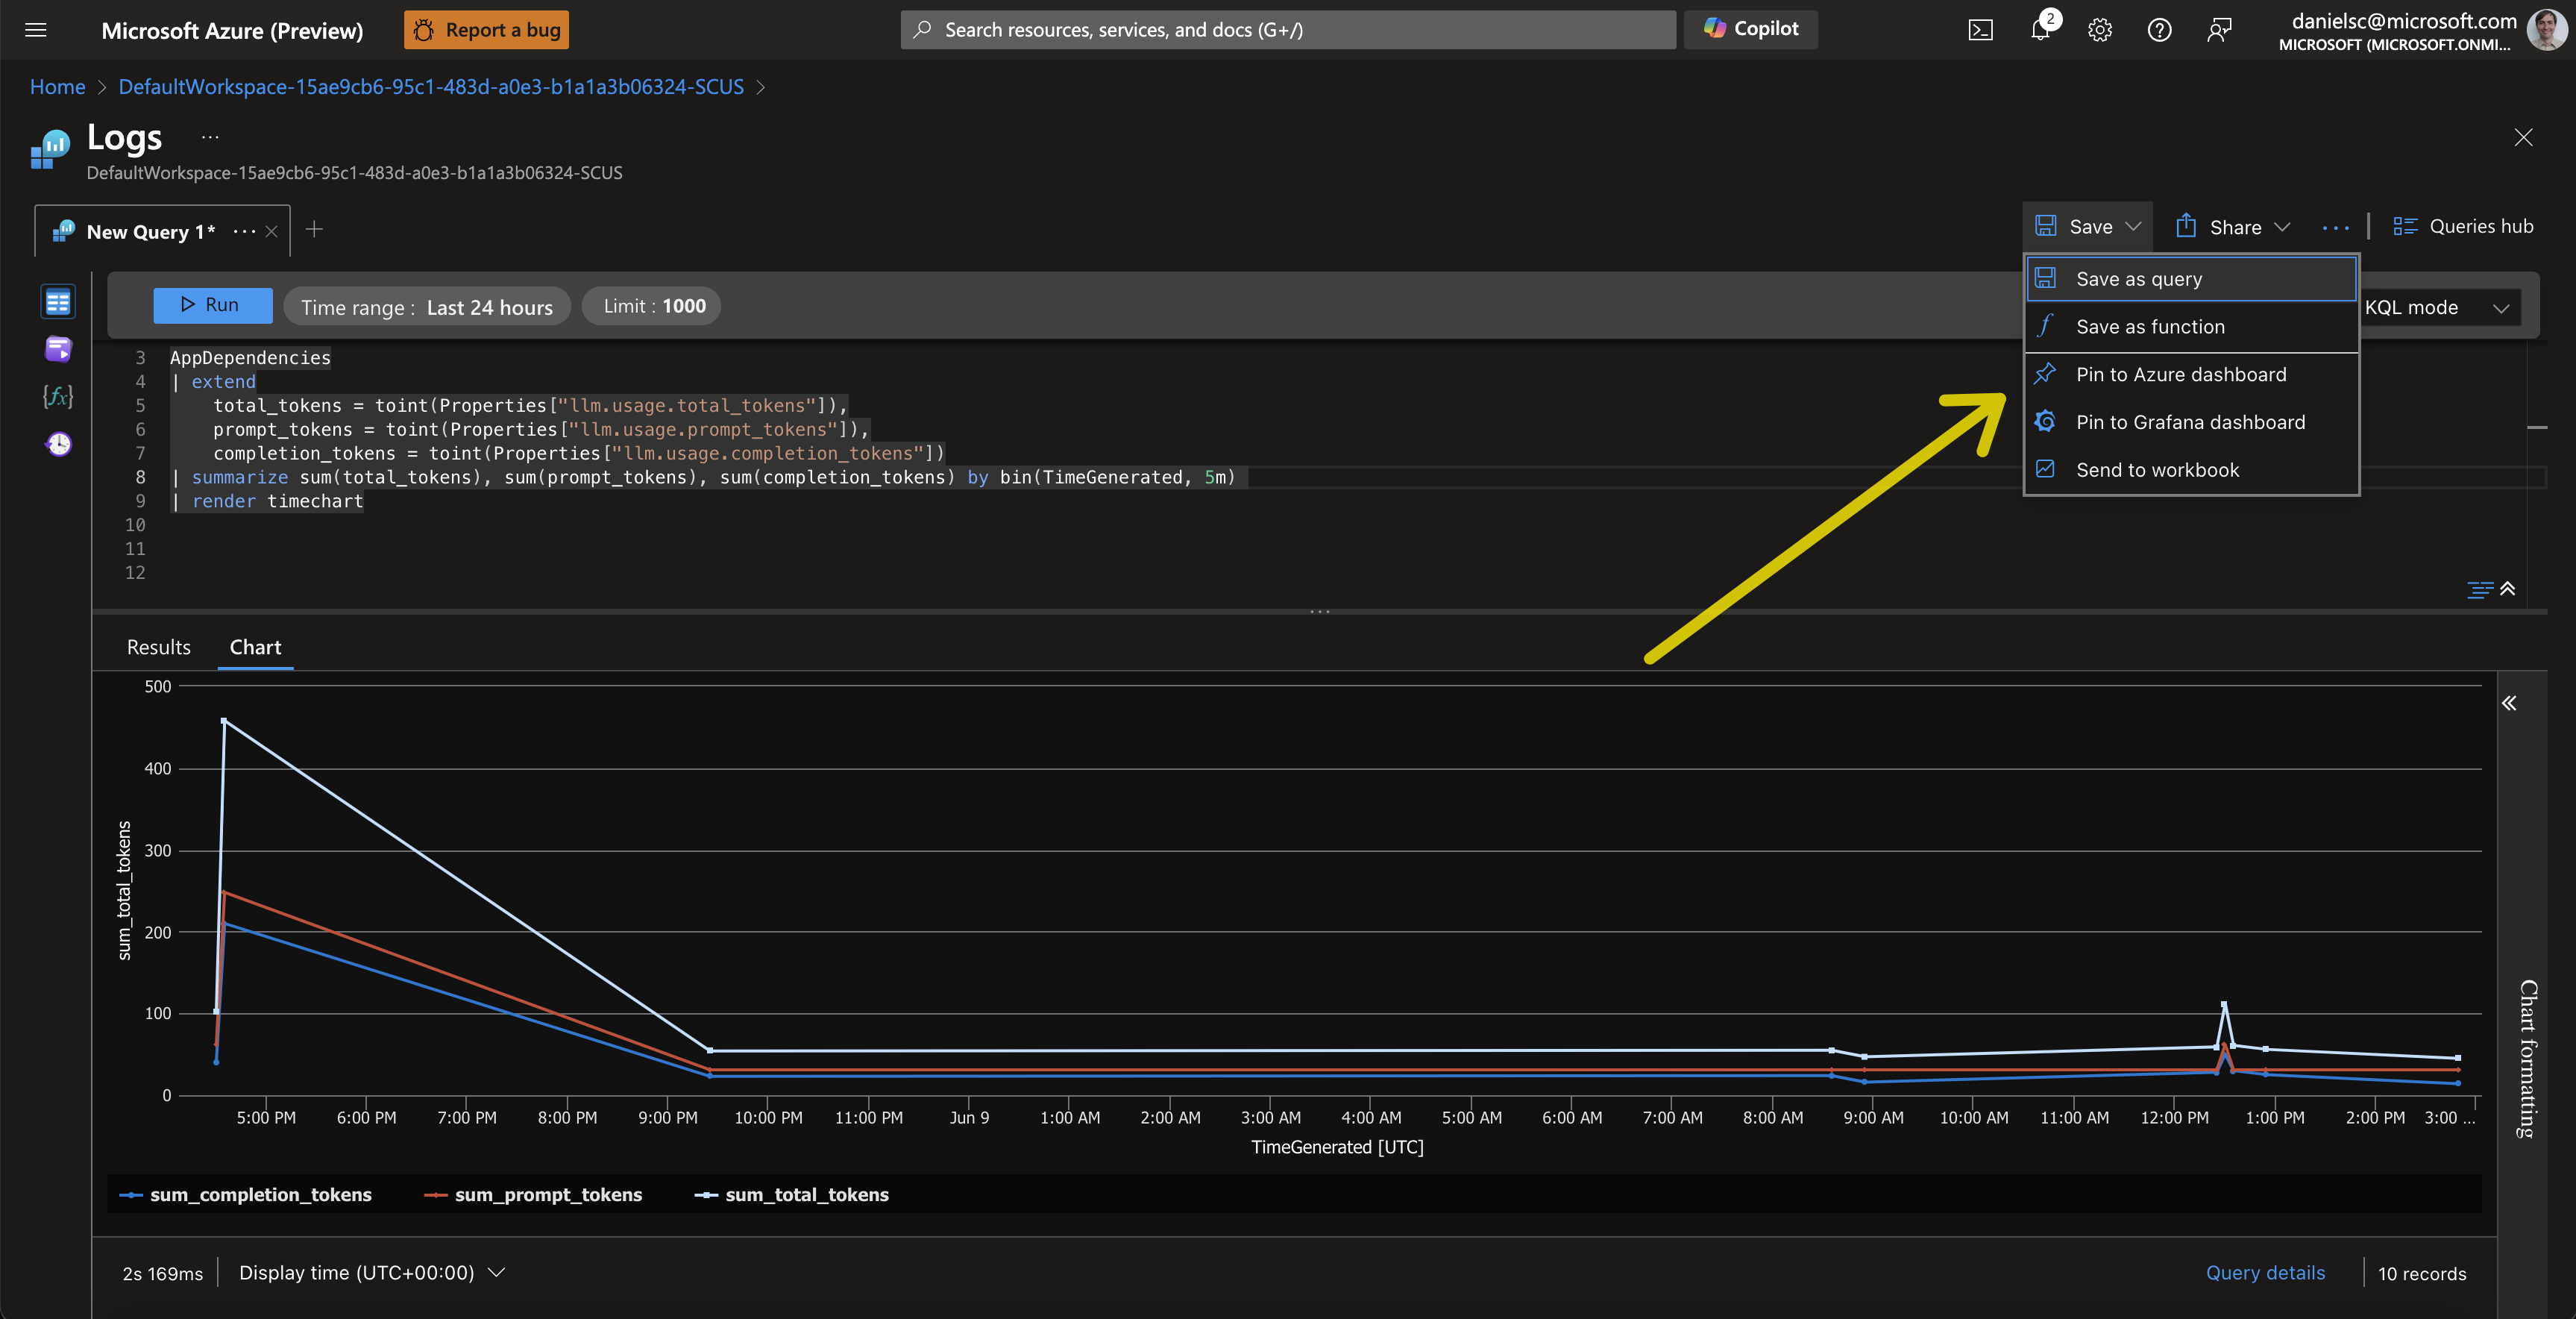
| render columnchart- Save the query and pin it to a dashboard. You can create a new dashboard or add it to an existing one.
- Once pinned to the Dashboard, you can edit the title and move/resize the chart as you see fit.
To manage your Azure Portal Dashboards, got to the Dashboard hub in the Azure Portal:
Here are a few KQL queries that you can use to get started with building your own dashboards:
- Average duration of OpenAI Chat calls by model/deployment name used:
dependencies
| where name == "openai_chat" or name == "openai_chat_async" or name == "Iterated(openai_chat)"
| extend inputs = parse_json(todynamic(tostring(customDimensions["inputs"])))
| project model = inputs.model, duration_sec = duration / 1000
| summarize avg(duration_sec) by tostring(model)
| render columnchart- Tokens used over time:
dependencies
| extend
    total_tokens = toint(customDimensions["llm.usage.total_tokens"]),
    prompt_tokens = toint(customDimensions["llm.usage.prompt_tokens"]),
    completion_tokens = toint(customDimensions["llm.usage.completion_tokens"])
| summarize sum(total_tokens), sum(prompt_tokens), sum(completion_tokens) by bin(timestamp, 5m)
| render timechart- Total tokens used by model/deployment
dependencies
| where name == "openai_chat" or name == "openai_chat_async" or name == "Iterated(openai_chat)"
| extend inputs = parse_json(todynamic(tostring(customDimensions["inputs"])))
| extend
    total_tokens = toint(customDimensions["llm.usage.total_tokens"]),
    prompt_tokens = toint(customDimensions["llm.usage.prompt_tokens"]),
    completion_tokens = toint(customDimensions["llm.usage.completion_tokens"]),
    model = tostring(inputs.model)
| summarize prompt = sum(prompt_tokens), completion = sum(completion_tokens) by model
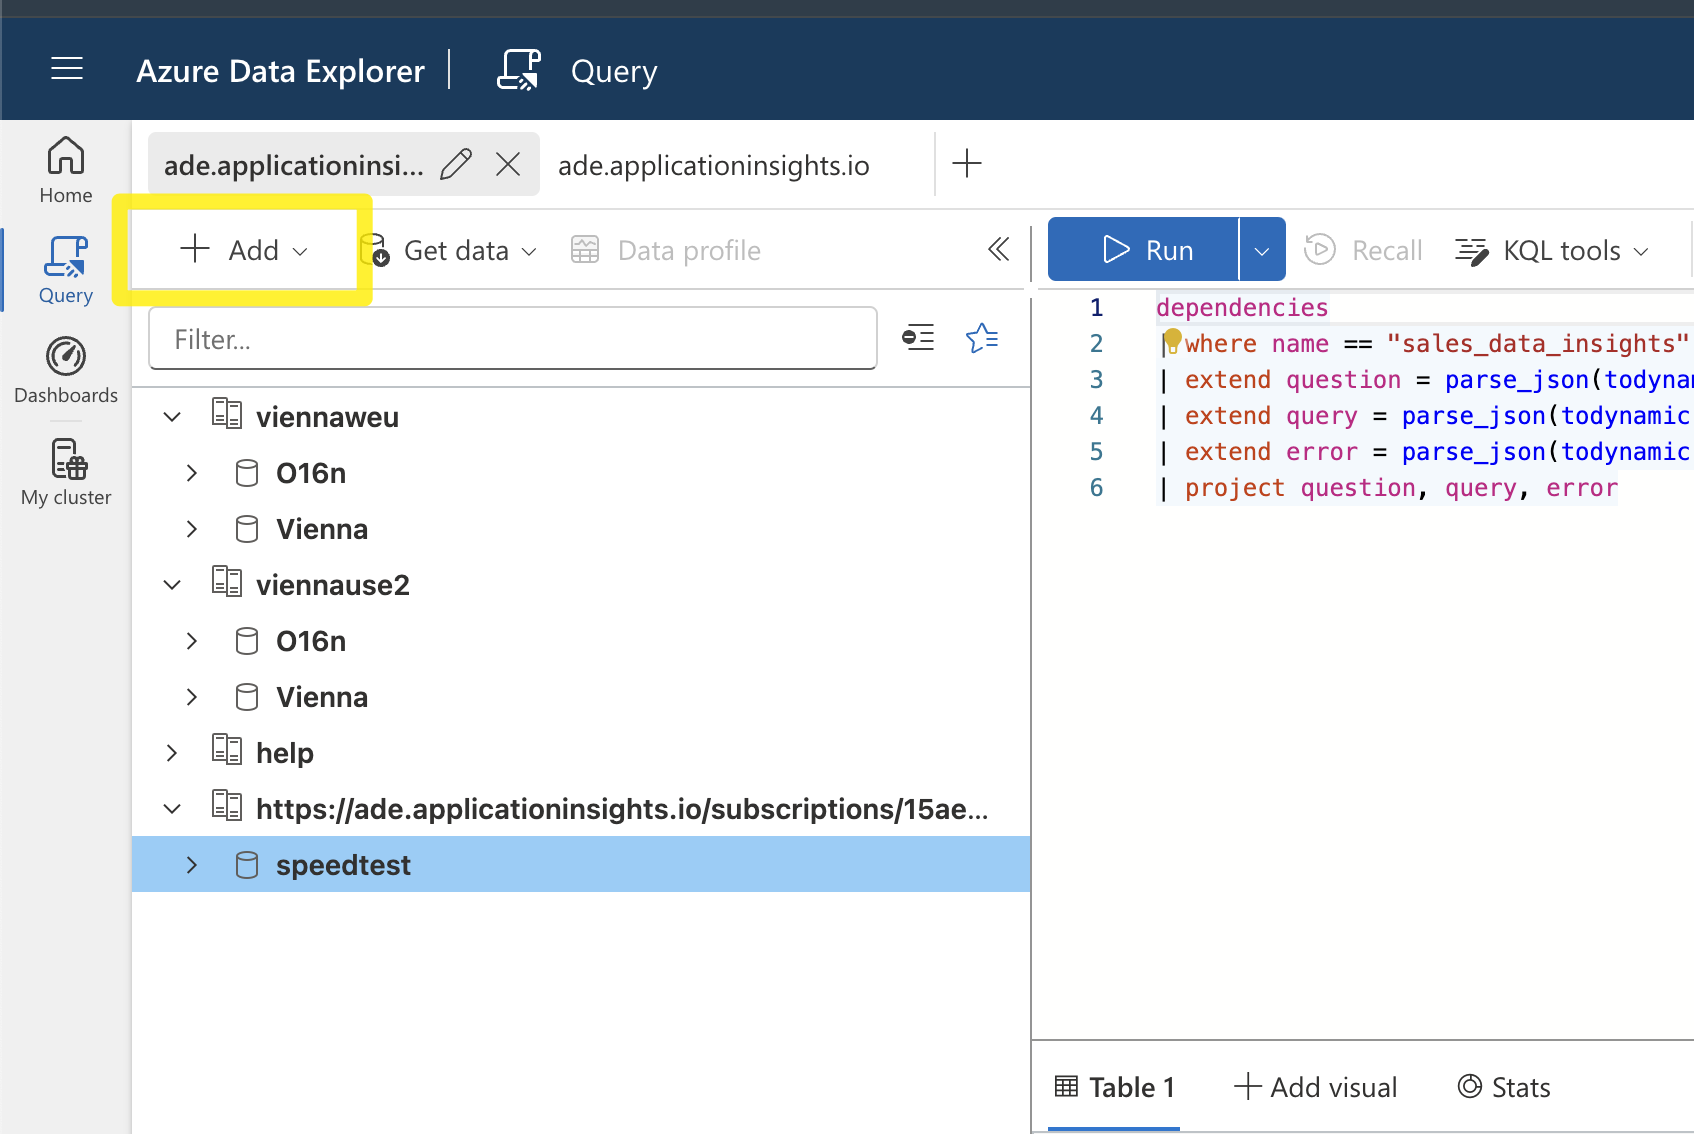
| render columnchart To query the data from you App Insights instance, go to https://dataexplorer.azure.com/ and add a connection:
Then add the URL for you App Insights instance like so:
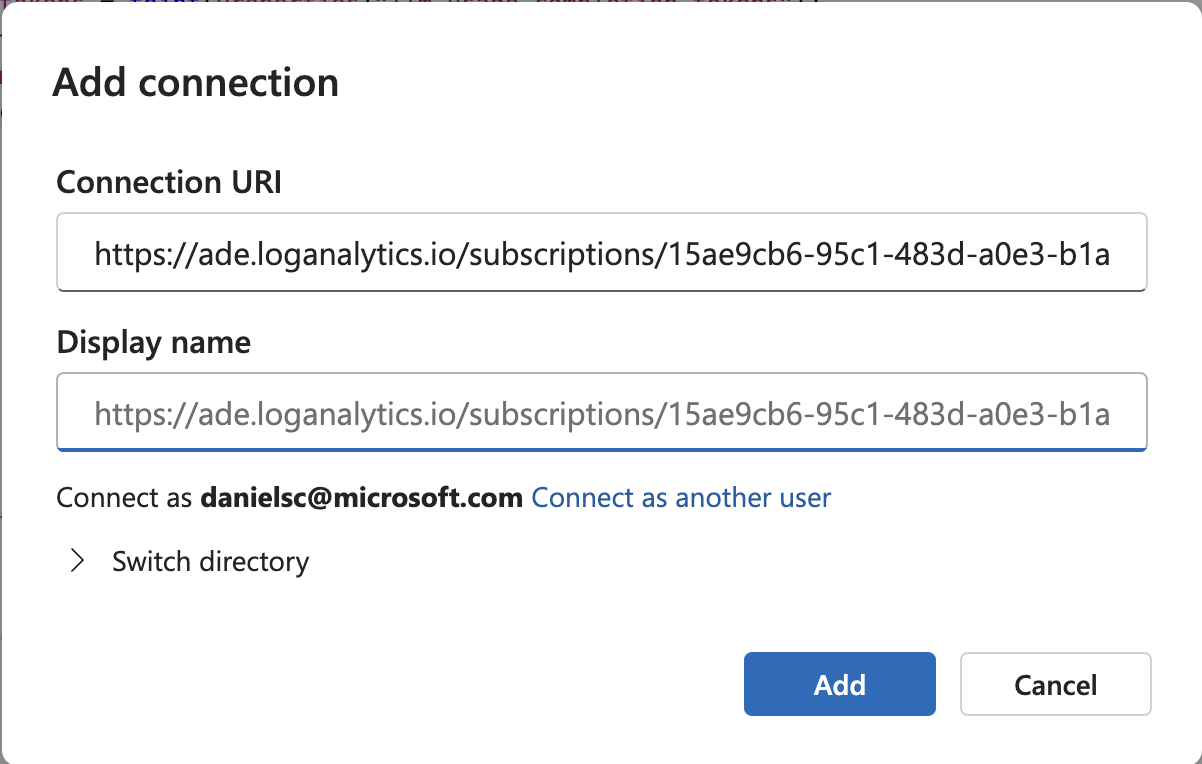
Following this format:
https://ade.applicationinsights.io/subscriptions/<your-subscription>/resourcegroups/<your-resource-gropu>/providers/microsoft.insights/components/<your-app-insights-instance>
This will allow you to execute the same queries as above and pin them to the same Dashboard.
In addition, you can pull data from App Insights to build datasets for validation and fine tuning. For instance, in our example the sub-flow that performs that provides the survey data insights is called survey_data_insights. That means that you will find traces with that name and with the span_type == "Flow" from which you can retrieve the input and output parameters with a query like this:
dependencies
| where name == "survey_data_insights" and customDimensions.span_type == "Flow"
| extend inputs = parse_json(tostring(customDimensions["inputs"]))
| extend output = parse_json(tostring(customDimensions["output"]))
| project inputs.question, output.query, output.error
Enjoy exploring your Promptflow telemetry!
This project welcomes contributions and suggestions. Most contributions require you to agree to a Contributor License Agreement (CLA) declaring that you have the right to, and actually do, grant us the rights to use your contribution. For details, visit https://cla.opensource.microsoft.com.
When you submit a pull request, a CLA bot will automatically determine whether you need to provide a CLA and decorate the PR appropriately (e.g., status check, comment). Simply follow the instructions provided by the bot. You will only need to do this once across all repos using our CLA.
This project has adopted the Microsoft Open Source Code of Conduct. For more information see the Code of Conduct FAQ or contact opencode@microsoft.com with any additional questions or comments.
This project may contain trademarks or logos for projects, products, or services. Authorized use of Microsoft trademarks or logos is subject to and must follow Microsoft's Trademark & Brand Guidelines. Use of Microsoft trademarks or logos in modified versions of this project must not cause confusion or imply Microsoft sponsorship. Any use of third-party trademarks or logos are subject to those third-party's policies.
This project follows below responsible AI guidelines and best practices, please review them before using this project:
- Microsoft Responsible AI Guidelines
- Responsible AI practices for Azure OpenAI models
- Safety evaluations transparency notes
https://learn.microsoft.com/en-us/azure/app-service/deploy-zip?tabs=cli#create-a-project-zip-package
