load-testing
A collection of best practices, workflows, scripts and scenarios that Cloud Posse uses for load and performance testing of websites and applications (in particular those deployed on Kubernetes clusters).
NOTE: All load testing scenarios in scenarios are just examples and are provided here for reference. Consider updating them to reflect your environment.
Introduction
For load and performance testing, the workflow consists of these main steps:
- Select and configure load testing tools
- Implement load testing scenarios and scripts
- Perform load testing and analyze the results
- Suggest improvements and tuning procedures for the infrastructure and application under test
Select and configure load testing tools
We use k6 from Load Impact for the following reasons:
- Open Source - well documented (see docs) and with simple command line usage
- Synthetic Testing - allows to easily create load test scenarios based on virtual users and simulated traffic configurations
- Small Footprint - implemented in Go, which has excellent support for concurrency and small memory footprint
- JavaScript DSL - scenario scripting in
JavaScriptES2015/ES6 with support for local and remote modules - Testing as Code - test logic and configuration options are both in JS for version control friendliness
- Command-line Driven - can be run from the command line with command & control through CLI
- Compatible with HAR - has a built-in HAR converter that will read HAR files and convert them to
k6scripts (see session recording) - Automated Testing - can be easily integrated into CI/CD pipelines
- Comprehensive Metrics - provides a comprehensive set of built-in metrics
- Beautiful Visualizations - can stream metrics into InfluxDB for storage and visualization with Grafana (see influxdb-grafana)
Read more about k6's features and metrics:
Installation
The docker-compose file builds three Docker images:
Run docker-compose up to build the containers and run InfluxDB and Grafana in the background
docker-compose up -d influxdb grafanaOpen http://localhost:3000 to see Grafana running.
By default, Grafana does not come with any pre-configured dashboards.
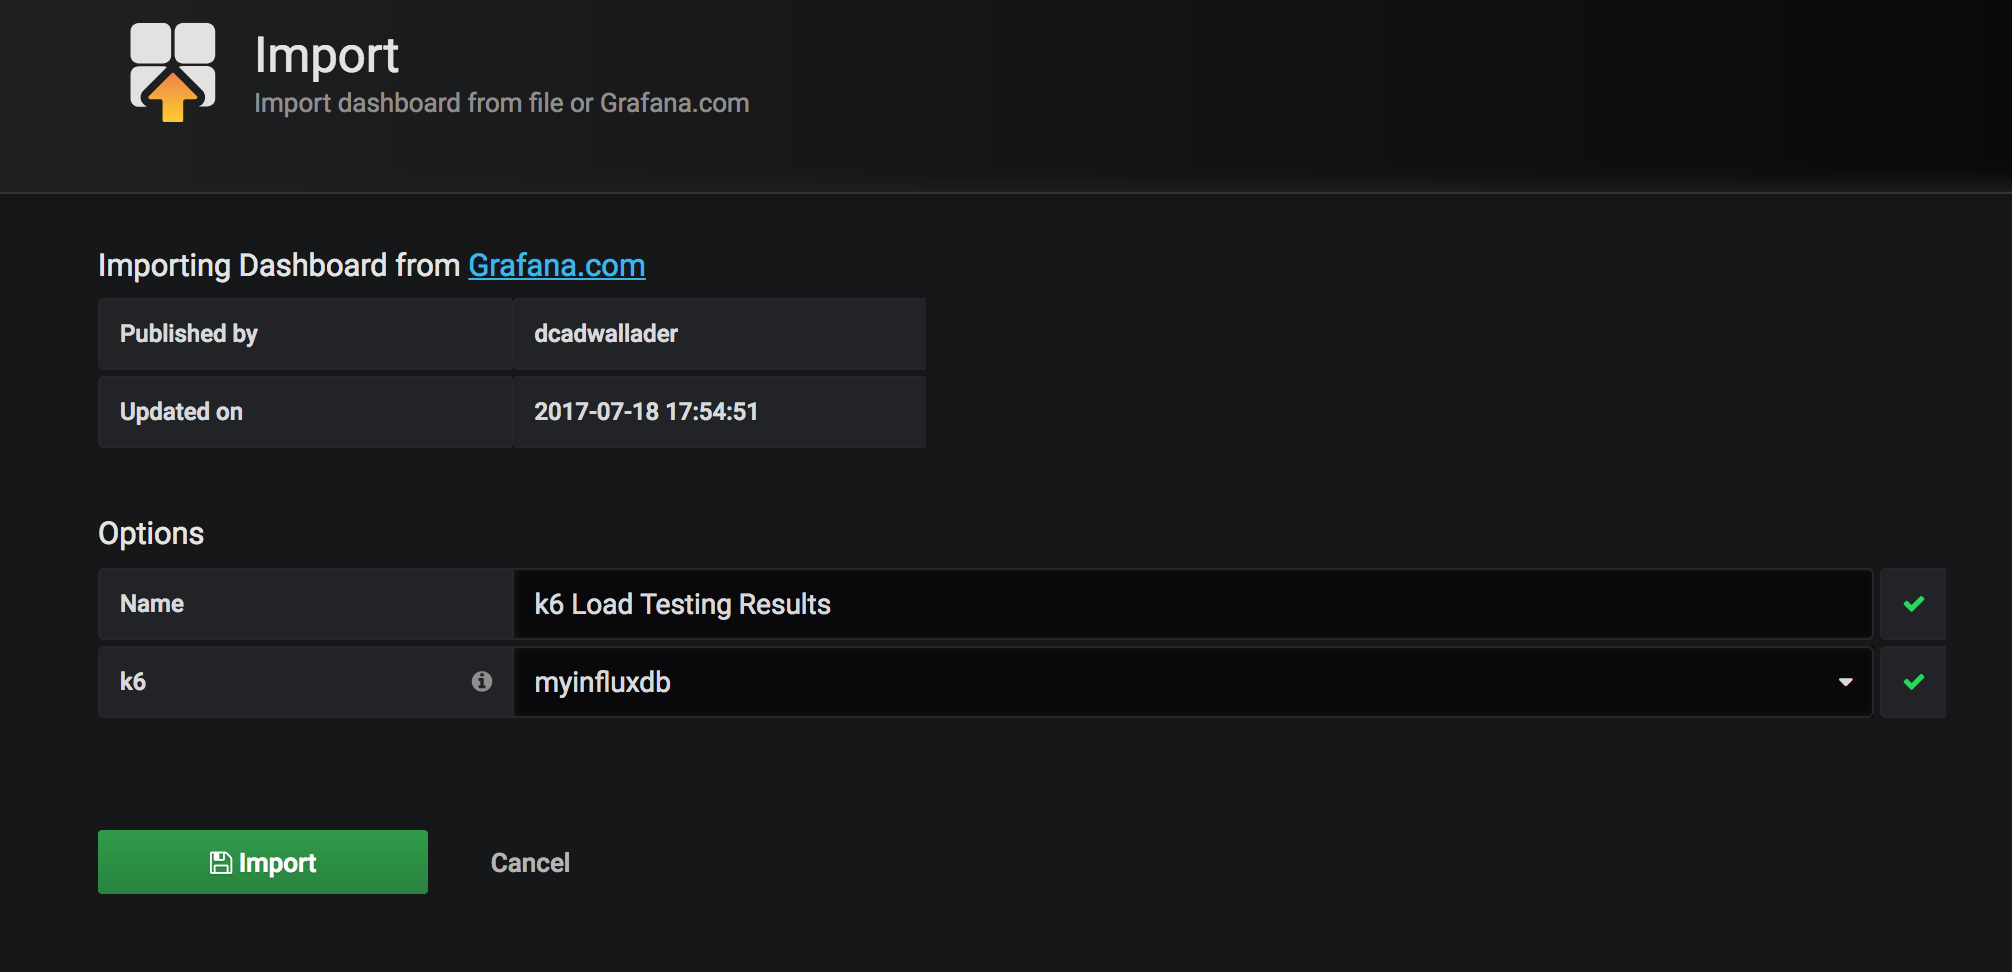
We will install this dashboard to visualize k6 metrics https://grafana.com/dashboards/2587
Go to +/Import menu and paste https://grafana.com/dashboards/2587 URL into the Grafana.com Dashboard field, then click Load button.
Then select myinfluxdb from the Select a InfluxDB data source dropdown and click Import.
Implement load testing scenarios and scripts
To establish a baseline, first we'll load test the website's home page with one concurrent user.
This will allow us to see the best performing numbers, against which we'd compare more advanced scenarios involving more pages and more concurrent users.
(see scenario_01)
import http from "k6/http";
import {check} from "k6";
import {config} from "./utils.js";

export function setup() {
}

export function teardown(data) {
}

export default function (data) {
    let res = http.get(config.baseUrl);
    check(res, {"status is 200": (r) => r.status === 200});
}
Run the test
docker-compose run -v $PWD/scenarios:/scenarios k6 run --vus 1 /scenarios/scenario_01.jsexecution: local
output: influxdb=http://influxdb:8086/k6 (http://influxdb:8086)
script: /scenarios/scenario_01.js
duration: -, iterations: 1
vus: 1, max: 1
done [==========================================================] 1 / 1
✓ status is 200
checks.....................: 100.00% ✓ 1 ✗ 0
data_received..............: 21 kB 29 kB/s
data_sent..................: 628 B 864 B/s
http_req_blocked...........: avg=507.78ms min=507.78ms med=507.78ms max=507.78ms p(90)=507.78ms p(95)=507.78ms
http_req_connecting........: avg=101.94ms min=101.94ms med=101.94ms max=101.94ms p(90)=101.94ms p(95)=101.94ms
http_req_duration..........: avg=218.25ms min=218.25ms med=218.25ms max=218.25ms p(90)=218.25ms p(95)=218.25ms
http_req_receiving.........: avg=98.58ms min=98.58ms med=98.58ms max=98.58ms p(90)=98.58ms p(95)=98.58ms
http_req_sending...........: avg=311.79µs min=311.79µs med=311.79µs max=311.79µs p(90)=311.79µs p(95)=311.79µs
http_req_tls_handshaking...: avg=233.84ms min=233.84ms med=233.84ms max=233.84ms p(90)=233.84ms p(95)=233.84ms
http_req_waiting...........: avg=119.36ms min=119.36ms med=119.36ms max=119.36ms p(90)=119.36ms p(95)=119.36ms
http_reqs..................: 1 1.377151/s
iteration_duration.........: avg=726.16ms min=726.16ms med=726.16ms max=726.16ms p(90)=726.16ms p(95)=726.16ms
iterations.................: 1 1.377151/s
vus........................: 1 min=1 max=1
vus_max....................: 1 min=1 max=1
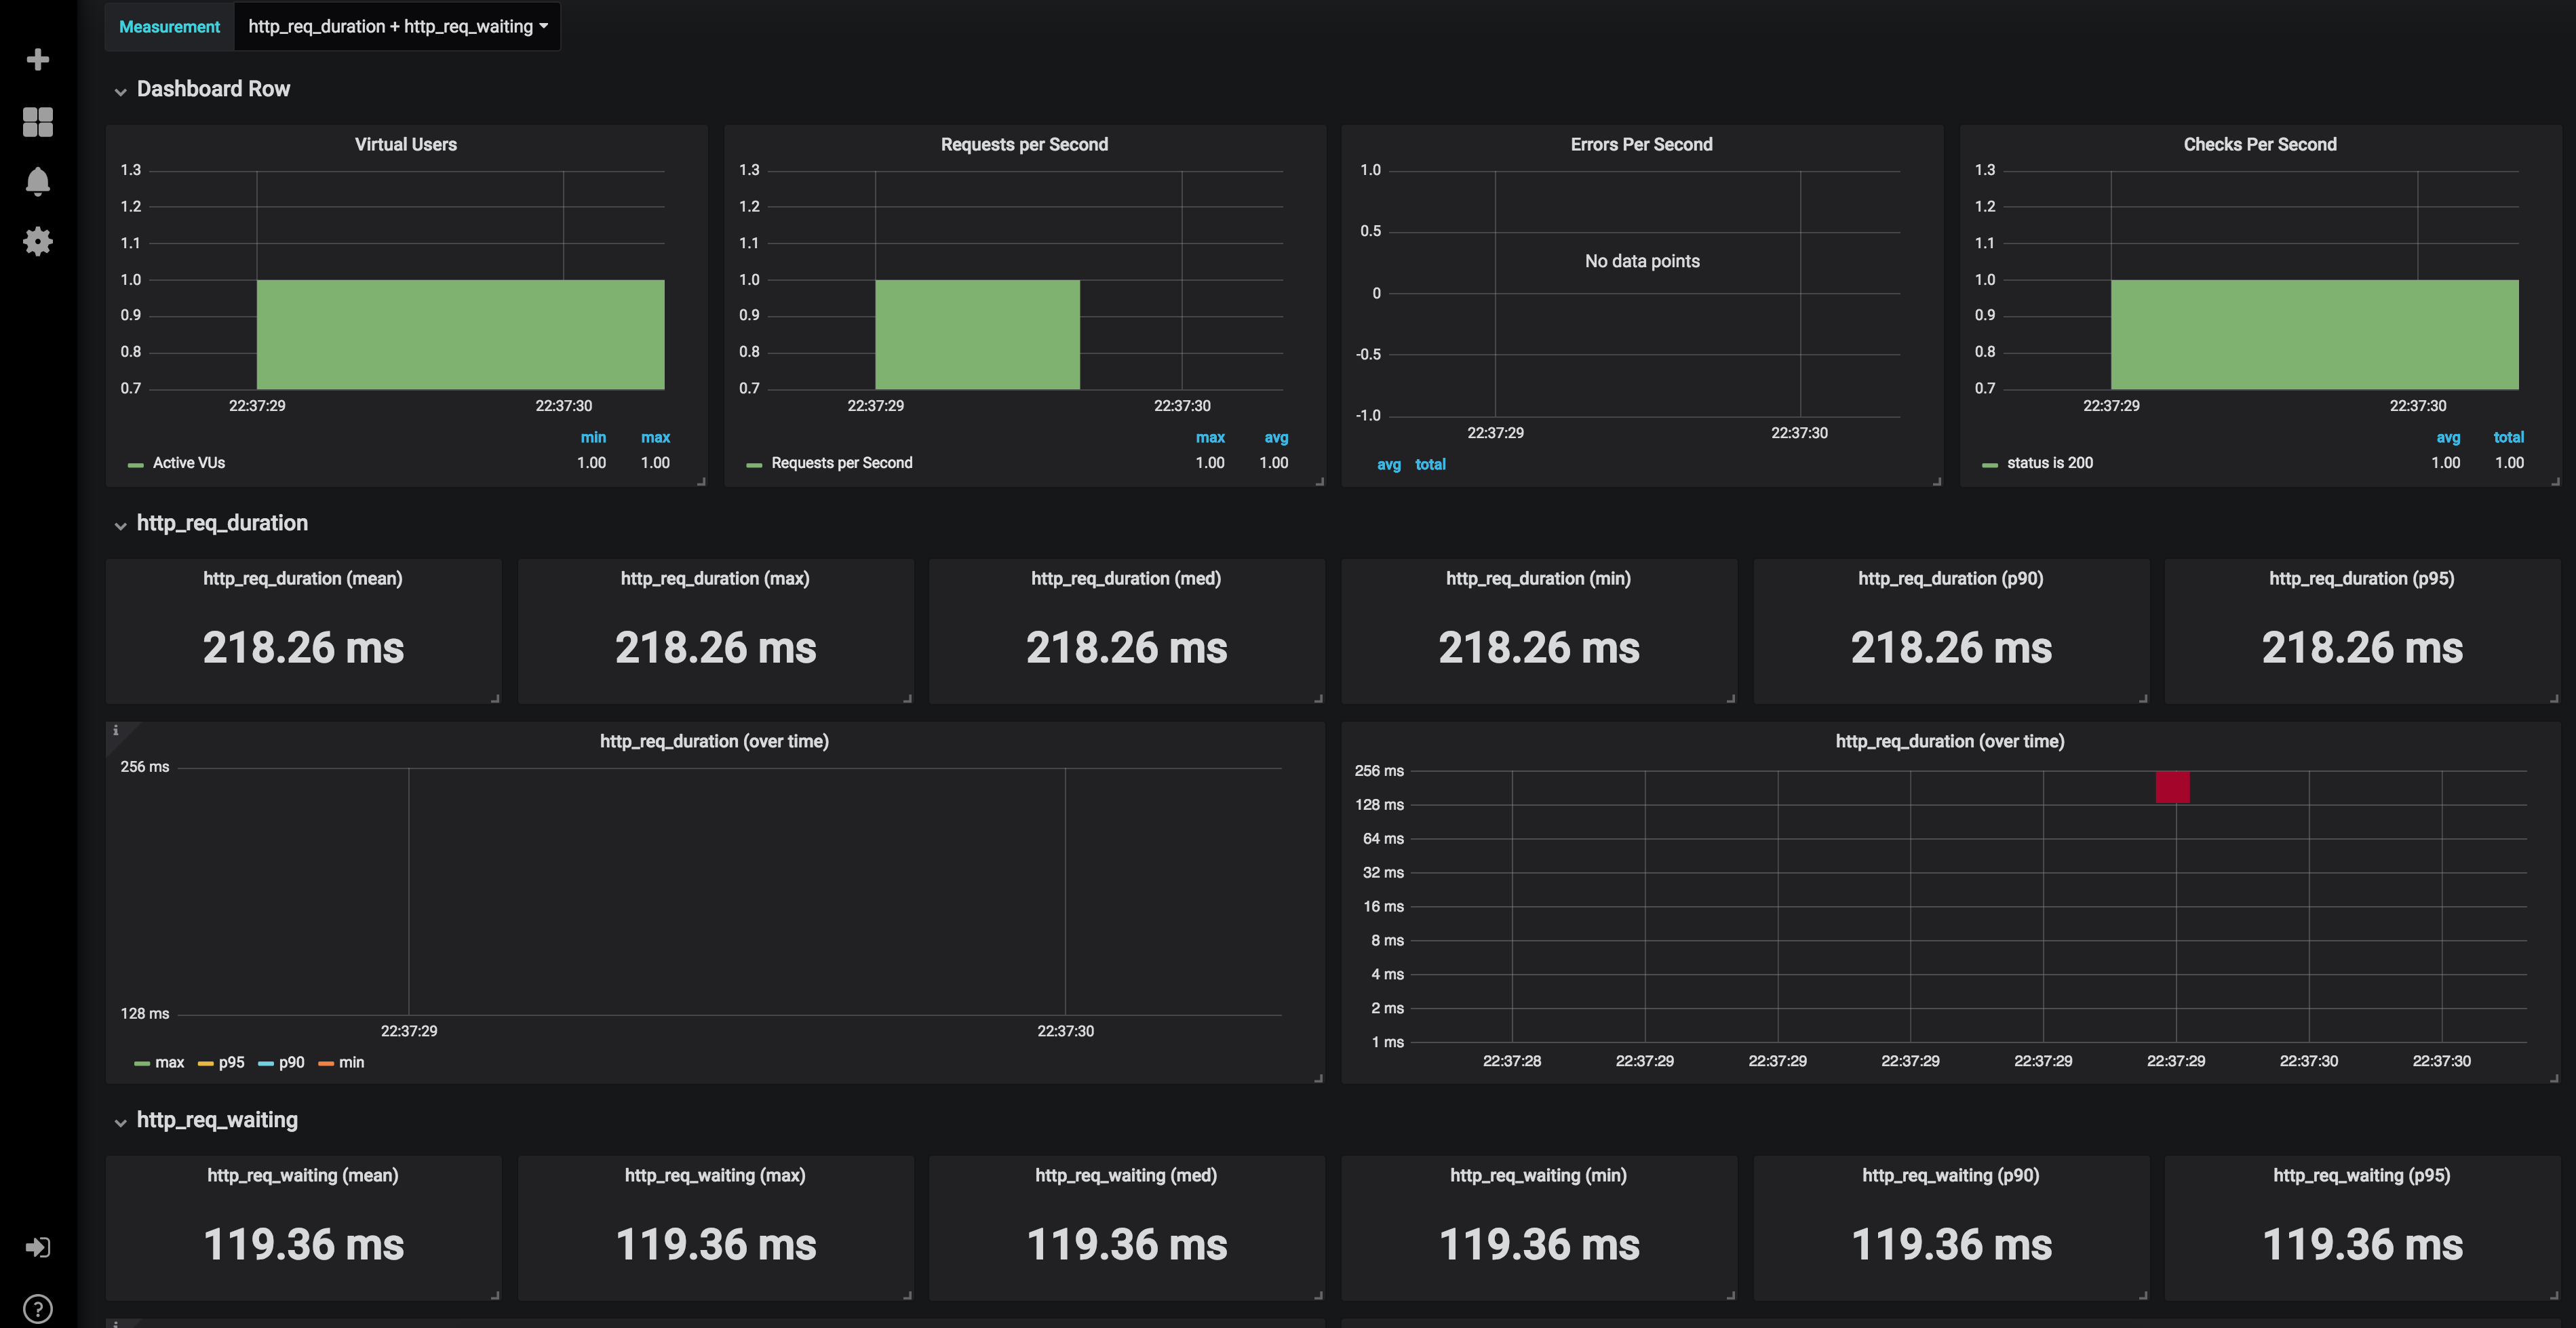
Open the Grafana dashboard at http://localhost:3000 to see the load test results
We assume that we want the website to handle 50 concurrent users.
Let's hit the home page with 50 concurrent users, each doing one iteration
docker-compose run -v $PWD/scenarios:/scenarios k6 run --vus 50 -i 50 /scenarios/scenario_01.jsexecution: local
output: influxdb=http://influxdb:8086/k6 (http://influxdb:8086)
script: /scenarios/scenario_01.js
duration: -, iterations: 50
vus: 50, max: 50
done [==========================================================] 50 / 50
✓ status is 200
checks.....................: 100.00% ✓ 50 ✗ 0
data_received..............: 1.1 MB 900 kB/s
data_sent..................: 32 kB 26 kB/s
http_req_blocked...........: avg=508.53ms min=367.91ms med=514.28ms max=626.1ms p(90)=535.23ms p(95)=580.65ms
http_req_connecting........: avg=118.73ms min=107.93ms med=116.3ms max=128.63ms p(90)=127.72ms p(95)=128.27ms
http_req_duration..........: avg=352.61ms min=242.46ms med=289.54ms max=693.7ms p(90)=586.94ms p(95)=677.55ms
http_req_receiving.........: avg=142.61ms min=106.13ms med=112.35ms max=325.64ms p(90)=221.21ms p(95)=243.53ms
http_req_sending...........: avg=302.04µs min=96µs med=216.3µs max=1.47ms p(90)=450.41µs p(95)=722.01µs
http_req_tls_handshaking...: avg=384.43ms min=255.68ms med=392.95ms max=490.64ms p(90)=400.86ms p(95)=445.49ms
http_req_waiting...........: avg=209.7ms min=121.49ms med=178.65ms max=465.43ms p(90)=372.73ms p(95)=449.88ms
http_reqs..................: 50 41.106944/s
iteration_duration.........: avg=861.49ms min=613.3ms med=821.16ms max=1.21s p(90)=1.1s p(95)=1.19s
iterations.................: 50 41.106944/s
vus........................: 50 min=50 max=50
vus_max....................: 50 min=50 max=50
We just loaded the website with 41.106944 requests per second.
Let's increase the number of iterations to hit the home page with approximately 50 requests per second.
docker-compose run -v $PWD/scenarios:/scenarios k6 run --vus 50 -i 80 /scenarios/scenario_01.jsexecution: local
output: influxdb=http://influxdb:8086/k6 (http://influxdb:8086)
script: /scenarios/scenario_01.js
duration: -, iterations: 80
vus: 50, max: 50
done [==========================================================] 80 / 80
✓ status is 200
checks.....................: 100.00% ✓ 80 ✗ 0
data_received..............: 1.6 MB 1.0 MB/s
data_sent..................: 36 kB 23 kB/s
http_req_blocked...........: avg=417.72ms min=0s med=654.48ms max=773.72ms p(90)=752.66ms p(95)=755.02ms
http_req_connecting........: avg=72.56ms min=0s med=109.63ms max=126.36ms p(90)=124.42ms p(95)=125.01ms
http_req_duration..........: avg=365.54ms min=124.6ms med=300.31ms max=798.99ms p(90)=675.51ms p(95)=767.64ms
http_req_receiving.........: avg=189.48ms min=383.2µs med=116.58ms max=572.32ms p(90)=357.2ms p(95)=553.45ms
http_req_sending...........: avg=171.3µs min=56.4µs med=156.7µs max=557.4µs p(90)=303.64µs p(95)=366.13µs
http_req_tls_handshaking...: avg=220.24ms min=0s med=344.77ms max=446.4ms p(90)=427.9ms p(95)=429.37ms
http_req_waiting...........: avg=175.89ms min=121.14ms med=148.49ms max=478.35ms p(90)=238.48ms p(95)=265.03ms
http_reqs..................: 80 50.821139/s
iteration_duration.........: avg=783.68ms min=124.91ms med=972.43ms max=1.55s p(90)=1.23s p(95)=1.36s
iterations.................: 80 50.821139/s
vus........................: 50 min=50 max=50
vus_max....................: 50 min=50 max=50
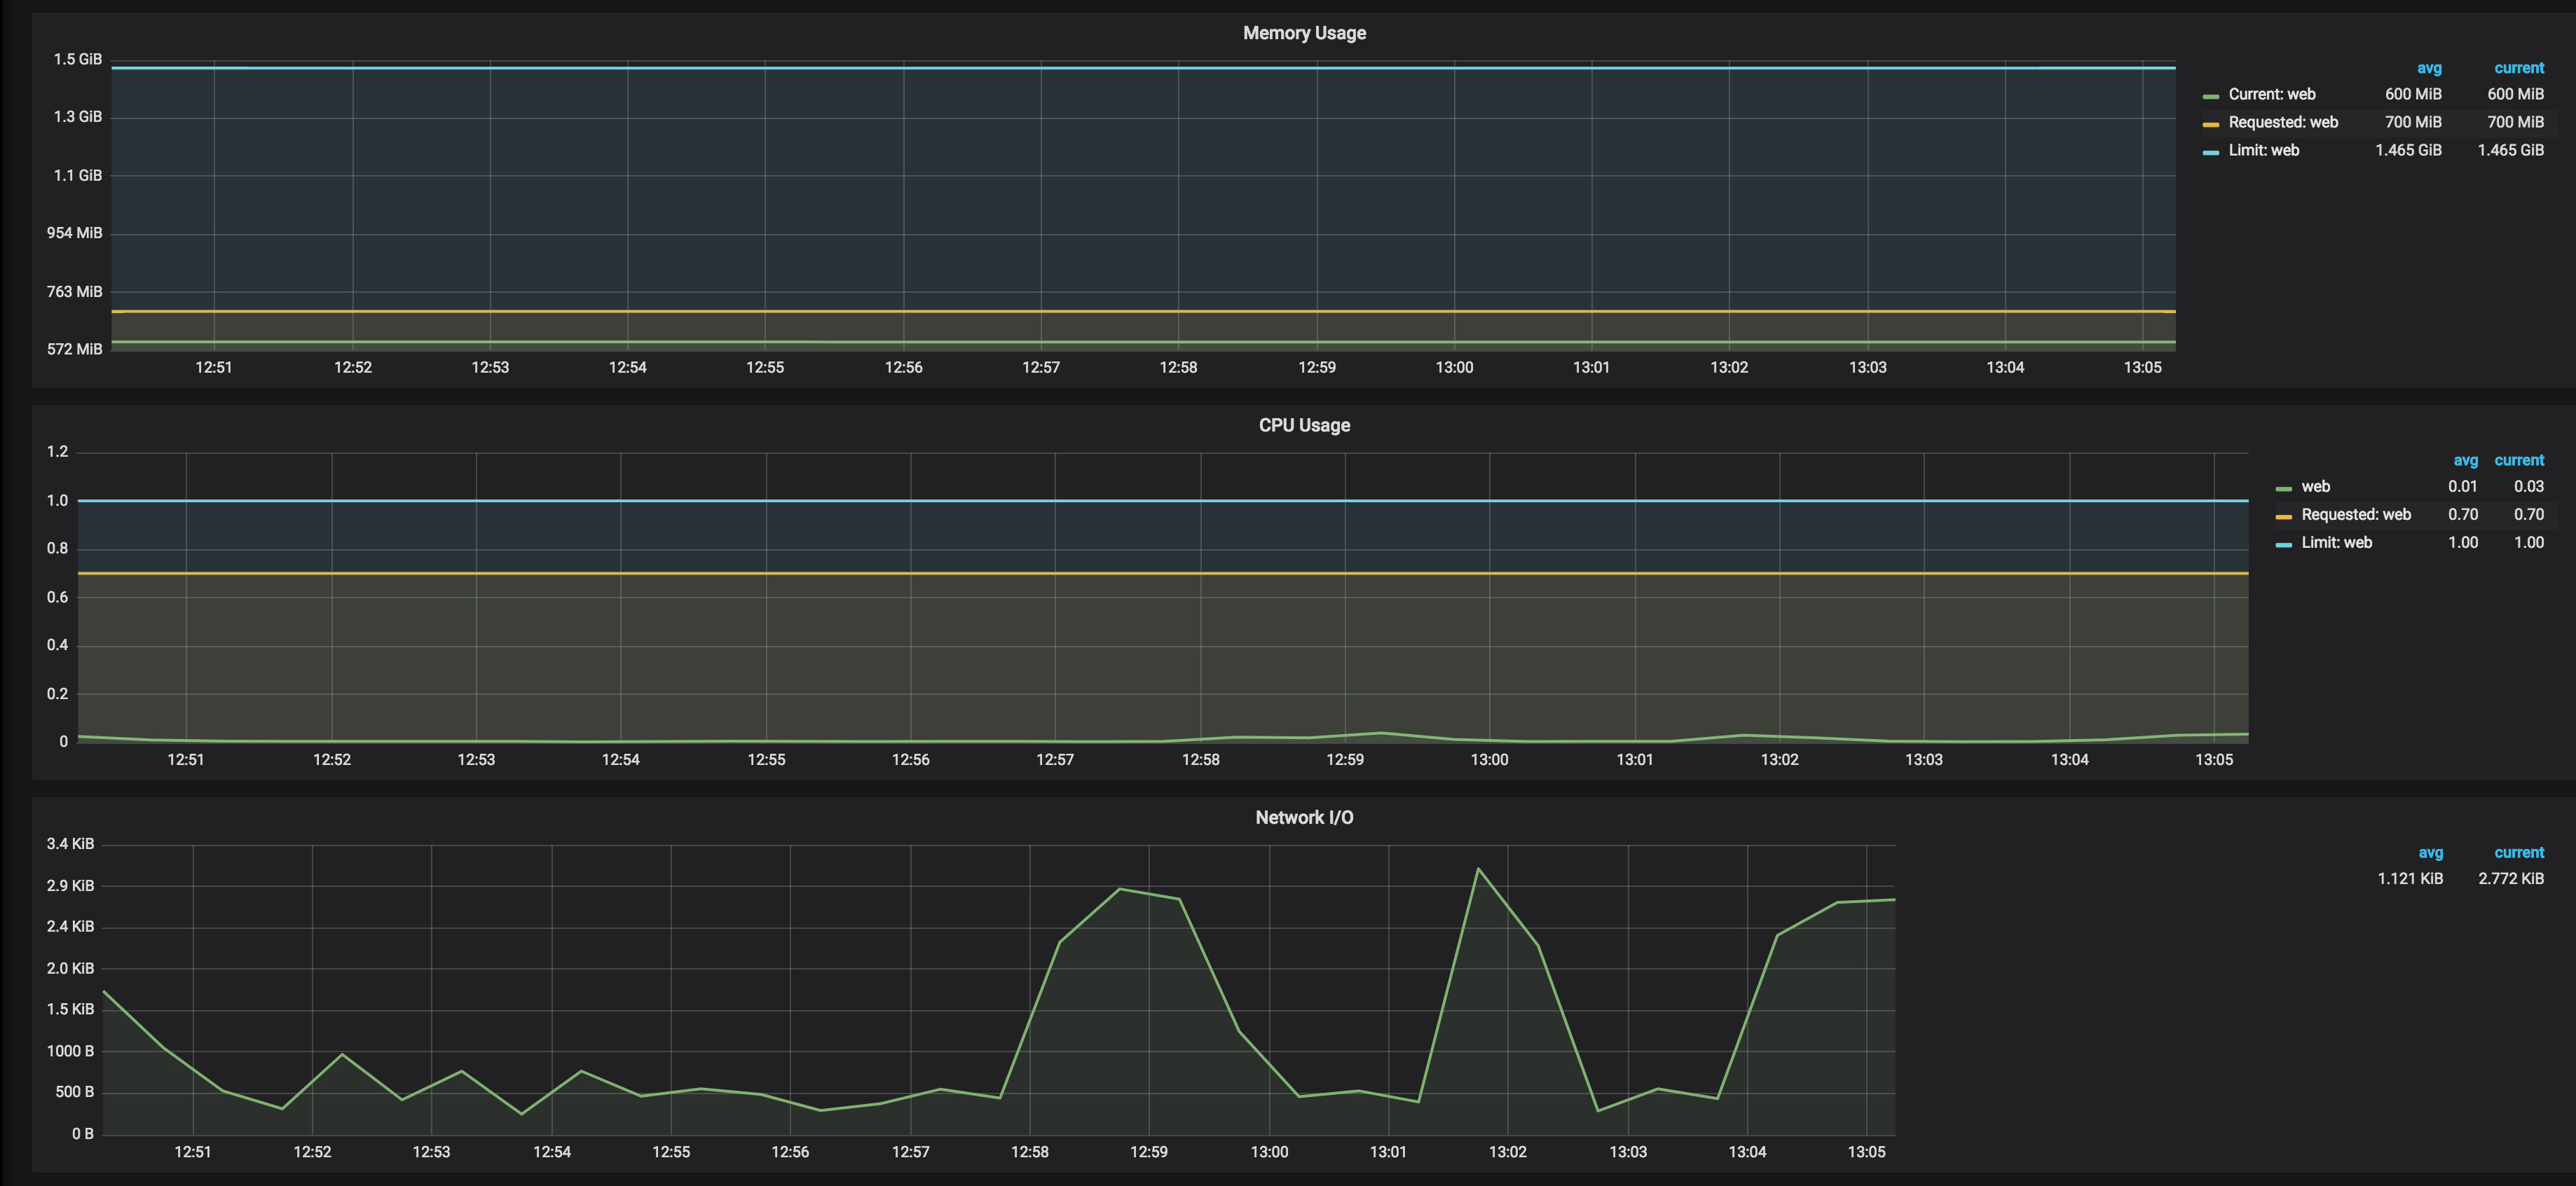
Check the Kubernetes pods CPU and memory consumption in the Kubernetes Grafana dashboard
We can conclude that with the current CPU and memory configurations for Kubernetes pods, the site can handle 50 requests per second to the home page.
Perform load testing and analyze the results
k6 has a built-in HAR converter that will read HAR files and convert them to k6 scripts that can then be executed.
See session recording for more details.
We recorded and prepared a sample scenario to test the complete user flow on a website, including signing up, creating a user profile, providing all required information, and finally getting a list of available options for the user (see scenario_all).
Run it with a single user
docker-compose run -v $PWD/scenarios:/scenarios k6 run --vus 1 -i 1 /scenarios/scenario_all.jsexecution: local
output: influxdb=http://influxdb:8086/k6 (http://influxdb:8086)
script: /scenarios/scenario_all.js
duration: -, iterations: 1
vus: 1, max: 1
done [==========================================================] 1 / 1
█ page_01 - home
█ page_02 - /profile
█ page_03 - /save_profile
█ page_04 - /add_categories
█ page_05 - /add_features
█ page_06 - /add_details
█ page_07 - /add_details2
█ page_08 - /users
█ page_09 - /enrollment
█ page_10 - /enrollment2
█ page_11 - /update_profile
data_received..............: 14 MB 630 kB/s
data_sent..................: 234 kB 11 kB/s
group_duration.............: avg=1.96s min=106.14ms med=1.75s max=4.91s p(90)=3.76s p(95)=4.34s
http_req_blocked...........: avg=33.98ms min=0s med=0s max=443.45ms p(90)=0s p(95)=441.04ms
http_req_connecting........: avg=7.36ms min=0s med=0s max=96.85ms p(90)=0s p(95)=95.41ms
http_req_duration..........: avg=227.61ms min=95.64ms med=148.8ms max=1.27s p(90)=464.57ms p(95)=806.93ms
http_req_receiving.........: avg=34.44ms min=76.3µs med=1.12ms max=1.11s p(90)=102.9ms p(95)=117.98ms
http_req_sending...........: avg=224.35µs min=83.5µs med=178.1µs max=1.45ms p(90)=346.46µs p(95)=545.93µs
http_req_tls_handshaking...: avg=17.26ms min=0s med=0s max=225.33ms p(90)=0s p(95)=224.26ms
http_req_waiting...........: avg=192.94ms min=95.41ms med=105.15ms max=998.45ms p(90)=374.83ms p(95)=652.32ms
http_reqs..................: 130 6.027408/s
iteration_duration.........: avg=21.56s min=21.56s med=21.56s max=21.56s p(90)=21.56s p(95)=21.56s
iterations.................: 1 0.046365/s
vus........................: 1 min=1 max=1
vus_max....................: 1 min=1 max=1
The entire process took 21 seconds.
Now run it with 50 concurrent users
docker-compose run -v $PWD/scenarios:/scenarios k6 run --vus 50 -i 50 /scenarios/scenario_all.jsexecution: local
output: influxdb=http://influxdb:8086/k6 (http://influxdb:8086)
script: /scenarios/scenario_all.js
duration: -, iterations: 50
vus: 50, max: 50
done [==========================================================] 50 / 50
█ page_01 - home
█ page_02 - /profile
█ page_03 - /save_profile
█ page_04 - /add_categories
█ page_05 - /add_features
█ page_06 - /add_details
█ page_07 - /add_details2
█ page_08 - /users
█ page_09 - /enrollment
█ page_10 - /enrollment2
█ page_11 - /update_profile
data_received..............: 679 MB 6.6 MB/s
data_sent..................: 12 MB 115 kB/s
group_duration.............: avg=5.78s min=104.4ms med=3.02s max=1m6s p(90)=10.88s p(95)=13.51s
http_req_blocked...........: avg=230.04ms min=0s med=0s max=5.64s p(90)=0s p(95)=2.93s
http_req_connecting........: avg=10.63ms min=0s med=0s max=321.33ms p(90)=0s p(95)=123.46ms
http_req_duration..........: avg=953.25ms min=128.3µs med=292.67ms max=59.93s p(90)=2.22s p(95)=3.19s
http_req_receiving.........: avg=223.82ms min=-15.0602ms med=2.04ms max=59.78s p(90)=389.02ms p(95)=1.14s
http_req_sending...........: avg=221.58µs min=70.8µs med=155.4µs max=8.2ms p(90)=337µs p(95)=469.13µs
http_req_tls_handshaking...: avg=206.19ms min=0s med=0s max=5.24s p(90)=0s p(95)=2.59s
http_req_waiting...........: avg=729.2ms min=0s med=199.58ms max=59.7s p(90)=1.96s p(95)=2.86s
http_reqs..................: 6500 63.046647/s
iteration_duration.........: avg=1m3s min=31.83s med=50.92s max=1m43s p(90)=1m39s p(95)=1m40s
iterations.................: 50 0.484974/s
vus........................: 50 min=50 max=50
vus_max....................: 50 min=50 max=50
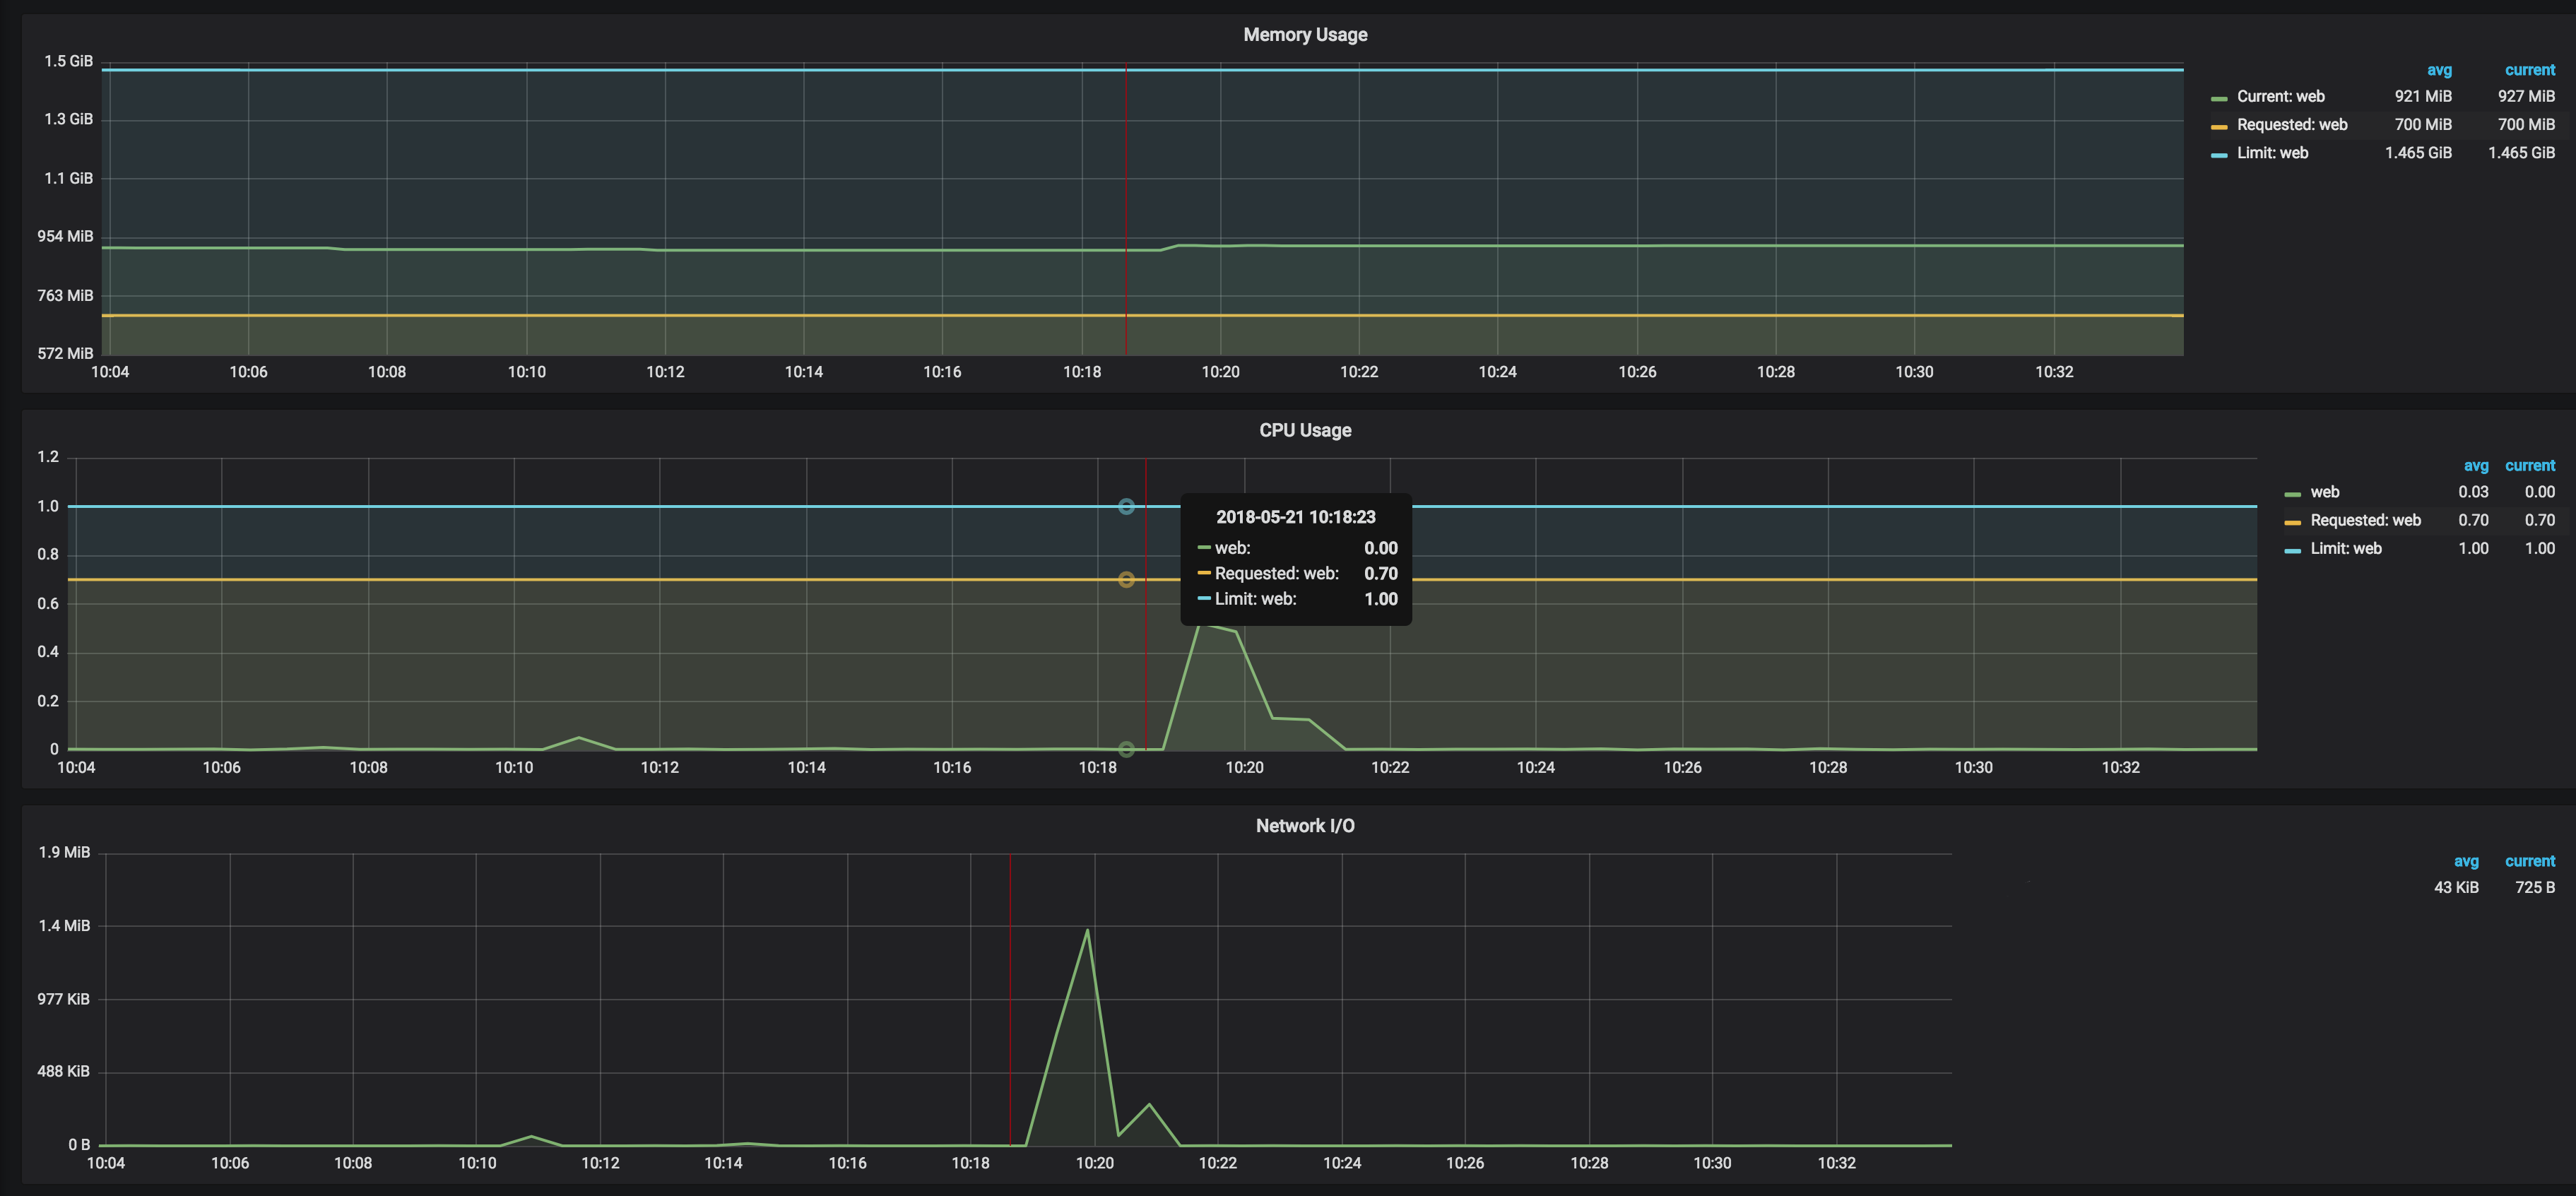
Check the Kubernetes pods CPU and memory consumption in the Kubernetes Grafana dashboard
From the load test stats and graphs above, we can conclude that the provisioned CPU and memory resources on the Kubernetes cluster are enough to sustain 50 concurrent users going through the entire flow.
Suggest improvements and tuning procedures for the infrastructure and application under test
Here are some optimization steps that we usually perform after running load tests:
- Put all static assets behind a CDN (e.g. AWS CloudFront), do not overload the Kubernetes pods with serving the static assets
- Scale Cluster Horizontally - Scale Kubernetes cluster horizontally by adding nodes
- Scale Cluster Vertically - Scale Kubernetes cluster vertically by using different types of EC2 instances
- Scale Pods Horizontally - Scale Kubernetes pods horizontally by increasing the replica count
- Scale Pods Vertically - Scale Kubernetes pods vertically by increasing CPU and Memory limits
- Scale Nginx Ingress Horizontally - Scale Nginx Ingress pods horizontally by increasing the replica count
- Scale Nginx Ingress Vertically - Scale Nginx Ingress vertically by increasing CPU and Memory limits
- Tune Nginx - Tune Nginx parameters (timeouts, worker processes, logs, http)
- Optimize application and web servers' parameters (e.g. concurrency, threads and processes, thread pools, timeouts, memory limits)
- Optimize databases - Optimize database queries and indexes
For more details, have a look at our comprehensive load testing documentation on our Cloud Posse Developer Hub.
Credits
Thanks to Load Impact for the excellent k6 tool and examples of load testing scenarios
Help
Got a question?
File a GitHub issue, send us an email or reach out to us on Gitter.
Contributing
Bug Reports & Feature Requests
Please use the issue tracker to report any bugs or file feature requests.
Developing
If you are interested in being a contributor and want to get involved in developing load-testing, we would love to hear from you! Shoot us an email.
In general, PRs are welcome. We follow the typical "fork-and-pull" Git workflow.
- Fork the repo on GitHub
- Clone the project to your own machine
- Commit changes to your own branch
- Push your work back up to your fork
- Submit a Pull request so that we can review your changes
NOTE: Be sure to merge the latest from "upstream" before making a pull request!
License
APACHE 2.0 © 2018 Cloud Posse, LLC
See LICENSE for full details.
Licensed to the Apache Software Foundation (ASF) under one
or more contributor license agreements.  See the NOTICE file
distributed with this work for additional information
regarding copyright ownership.  The ASF licenses this file
to you under the Apache License, Version 2.0 (the
"License"); you may not use this file except in compliance
with the License.  You may obtain a copy of the License at

  http://www.apache.org/licenses/LICENSE-2.0

Unless required by applicable law or agreed to in writing,
software distributed under the License is distributed on an
"AS IS" BASIS, WITHOUT WARRANTIES OR CONDITIONS OF ANY
KIND, either express or implied.  See the License for the
specific language governing permissions and limitations
under the License.
About
load-testing is maintained and funded by Cloud Posse, LLC.
Like it? Please let us know at hello@cloudposse.com
We love Open Source Software!
See our other projects or hire us to help build your next cloud platform.
Contributors
Erik Osterman |
Andriy Knysh |
Igor Rodionov |
Sarkis Varozian |
|---|


